Online Gambling Market (2026 - 2035)

Online Gambling Market Size, Share and Research Report By Game Type (Casino, Sports Betting, Lottery, Bingo), By Platform (Mobile / Tablet, Desktop), By Age Group (18–24 Years, 25–34 Years, 35–44 Years, 45–54 Years, 55+ Years), By Betting Type (Pre-Match / Fixed-Odds, Live / In-Play) and By Regional (North America, Europe, South America, Asia Pacific, Middle East and Africa) - Industry Forecast to 2035
ID: MRFR/ICT/7169-HCR
200 Pages
Apoorva Priyadarshi, Aarti Dhapte
Last Updated: June 22, 2026
Online Gambling Market

Market Size

Forecast Period2026-2035
CAGR (2026-2035)10.85%
2025 Market SizeUSD 116.50 Billion
2035 Market SizeUSD 326.27 Billion

Key Players

Flutter Entertainment
DraftKings
Bet365
Entain
Evolution Gaming Group
888 Holdings
Opportunities
  • Latin American Regulatory Openings
  • Convergence of Streaming Media and Wagering
  • Crypto and Blockchain Payment Rails

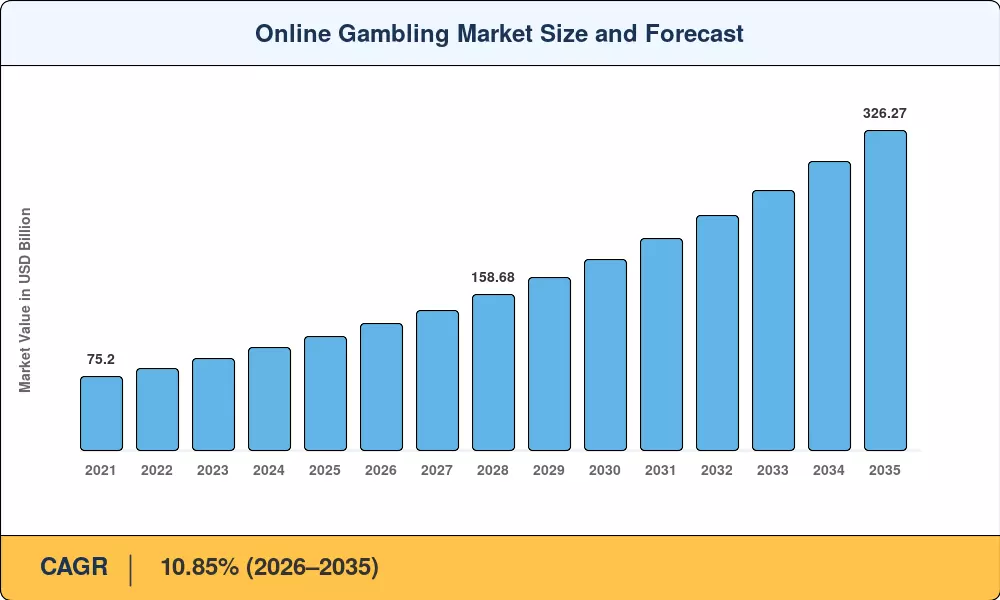
Online Gambling Market Summary

The Online Gambling Market reached USD 116.50 Billion in 2025 and is projected to climb from USD 129.14 Billion in 2026 to USD 326.27 Billion by 2035, expanding at a 10.85% CAGR during the forecast window. Two catalysts have propelled this growth trajectory: the rapid legalization of internet betting services across U.S. states — with over 35 states now permitting some form of digital wagering [2] — and the European Commission's push toward harmonized digital casino platforms licensing frameworks [3]. Governments see regulated iGaming software solutions as both a tax revenue stream and a mechanism to displace gray-market operators.

A technology overhaul is rewriting the sector's economics. Legacy on-premise sportsbook engines and first-generation random number generators are giving way to cloud-native architectures, AI-driven odds engines, and real-time data feeds that power hundreds of micro-markets per sporting event. Operators invested an estimated USD 9.8 billion in virtual gambling technology upgrades between 2022 and 2024, channeling capital into live-streaming infrastructure, low-latency payment rails, and responsible-gambling AI modules [4]. The shift has made online poker platforms and live-dealer studios competitive with — and often superior to — land-based venue experiences.

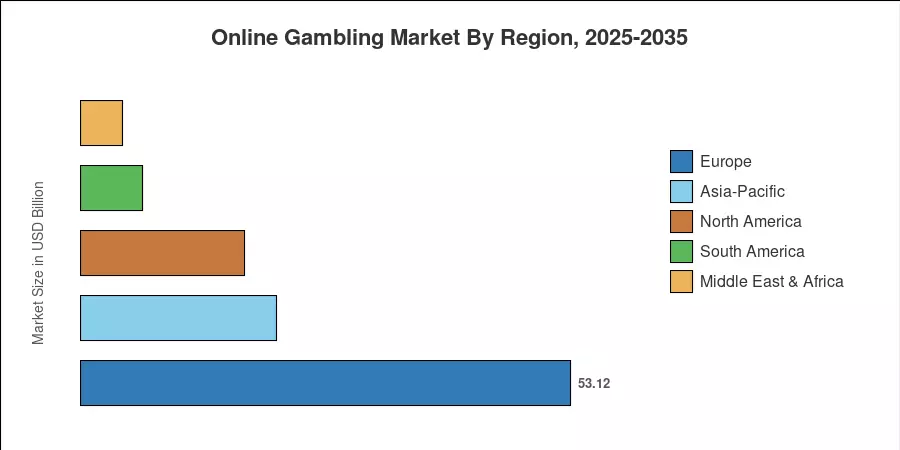
Europe commanded roughly 45.6% of the Online Gambling Market in 2025, anchored by mature regulatory regimes in the UK, Malta, and the Nordics North America, however, is accelerating at the fastest clip — a 15.25% CAGR through 2035 — as state-by-state legalization unlocks fresh demand for internet betting services. Asia-Pacific holds the second-largest share at 18.2%, driven by the adoption of digital casino platforms in the Philippines, India, and Japan. The next decade will hinge on how regulators balance consumer protection with market liberalization across all five regions.


Key Report Takeaways

• By Game Type

  • Casino gaming captured 46.4% of the Online Gambling Market in 2025, reflecting strong consumer demand for live-dealer and slot-based digital casino platforms
  • Sports betting is forecast to register an 11.90% CAGR through 2035, fueled by proliferating internet betting services and real-time wagering formats

• By Platform

  • Mobile and tablet devices accounted for 61.1% revenue share across the Online Gambling Market, underscoring the dominance of smartphone-first iGaming software solutions
  • Desktop platforms continue to attract high-value online poker platform users who prefer multi-tabling interfaces

• By Region

  • Europe led the Online Gambling Market with USD 53.12 Billion in 2025 revenue, supported by unified licensing in Malta, the UK, and Sweden
  • North America is the fastest-growing region at a 15.25% CAGR, as newly regulated U.S. states activate virtual gambling technology ecosystems


Market Size and Forecast (2021–2035)

Market Research Future (MRFR)'s proprietary estimation framework integrates top-down government revenue disclosures, bottom-up operator financial reports, and econometric modeling calibrated against third-party benchmarks. Historical figures draw from published annual reports of publicly listed operators, regulatory body filings, and GSMA mobile penetration data [1]. Forecast values apply a constant CAGR of 10.85% from the 2026 base, with adjustments for identified regulatory catalysts and restraint scenarios.

Online Gambling Market Size and Forecast
Our Impact
Enabled $4.3B Revenue Impact for Fortune 500 and Leading Multinationals
Partnering with 2000+ Global Organizations Each Year
30K+ Citations by Top-Tier Firms in the Industry

Driver Impact Analysis

Driver ~% Impact on CAGR Geographic Relevance Impact Timeline
Smartphone penetration & 5G expansion +2.1% Global Short-term (≤2 yr)
State-by-state U.S. legalization +1.8% North America Medium-term (2–4 yr)
Live/in-play betting technology +1.5% Global Short-term (≤2 yr)
AI-driven responsible gambling tools +1.2% Europe, North America Medium-term (2–4 yr)
Crypto & blockchain payment integration +0.9% Global Long-term (≥4 yr)
Emerging market legalization (LatAm, Asia) +1.0% South America, Asia-Pacific Long-term (≥4 yr)
Convergence of media streaming & betting +0.8% North America, Europe Medium-term (2–4 yr)


Smartphone Penetration and 5G Expansion

The GSMA reports global 5G connections surpassed 2 billion in late 2024, with North America leading at a 55% adoption rate [1]. For the Online Gambling Market, this translates directly into lower-latency live-streaming sessions and near-instant bet settlement — two capabilities that digital casino platform operators cite as the top drivers of customer retention. Mobile-first iGaming software solutions now account for over 60% of gross gaming revenue in markets like the UK and New Jersey, and 5G will push that share higher as operators deploy augmented-reality table games that require sustained high-bandwidth connections.

4.2 U.S. State-by-State Legalization

More than 35 U.S. states have permitted mobile sports betting since the 2018 PASPA repeal, but only seven states—New Jersey, Pennsylvania, Michigan, West Virginia, Connecticut, Delaware, and Rhode Island—allow full-suite online casino (iCasino) operations, with Maine moving closer to launch. Within three years of launch, each active iCasino state generates an estimated USD 800 million to USD 1.5 billion in gross gaming income, despite the smaller geographic reach of digital slots and table games. According to the American Gaming Association, the total income from online betting services in the United States is expected to surpass USD 35 billion by 2028, making the domestic market a leading growth engine for the worldwide online gambling market.


Live/In-Play Betting Technology

Real-time data feeds from providers such as Sportradar and Genius Sports now support over 900 micro-markets per Premier League football match [6]. This granularity has lifted average bet frequency per session by 40% since 2021 and expanded the average ticket size by 22% across European virtual gambling technology platforms. Operators investing in low-latency cloud infrastructure report in-play revenue shares climbing past 48% of total sportsbook turnover, confirming the segment's transition from niche product to core revenue pillar within the Online Gambling Market.

AI-Driven Responsible Gambling Tools

The UK Gambling Commission mandated algorithmic affordability checks in 2024, requiring operators to deploy AI models that flag at-risk player behavior in real time [7]. Compliance costs run between GBP 3 Million and GBP 8 Million per operator, yet firms that adopted early report a 15% reduction in customer churn — safer players stay longer. This regulatory push is making responsible-gambling AI a competitive differentiator for iGaming software solutions vendors, and it reinforces the Online Gambling Market's long-term sustainability narrative for institutional investors.


Restraints Impact Analysis

As with drivers, the restraint impact percentages are directional and non-additive to the headline CAGR. They represent potential downside scenarios modeled within MARKET RESEARCH FUTURE (MRFR)'s analytical framework.

Restraint ~% Impact on CAGR Geographic Relevance Impact Timeline
Fragmented & inconsistent regulations −1.4% Global Long-term (≥4 yr)
Problem gambling & social backlash −1.0% Europe, North America Medium-term (2–4 yr)
High taxation regimes −0.8% Europe Short-term (≤2 yr)
Cybersecurity & fraud risks −0.7% Global Medium-term (2–4 yr)
Advertising restrictions −0.5% Europe, Australia Short-term (≤2 yr)


Fragmented Regulatory Landscape

Even with advancements in the EU and the US, the online gambling industry still has to deal with a patchwork of licensing regulations that cost cross-border companies a lot of money to comply with. Malta's free policy contrasts markedly with Germany's Interstate Treaty on Gambling, which established a monthly deposit cap of EUR 1,000 and a general prohibition on virtual slot autoplay [12]. Maintaining distinct compliance stacks for more than 15 jurisdictions can cost mid-tier digital casino platform providers 8–12% of gross revenue, reducing margins and discouraging market entry.


Problem Gambling and Social Backlash

Public health advocacy groups have intensified campaigns linking online poker platforms and sports-betting apps to rising addiction rates among young adults. Australia banned gambling advertising during live sports broadcasts in 2024, and Italy imposed strict deposit limits for users under 25 [15]. These measures directly constrain user acquisition budgets — the lifeblood of growth-stage internet betting services operators — and could trim the Online Gambling Market's addressable audience by an estimated 5–8% in heavily regulated jurisdictions [7].

High Taxation Regimes

Mid-tier brands face substantial obstacles to entrance as a result of some European governments raising point-of-consumption levies over viable margins. The basic public levy on online sports betting Gross Gaming Revenue (GGR) in France has been raised to 59.3% due to fiscal adjustments. This is in addition to a social security contribution (CSG) rate that has been raised to 15% of GGR. These statutory modifications require digital operators to give up over three-quarters of their gross margin to state entities when additional marketing and promotional expenditure taxes are taken into account. Smaller vendors of iGaming software solutions find it difficult to sustain successful unit economics in the current difficult financial times, especially in areas where customer acquisition costs (CAC) surpass EUR 250 per depositing player. The online gambling market is becoming consolidated around wealthy firms that can sustain systemic compliance costs as a result of this tax pressure.


Online Gambling Market Opportunities

Latin American Regulatory Openings

Brazil's federal gambling law (Law 14.790/2023) officially activated licensed internet betting services in January 2025, opening a market of 215 million people [9]. Argentina and Colombia have similarly modernized frameworks, creating a regional opportunity worth an estimated USD 12 billion in annual gross gaming revenue by 2030. Early movers deploying localized digital casino platforms — Portuguese-language interfaces, Pix payment integration, local sports content — will capture disproportionate share in the Online Gambling Market's fastest-opening frontier

Convergence of Streaming Media and Wagering

Major media platforms are exploring embedded betting overlays within live sports broadcasts [10]. The merger of content consumption and wagering creates a frictionless funnel from viewer to bettor, potentially boosting conversion rates by 25–35% compared with standalone virtual gambling technology apps. Operators who secure streaming partnerships stand to reshape the Online Gambling Market's distribution model over the next five years

Crypto and Blockchain Payment Rails

Blockchain-based payment infrastructure faces a divided legal landscape, even if it eliminates chargebacks, cuts settlement times to less than 60 seconds, and permits alternative wagering in some unrestricted international countries. For example, federal regulations tightly prohibit cryptocurrency deposits in newly regulated hub markets like Brazil in order to enforce traceable electronic transactions. As a result, the requirement for international providers of iGaming software solutions has changed from pure web3 implementation to engineering compliant, localized dual-layer checkout architectures—supporting strict fiat-only electronic payment integrations for high-barrier regional frameworks while maintaining native crypto wallets for accommodating jurisdictions [8].


Data Monetization and Personalization Engines

Operators sit on vast troves of behavioral data — bet patterns, session duration, content preferences — that can fuel advanced personalization. Real-time recommendation engines powered by machine learning have boosted average revenue per user by 18% at top-tier digital casino platforms [4]. Licensing anonymized, aggregated data to media companies, sports leagues, and advertisers opens an entirely new revenue line for Online Gambling Market participants without cannibalizing core wagering income.

Expansion into Esports and Virtual Sports Betting

The global esports audience surpassed 600 million in 2024, yet esports wagering accounts for less than 3% of total internet betting services turnover [16]. This gap signals a large untapped opportunity, especially among 18–34-year-old users who favor competitive gaming over traditional sports. Operators developing proprietary virtual gambling technology for esports events can capture early-mover advantage in a sub-segment poised for 20%+ growth through the early 2030s


Online Gambling Market Future Outlook

AI-Powered Operations and Personalization (2026–2028)

Generative AI will reshape front-office and back-office operations across the Online Gambling Market within three years. Chatbot-driven customer service, dynamic odds compilation, and AI-generated promotional content will reduce operator cost-to-income ratios by an estimated 10–15 percentage points [4]. For iGaming software solutions vendors, AI-native product stacks will become table stakes, not differentiators — firms that delay adoption risk losing licensing partnerships with tier-one digital casino platform brands.

Platform Consolidation and M&A Supercycle (2028–2031)

The industry's top five operators already control an estimated 35–40% of global revenue, and that concentration will accelerate as regulatory complexity favors scale Cross-border M&A activity — Flutter's acquisition of Sisal, Entain's expansion into Brazil — foreshadows a period where internet betting services brands either achieve multi-continent reach or accept regional niche positioning. Private equity sponsors are circling mid-market virtual gambling technology firms, viewing their licensing portfolios as strategic assets.

Regulatory Convergence and Global Standards (2029–2033)

The International Association of Gaming Advisors (IAGA) and several UN-affiliated bodies have called for harmonized anti-money-laundering and responsible-gambling standards [12]. If adopted, uniform frameworks would reduce compliance costs for cross-border operators by up to 30%, expanding the addressable Online Gambling Market for mid-tier iGaming software solutions providers. Convergence would also simplify market entry for digital casino platform operators currently deterred by jurisdictional fragmentation.

Web3, Metaverse Casinos, and Immersive Betting (2032–2035)

Decentralized autonomous casinos built on blockchain protocols and VR-powered metaverse lobbies represent the Online Gambling Market's long-horizon frontier. The BloombergNEF metaverse economy is projected to exceed USD 800 billion by 2035 [20], and gambling will claim a meaningful share. Early online poker platforms' experiments in VR — multiplayer tables with avatar-based interaction — suggest engagement metrics 2–3× higher than flat-screen equivalents. Operators investing in virtual gambling technology R&D today will shape the user experience paradigm of the mid-2030s.


Online Gambling Market Segmentation

By Game Type

Segment Key Metric Primary Demand Driver
Casino 46.4% share (2025) Live-dealer streaming, slot innovation
Sports Betting 11.90% CAGR In-play micro-markets, media convergence
Lottery USD 16.54 Billion (2025) Government-backed digital ticket sales
Bingo 5.6% share (2025) Social gaming features


Casino gaming leads the Online Gambling Market in absolute revenue, powered by live-dealer studios that replicate the atmosphere of physical venues through HD and 4K streaming. Evolution Gaming's Lightning series and Pragmatic Play's Mega Wheel have become benchmark digital casino platform titles, driving average session times past 45 minutes. Sports betting, meanwhile, is the fastest-growing game type, propelled by internet betting services operators layering same-game parlays and player-prop micro-markets that attract younger demographics.

By Platform

Segment Key Metric Primary Demand Driver
Mobile / Tablet 61.1% share (2025) 5G rollout, app-first user behavior
Desktop 8.95% CAGR Multi-table online poker platforms, high-roller preference


The Online Gambling Market's mobile-first tilt reflects broader consumer behavior: over 80% of first-time depositors in 2024 registered through a smartphone [1]. Operators have responded by prioritizing native-app iGaming software solutions with biometric login, one-tap deposits, and push-notification bet prompts. Desktop retains relevance among professional virtual gambling technology users — particularly online poker platforms grinders — who require screen real estate for multi-tabling.

By Age Group

Segment Key Metric Primary Demand Driver
18–24 Years 16.8% share (2025) Esports, social-media acquisition
25–34 Years 13.50% CAGR Income growth, digital-native behavior
35–44 Years 27.8% share (2025) The highest disposable income bracket
45–54 Years USD 16.89 Billion (2025) Loyalty to established brands
55+ Years 8.5% share (2025) Lottery and bingo preferences


Users aged 25–34 represent the Online Gambling Market's highest-growth cohort, drawn by mobile-native internet betting services and gamified loyalty programs. The 35–44 age group, while growing at a more moderate pace, delivers the largest per-capita spend and highest lifetime value — making them the prime target for digital casino platforms operators running VIP retention campaigns.

By Betting Type

Segment Key Metric Primary Demand Driver
Pre-Match / Fixed-Odds 52.4% share (2025) Traditional wagering formats, accumulators
Live / In-Play 12.80% CAGR Real-time data feeds, virtual gambling technology


Pre-match wagering still commands a majority of the Online Gambling Market's sports-betting turnover, driven by accumulator bets and weekly fixtures. Live/in-play betting, however, is closing the gap rapidly, supported by sub-second latency from iGaming software solutions providers and an expanding menu of micro-markets — from next-point-scorer to corner-kick intervals — that keep bettors engaged throughout an event.


Regional Market Share Analysis

Region Key Metric (2025) Primary Investment Themes
North America 15.25% CAGR (2026–2035) State-by-state legalization, media-betting convergence
Europe 45.6% revenue share Mature regulation, responsible-gambling compliance
Asia-Pacific USD 21.20 Billion Mobile-first adoption, emerging legalization
South America 5.8% revenue share Brazil/Colombia activation, Pix payments
Middle East & Africa 3.9% revenue share Limited legal frameworks, nascent mobile wagering
Total USD 116.50 Billion

The Online Gambling Market exhibits pronounced geographic concentration, with Europe and North America together accounting for over 70% of global revenue. The table below summarizes each region's positioning within the Online Gambling Market as of 2025.


North America

Country Key Metric Key Driver
United States 82.3% of regional share Post-PASPA state legalization
Canada 12.75% CAGR Single-event betting legalization (C-218)
Mexico USD 1.15 Billion Growing adoption of digital casino platforms


The United States alone generated over USD 25.40 billion in online gambling revenue in 2025, driven by the cascading activation of state-regulated internet betting services markets. Canada's single-event sports betting law (Bill C-218), enacted in 2021, unlocked provincial iGaming software solutions partnerships, with Ontario emerging as the flagship regulated province. Mexico remains early-stage, but rising smartphone penetration and a young demographic profile make it a compelling medium-term opportunity for the Online Gambling Market.

Europe

Country Key Metric Key Driver
United Kingdom 28.4% of regional share Established licensing & White Paper reforms
Germany 10.65% CAGR Interstate Treaty implementation
France USD 4.85 Billion High-tax but stable regulatory framework
Italy 14.2% of regional share Strong sports-betting culture
Spain 9.80% CAGR Advertising regulation modernization
Nordic Countries USD 5.10 Billion State-monopoly to license transitions
Russia 3.1% of regional share Restricted but growing legal zone
Rest of Europe 11.5% of regional share Malta, Gibraltar, Isle of Man licensing hubs


The UK's Gambling Act White Paper (2023) introduced stricter affordability checks and a statutory levy on operators, reshaping the compliance landscape for virtual gambling technology providers [7]. Germany's Interstate Treaty, meanwhile, standardized licensing for online poker platforms and slot games across all 16 Länder, albeit with restrictive deposit caps that continue to push some players toward unlicensed offshore sites. Across the continent, the Online Gambling Market benefits from high broadband penetration and culturally embedded sports-betting traditions.

Asia-Pacific

Country Key Metric Key Driver
China USD 3.80 Billion State lottery (legal) and offshore flows
India 16.30% CAGR Fantasy sports, mobile-first internet betting services
Japan USD 2.95 Billion Pachinko digitization and sports wagering pilots
South Korea 8.75% CAGR Legalized sports toto and horse racing online
ASEAN USD 3.10 Billion Philippines PAGCOR licensing hub
Rest of Asia-Pacific 7.2% of regional share Varied regulation


India's Supreme Court distinction between games of skill and chance has fueled a fantasy-sports boom, with platforms attracting over 200 million registered users by 2024 [17]. The Philippines, regulated through PAGCOR, remains Southeast Asia's primary licensing hub for digital casino platforms, hosting operators that serve customers across the ASEAN region. Japan's cautious approach — limited to public sports and horse-racing wagering — may loosen as integrated resort (IR) developments in Osaka catalyze broader acceptance of iGaming software solutions in the Online Gambling Market.

South America

Country Key Metric Key Driver
Brazil 68.5% of regional share Law 14.790 federal licensing
Argentina 10.90% CAGR Provincial licensing frameworks
Rest of South America USD 1.25 Billion Colombia and Chile are emerging


Brazil's activation of federal iGaming licenses in January 2025 instantly created the region's largest regulated Online Gambling Market, with 14 operators approved in the first licensing round. Argentine provinces like Buenos Aires and Mendoza have issued local internet betting services permits, drawing international operators seeking LatAm exposure. Colombia's Coljuegos regulatory body has been operational since 2017 and serves as a mature comparator, having collected over COP 2 trillion in tax revenue from virtual gambling technology operators since its inception.

Middle East & Africa

Country Key Metric Key Driver
South Africa 42.8% of regional share National Gambling Amendment Bill
UAE 7.65% CAGR Tourism-linked digital entertainment pilots
Saudi Arabia USD 0.28 Billion Limited legal, gray-market activity
Egypt 6.80% CAGR Growing mobile user base
Rest of MEA 31.4% of regional share Kenya, Nigeria, mobile money wagering


South Africa's proposed National Gambling Amendment Bill, tabled in 2024, aims to bring online poker platforms and digital casino platforms under a unified national licensing regime [18]. In East Africa, Kenya and Nigeria have emerged as mobile-money-driven wagering hotspots — over 25% of Kenyan smartphone users have placed a bet via mobile [19]. The broader Middle East remains constrained by cultural and legal prohibitions, though the UAE's recent exploration of tourism-linked entertainment licenses could signal an incremental opening for the Online Gambling Market.


Online Gambling Market By Region, 2025-2035

Competitive Benchmarking

The Online Gambling Market exhibits medium concentration, with the top five operators accounting for an estimated 35–40% of global revenue. The Herfindahl-Hirschman Index (HHI) sits in the 800–1,200 range, indicating a moderately competitive structure where scale advantages coexist with regional specialists and niche digital casino platform brands. M&A activity has intensified since 2022, and further consolidation is expected as regulatory compliance costs favor larger internet betting services groups.

Company Est. Revenue Share Range Key Offerings Strategic Positioning
Flutter Entertainment ~9–12% FanDuel, Paddy Power, Betfair, PokerStars Global multi-brand portfolio, U.S. market leader
DraftKings ~5–8% DraftKings Sportsbook, iGaming suite U.S.-centric, technology-first operator
Bet365 ~6–9% Sports betting, live streaming, and online casino Largest single-brand private operator globally
Entain ~5–7% Ladbrokes, bwin, partypoker European stronghold, LatAm expansion
Evolution Gaming Group ~4–6% Live casino studios, game shows B2B iGaming software solutions leader
888 Holdings ~2–4% 888casino, 888sport, SI Sportsbook Mid-market multi-product operator
Kindred Group ~2–4% Unibet, 32Red Nordic and European focus
Caesars Entertainment ~3–5% Caesars Sportsbook, WSOP.com Land-based/digital convergence
MGM Resorts International ~3–5% BetMGM (JV with Entain) Resort-integrated online poker platforms
Betsson AB ~1–3% Betsson, Betsafe Nordic heritage, LatAm growth play


Recent News & Developments


  • DraftKings (January 2025): Launched a proprietary AI-powered odds engine, reducing latency on live/in-play internet betting services by 40% and improving margin management across 12 U.S. states [22].
  • UK Gambling Commission (September 2024): Published final guidance on affordability checks mandated by the Gambling Act White Paper, imposing enhanced due diligence thresholds for virtual gambling technology operators [7].


  • Evolution Gaming Group (June 2024): Opened a new USD 150 Million live-dealer studio in New Jersey, doubling its North American iGaming software solutions production capacity [23].
  • Entain (November 2024): Signed a strategic partnership with Globo (Brazil) to integrate live sports streaming with real-time wagering within the Online Gambling Market's newest major jurisdiction [10].
  • Caesars Entertainment (August 2024): Expanded its digital sportsbook into five additional U.S. states, leveraging its land-based loyalty database to cross-sell online poker platforms and casino products [24].
  • MGM Resorts International (April 2023): Increased its stake in BetMGM to 50%, signaling a deeper commitment to digital casino platforms as part of its long-term Online Gambling Market strategy [25].


Online Gambling Market Report Scope

Parameter Detail
Market Scope Global Online Gambling Market covering sports betting, casino, lottery, and bingo across digital casino platforms
Study Period 2021–2035
CAGR 10.85% (2026–2035)
Market Size (2025) USD 116.50 Billion
Market Size (2035) USD 326.27 Billion
Fastest Growing Segments Sports Betting (by game type); Mobile/Tablet (by platform); North America (by region)
Companies Profiled Flutter Entertainment, DraftKings, Bet365, Entain, Evolution Gaming Group, 888 Holdings, Kindred Group, Caesars Entertainment, MGM Resorts International, Betsson AB
Valuation Currency USD Billion


FAQs

How do deposit limits affect operator profitability in the Online Gambling Market?

Deposit caps compress per-user revenue but reduce churn by 12–18%, improving lifetime value. Operators that optimize retention around caps often recover lost top-line revenue within 18 months [7].

Which payment methods are gaining traction in digital casino platforms?

E-wallets and crypto wallets now process over 35% of deposits globally. Apple Pay and Google Pay adoption among internet betting services users doubled between 2022 and 2024 [8].

How does the Online Gambling Market address geo-fencing compliance?

Operators deploy GPS and IP-based verification stacks to restrict access by jurisdiction. Non-compliance penalties can reach USD 5 Million per incident in the U.S. [2].

What role do affiliate marketers play in iGaming software solutions distribution?

Affiliates drive 30–40% of new depositing customers for mid-tier brands. Revenue-share agreements typically range from 25% to 45% of net gaming revenue per referred player [4].

How is the Online Gambling Market adapting to emerging responsible-gaming mandates?

AI-based session-monitoring tools now flag at-risk behavior in under 10 seconds. Operators embedding these virtual gambling technology systems report 20% fewer regulatory sanctions annually [7].

What technical infrastructure do new entrants in the Online Gambling Market need?

A market-ready stack requires a gaming license, platform aggregator, payment gateway, and KYC provider. Minimum launch costs for internet betting services range from USD 2 million to USD 5 million [11].

How do odds-feed latency differences impact live betting on online poker platforms and sportsbooks?

Sub-200-millisecond feeds enable real-time micro-market pricing, boosting in-play turnover by 25–35%. Operators using slower feeds lose margin to arbitrage bettors [6].    
Author
Author
Author Profile
Apoorva Priyadarshi LinkedIn
Research Analyst
With 4+ years of experience in Market Intelligence and Strategic Research, Apoorv specializes in ICT, Semiconductor, and BFSI markets. Combining strong analytical capabilities with a deep understanding of technology-driven industries, he focuses on delivering data-driven insights that support strategic decision-making. With a background in technology and business research, Apoorv has contributed to numerous global market studies, competitive landscape analyses, and opportunity assessments across sectors such as semiconductors, digital banking, cybersecurity, and telecommunications.
Co-Author
Co-Author Profile
Aarti Dhapte LinkedIn
AVP - Research
A consulting professional focused on helping businesses navigate complex markets through structured research and strategic insights. I partner with clients to solve high-impact business problems across market entry strategy, competitive intelligence, and opportunity assessment. Over the course of my experience, I have led and contributed to 100+ market research and consulting engagements, delivering insights across multiple industries and geographies, and supporting strategic decisions linked to $500M+ market opportunities. My core expertise lies in building robust market sizing, forecasting, and commercial models (top-down and bottom-up), alongside deep-dive competitive and industry analysis. I have played a key role in shaping go-to-market strategies, investment cases, and growth roadmaps, enabling clients to make confident, data-backed decisions in dynamic markets.

Research Approach


Secondary Research

The secondary research process involved comprehensive analysis of regulatory databases, industry publications, gaming commission reports, and authoritative gambling research organizations. Key sources included the UK Gambling Commission (UKGC), Malta Gaming Authority (MGA), Gibraltar Gambling Commissioner, Nevada Gaming Control Board, New Jersey Division of Gaming Enforcement, European Gaming and Betting Association (EGBA), American Gaming Association (AGA), International Association of Gaming Regulators (IAGR), National Council on Problem Gambling (NCPG), Gambling Commission Statistics (UK), Statista Gambling & Gaming Database, H2 Gambling Capital, Gaming Intelligence Group, European Commission Digital Economy Reports, Financial Action Task Force (FATF) – Virtual Assets & Gambling, World Regulatory Briefing (WRB), and national gaming authority reports from key regulated markets (Germany's GGL, France's ANJ, Spain's DGOJ, Italy's ADM).

The following sources were employed to gather market capitalization data, licensing statistics, regulatory compliance frameworks, player behavior analytics, taxation revenue data, and competitive landscape analysis for the sports betting, online casino, poker, bingo, and emerging gaming verticals.


Primary Research

Qualitative and quantitative insights were obtained by interviewing supply-side and demand-side stakeholders during the primary research process. CEOs, Chief Product Officers, leaders of regulatory compliance, and commercial directors from online gambling operators, platform technology providers, and payment solution vendors comprised the supply-side sources. The demand-side sources included professional bettors, casino players, affiliate marketing managers, responsible gambling officers, and procurement leaders from sportsbook partnerships, media companies, and advertising agencies. The primary research validated market segmentation, affirmed platform development roadmaps, and collected insights on user acquisition strategies, retention mechanics, cryptocurrency adoption patterns, and regional regulatory navigation.

Primary Respondent Breakdown:

Category Segmentation Percentage:

By Company Tier Tier 1 (>$5B revenue) 38%,

Tier 2 ($500M-$5B) 31%,

By Designation C-level Primaries (29%).

Director Level (33%),

Others (Managers, Specialists) (38%)

By Region: North America (29%),

Europe (34%,

Asia-Pacific 26%,

Rest of World (LatAm, MEA) 11%


Market Size Estimation

Global market valuation was derived through revenue mapping and wagering volume analysis. The methodology included:

Identification of 50+ key operators across North America, Europe, Asia-Pacific, Latin America, and Emerging Markets

Product mapping across sports betting (football, basketball, horse racing, esports), online casino (slots, table games, live dealer), poker, bingo, and emerging verticals (daily fantasy sports, virtual sports, crash games)

Analysis of reported and modeled annual revenues specific to online gambling verticals, including Gross Gaming Revenue (GGR) and Net Gaming Revenue (NGR) metrics

Coverage of operators and platform providers representing **

Download Free Sample

Kindly complete the form below to receive a free sample of this Report

Download PDF ×

We do not share your information with anyone. However, we may send you emails based on your report interest from time to time. You may contact us at any time to opt-out.