×
  • Cat-intel
  • MedIntelliX
  • Resources
  • About Us
  • Hero Background
    English
    Chinese
    French
    Japanese
    Korean
    German
    Spanish

    Online Gambling Market Analysis

    ID: MRFR/ICT/7169-HCR
    200 Pages
    Aarti Dhapte
    October 2025

    Online Gambling Market Research Report: By Game Type (Casino Games, Sports Betting, Poker, Bingo, Esports Betting), By Device Type (Desktop, Mobile, Tablet), By Payment Method (Credit/Debit Cards, E-Wallets, Bank Transfers, Cryptocurrency), By User Type (Casual Players, Professional Players, High Rollers) and By Regional (North America, Europe, South America, Asia Pacific, Middle East and Afric...

    Share:
    Download PDF ×

    We do not share your information with anyone. However, we may send you emails based on your report interest from time to time. You may contact us at any time to opt-out.

    Online Gambling Market Infographic
    Purchase Options

    Market Analysis

    In-depth Analysis of Online Gambling Market Industry Landscape

    In the past few years, online gambling has boomed greatly. This is because of many changes in markets and businesses that have made things very different. The rise in digital tools like smartphones and fast internet is a key reason for the rise. These improvements have made it easier for people to join online betting websites. This has resulted in a big increase of users taking part. Another aspect that makes the internet gaming field grow is its very tough competition. The many businesses competing for the top spot in a market always pushes them to come up with new and exciting services. The strong competition in the internet gambling world has created a big collection of modern online betting items. These go from regular casino games to high-tech sports making bets systems. Also, growing patterns in the fun and relaxation sectors are directly connected to how online gambling works. When you mix online gambling with other fun things like games and live sport on the internet, it creates special effects that many people can enjoy. The joining of these fun choices helps the online betting business to grow and last longer. Consumers’ likes and actions have a big impact on how the online gambling business works. More people are starting to see online betting and gambling as normal ways of having fun. This is changing how customers think about them. Also, features in the market have been greatly changed by technology stuff like artificial intelligence and data analysis. Online betting websites use these tech tools to improve the user experience, make products better and carry out good marketing plans. By using computer programs to watch what players like and how they act, companies can change their deals and rewards. This makes customers happier with the games while also keeping them coming back more often.

    Author
    Aarti Dhapte
    Team Lead - Research

    She holds an experience of about 6+ years in Market Research and Business Consulting, working under the spectrum of Information Communication Technology, Telecommunications and Semiconductor domains. Aarti conceptualizes and implements a scalable business strategy and provides strategic leadership to the clients. Her expertise lies in market estimation, competitive intelligence, pipeline analysis, customer assessment, etc.

    Leave a Comment

    FAQs

    What is the expected market size of the Online Gambling Market in 2024?

    The Online Gambling Market is anticipated to be valued at 74.44 USD billion in 2024.

    What is the projected market size of the Online Gambling Market by 2035?

    By 2035, the Online Gambling Market is expected to reach a valuation of 152.7 USD Billion.

    What is the compound annual growth rate (CAGR) for the Online Gambling Market from 2025 to 2035?

    The Online Gambling Market is expected to grow at a CAGR of 6.75% between 2025 and 2035.

    Which segment is expected to have the highest market value in the Online Gambling Market in 2024?

    In 2024, the Sports Betting segment is expected to have the highest market value at 30.0 USD billion.

    What is the estimated market size of the Casino Games segment in 2035?

    The Casino Games segment is projected to reach a market size of 56.1 USD billion by 2035.

    Which region is expected to dominate the Online Gambling Market in 2024?

    North America is expected to dominate the Online Gambling Market with a value of 28.0 USD Billion in 2024.

    What is the anticipated market size for the Asia Pacific region in 2035?

    The Asia Pacific region is expected to reach a market size of 20.0 USD billion by 2035.

    Who are the key players in the Online Gambling Market?

    Major players in the Online Gambling Market include DraftKings, MGM Resorts, and PokerStars, among others.

    What is the market size for the Poker segment in the year 2024?

    The Poker segment is valued at 8.5 USD Billion in the Online Gambling Market for the year 2024.

    What is the expected growth rate for Sports Betting in the Online Gambling Market from 2025 to 2035?

    The Sports Betting segment is anticipated to grow significantly, contributing to the overall CAGR of 6.75% from 2025 to 2035.

    Market Summary

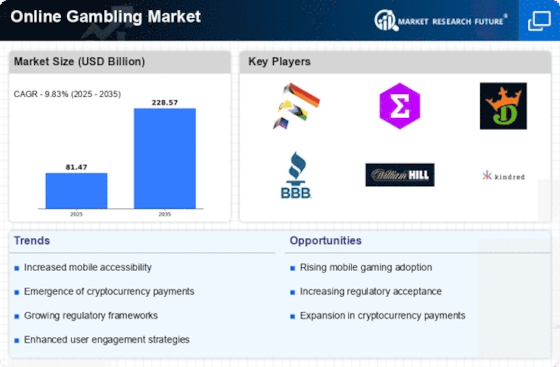
    As per MRFR analysis, the Online Gambling Market Size was estimated at 81.47 USD Billion in 2024. The Online Gambling industry is projected to grow from 89.48 USD Billion in 2025 to 228.57 USD Billion by 2035, exhibiting a compound annual growth rate (CAGR) of 9.83 during the forecast period 2025 - 2035.

    Key Market Trends & Highlights

    The Online Gambling Market is experiencing robust growth driven by technological advancements and changing consumer preferences.

    • Mobile gaming continues to dominate the Online Gambling Market, particularly in North America, where user engagement is exceptionally high.
    • Casino games remain the largest segment, while esports betting is rapidly gaining traction, especially in the Asia-Pacific region.
    • The integration of cryptocurrency is reshaping payment methods, appealing to a tech-savvy demographic across various markets.
    • Regulatory changes and increased consumer demand are key drivers propelling the growth of online gambling, particularly in emerging markets.

    Market Size & Forecast

    2024 Market Size 81.47 (USD Billion)
    2035 Market Size 228.57 (USD Billion)
    CAGR (2025 - 2035) 9.83%
    Largest Regional Market Share in 2024 North America

    Major Players

    <p>Flutter Entertainment (GB), Entain (GB), DraftKings (US), Bet365 (GB), William Hill (GB), Kindred Group (SE), 888 Holdings (GB), Caesars Entertainment (US), MGM Resorts International (US)</p>

    Market Trends

    The Online Gambling Market is currently experiencing a dynamic evolution, driven by technological advancements and shifting consumer preferences. The proliferation of mobile devices has transformed how individuals engage with gambling platforms, allowing for greater accessibility and convenience. This trend appears to be fostering a more diverse user base, as younger demographics increasingly participate in online betting activities. Furthermore, the integration of innovative payment solutions, such as cryptocurrencies, is reshaping financial transactions within this sector, potentially enhancing user experience and security. Regulatory frameworks are also adapting, with various jurisdictions exploring the legalization of online gambling, which may further stimulate market growth. In addition to technological influences, social factors are playing a crucial role in shaping the Online Gambling Market. The rise of social gaming and gamification elements within gambling platforms suggests a shift towards more interactive and engaging experiences. This trend may attract individuals who previously viewed gambling as a solitary activity, fostering a sense of community among players. As the market continues to evolve, it is essential to monitor these trends closely, as they could significantly impact the future landscape of online gambling, influencing both operators and consumers alike.

    Mobile Gaming Dominance

    The prevalence of mobile devices is reshaping the Online Gambling Market, as more users opt for gambling on smartphones and tablets. This shift is likely to enhance user engagement and accessibility, allowing players to gamble anytime and anywhere.

    Cryptocurrency Integration

    The adoption of cryptocurrencies as a payment method is gaining traction within the Online Gambling Market. This trend may provide users with enhanced security and anonymity, potentially attracting a broader audience to online platforms.

    Social Gaming Trends

    The incorporation of social elements into online gambling experiences is becoming increasingly popular. This trend suggests a movement towards community-oriented gaming, where players can interact and compete with one another, enhancing overall engagement.

    Online Gambling Market Market Drivers

    Emerging Markets

    Emerging markets are presenting new opportunities for the Online Gambling Market. Regions that have historically been underserved are now beginning to embrace online gambling, driven by increasing internet penetration and smartphone adoption. In 2025, countries in Asia and Latin America are showing promising growth potential, with regulatory frameworks gradually being established to support online gambling activities. This expansion into new markets not only diversifies the customer base but also enhances revenue streams for operators. As these markets develop, the Online Gambling Market is likely to see a surge in investment, innovation, and competition, ultimately benefiting consumers with a wider array of gaming options.

    Regulatory Changes

    The Online Gambling Market is experiencing a wave of regulatory changes that appear to be reshaping its landscape. Governments are increasingly recognizing the potential tax revenue from legalized online gambling, leading to the establishment of clearer frameworks. For instance, in 2025, several jurisdictions have enacted laws that facilitate online betting, which could potentially increase market participation. This regulatory clarity not only enhances consumer confidence but also encourages operators to invest in compliant platforms. As a result, the Online Gambling Market is likely to see a surge in new entrants, fostering competition and innovation. Furthermore, the harmonization of regulations across regions may simplify operations for international operators, thereby expanding their reach and customer base.

    Increased Consumer Demand

    The Online Gambling Market is witnessing a notable increase in consumer demand, driven by changing entertainment preferences. As more individuals seek convenient and engaging forms of entertainment, online gambling platforms are becoming increasingly popular. Data from 2025 indicates that the number of active online gamblers has surged, with estimates suggesting a growth rate of approximately 10% annually. This trend is particularly evident among younger demographics, who favor the accessibility and variety offered by online platforms. Furthermore, the rise of social media and influencer marketing is amplifying awareness and interest in online gambling. As consumer demand continues to rise, the Online Gambling Market is likely to expand, prompting operators to diversify their offerings and enhance user engagement strategies.

    Technological Advancements

    Technological advancements are driving the Online Gambling Market towards unprecedented growth. Innovations in software development, particularly in artificial intelligence and machine learning, are enhancing user experiences by personalizing gaming options and improving customer service. In 2025, the integration of virtual reality (VR) and augmented reality (AR) technologies is becoming more prevalent, offering immersive gaming experiences that attract a broader audience. Additionally, the rise of high-speed internet and mobile connectivity facilitates seamless access to online gambling platforms. This technological evolution not only enhances engagement but also increases the potential for revenue generation. As operators adopt these technologies, the Online Gambling Market is likely to witness a transformation in how games are developed and delivered, appealing to both traditional and new players.

    Payment Method Diversification

    The diversification of payment methods is significantly impacting the Online Gambling Market. As consumers become more tech-savvy, they increasingly prefer a variety of payment options that cater to their preferences. In 2025, the acceptance of cryptocurrencies and e-wallets is becoming more widespread, providing users with secure and efficient transaction methods. This shift not only enhances user convenience but also attracts a broader audience, including those who may have previously been hesitant to engage in online gambling. Moreover, the integration of traditional payment methods alongside modern solutions ensures that operators can cater to diverse customer needs. As payment options continue to evolve, the Online Gambling Market is likely to experience increased participation and revenue growth.

    Market Segment Insights

    Online Gambling Market Segment Insights

    <p>Online Gambling Market Segment Insights</p>

    Online Gambling Market Game Type Insights

    <p>Online Gambling Market Game Type Insights</p>

    <p>The Online Gambling Market is witnessing significant trends reflecting the diverse Game Type segment, which includes Casino Games, Sports Betting, Poker, Bingo, and <a href="https://www.marketresearchfuture.com/reports/esports-betting-market-20676">Esports Betting</a>. By 2024, the Casino Games sector is projected to hold a substantial market value of 27.0 USD billion, which will rise to 56.1 USD billion by 2035.</p>

    <p>This growth illustrates that Casino Games are a major driver of engagement within the industry, as they cater to a broad audience and are fundamentally integrated into the online gambling experience, thus ensuring a majority holding in overall market dynamics.Sports Betting is not far behind, with expected valuations of 30.0 USD billion in 2024, escalating to 62.0 USD billion in 2035; the increasing popularity of sports events globally and the growing acceptance of online outlets have fueled this popularity, making it a significant contributor to the Online Gambling Market revenue.</p>

    Online Gambling Market Device Type Insights

    <p>Online Gambling Market Device Type Insights</p>

    <p>The Online Gambling Market, valued at 74.44 USD Billion in 2024, showcases diverse consumer preferences across its Device Type segmentation, highlighting the growing importance of technology in gambling activities. The sector is increasingly leaning towards mobile devices, which have become a significant avenue for users due to their accessibility and convenience, allowing players to gamble on the go. Desktop and tablet gaming also maintains a substantial presence, as they provide users with richer graphics and immersive experiences.</p>

    <p>The rapid growth in mobile gambling applications is driving the expansion of the Online Gambling Market revenue, reflecting a notable shift in user behavior.Factors such as increased smartphone penetration and advancements in mobile technology are key growth drivers, despite challenges like regulatory pressures and security concerns. Rising opportunities exist in enhancing user engagement through advanced applications and interactive platforms, and these advancements are pivotal for stakeholders in the Online Gambling Market industry. Comprehensive Online Gambling Market statistics reveal that device preferences will likely continue to evolve, with mobile devices dominating market share as players seek seamless and flexible gaming experiences.</p>

    Online Gambling Market Payment Method Insights

    <p>Online Gambling Market Payment Method Insights</p>

    <p>The Online Gambling Market, projected to be valued at 74.44 USD billion in 2024, has evolved significantly in terms of payment methods utilized by consumers. Payment methods such as Credit/Debit Cards, <a href="https://www.marketresearchfuture.com/reports/e-wallet-market-4633">E-Wallets</a>, Bank Transfers, and Cryptocurrency play crucial roles in enhancing user experience and convenience. Credit and debit cards remain popular due to their ease of use, while E-Wallets have gained traction for their speed and security, allowing for rapid transactions.</p>

    <p>Bank transfers are recognized for their security, appealing to players who prioritize trustworthiness, and Cryptocurrency has emerged as a trendy alternative, providing anonymity and lower transaction fees.These payment preferences are influenced by factors such as technological advancements, growing internet penetration, and a surge in mobile device usage globally. The majority of online gamblers increasingly lean towards flexible and secure payment options, driving a shift towards digital wallets and Cryptocurrency adoption. The ongoing trend indicates the importance of having diverse payment options, as this can significantly enhance player retention and satisfaction in the competitive online gambling landscape.</p>

    Online Gambling Market User Type Insights

    <p>Online Gambling Market User Type Insights</p>

    <p>The Online Gambling Market is evolving rapidly, particularly within the User Type segment that comprises different categories such as Casual Players, Professional Players, and High Rollers. In 2024, the Online Gambling Market revenue is projected to reach 74.44 USD billion, marking a significant increase in participation across various user types. Casual Players typically represent the largest demographic, engaging casually in online gambling activities primarily for entertainment, contributing to the market's accessibility and widespread appeal.&nbsp;</p>

    <p>Professional Players, on the other hand, bring a level of expertise and strategic approach that often leads to higher stakes and more intense competition, driving growth in the market through advanced platforms and higher-quality offerings. High Rollers, known for their significant financial commitment, play a crucial role as they contribute a substantial share of the revenue, highlighting the necessity for online gambling platforms to cater to their specific needs with luxurious features and exclusive benefits.&nbsp;</p>

    Get more detailed insights about Online Gambling Market Research Report - Global Forecast to 2035

    Regional Insights

    North America : Leading Market for Online Gambling

    North America is the largest market for online gambling, accounting for approximately 45% of the global market share. The growth is driven by increasing legalization across various states, technological advancements, and a surge in mobile betting. Regulatory frameworks are evolving, with states like New Jersey and Pennsylvania leading the charge in establishing robust online gambling laws. This trend is expected to continue, further boosting market growth. The competitive landscape in North America is characterized by major players such as DraftKings, Caesars Entertainment, and MGM Resorts International. These companies are leveraging innovative technologies and marketing strategies to capture market share. The presence of established brands and a growing consumer base are key factors contributing to the region's dominance. As more states consider legalization, the market is poised for significant expansion.

    Europe : Regulatory Frameworks Evolving

    Europe is a significant player in the online gambling market, holding approximately 30% of the global share. The region's growth is fueled by a mix of established markets like the UK and emerging ones such as Sweden and the Netherlands. Regulatory changes, including the introduction of stricter advertising guidelines and responsible gambling measures, are shaping the landscape. Countries are increasingly focusing on consumer protection and fair play, which is expected to enhance market stability. Leading countries in Europe include the UK, Germany, and Sweden, with key players like Bet365, Flutter Entertainment, and Kindred Group dominating the scene. The competitive environment is marked by innovation and a focus on user experience, with companies investing heavily in technology to enhance their offerings. As regulations evolve, operators are adapting their strategies to maintain compliance while maximizing growth opportunities.

    Asia-Pacific : Emerging Market with High Potential

    The Asia-Pacific region is emerging as a powerhouse in the online gambling market, currently holding about 20% of the global share. The growth is driven by increasing internet penetration, mobile device usage, and a young population eager for online entertainment. Countries like Australia and Japan are leading the charge, with regulatory frameworks gradually evolving to accommodate online gambling. The region's potential is immense, with many markets still in the early stages of development. Key players in the Asia-Pacific market include local operators and international brands looking to expand their footprint. Australia is a significant market, with companies like Sportsbet and Ladbrokes leading the way. The competitive landscape is characterized by a mix of traditional and online gambling, with operators focusing on innovative solutions to attract a tech-savvy audience. As regulations become more favorable, the market is expected to witness substantial growth.

    Middle East and Africa : Untapped Potential in Gambling

    The Middle East and Africa region is currently the smallest market for online gambling, holding approximately 5% of the global share. However, the potential for growth is significant, driven by increasing internet access and changing attitudes towards gambling. Countries like South Africa are leading the way, with regulatory frameworks slowly evolving to allow for online gambling. The region's unique cultural landscape presents both challenges and opportunities for market expansion. In Africa, South Africa is the primary market, with local operators gaining traction. The competitive landscape is still developing, with many international players eyeing opportunities in the region. As regulations become more favorable and consumer interest grows, the market is expected to expand. The presence of key players is limited, but as the market matures, more companies are likely to enter, enhancing competition and innovation.

    Key Players and Competitive Insights

    The Online Gambling Market has experienced significant transformation over the past few years, driven by advancements in technology, regulatory changes, and shifting consumer preferences. This competitive landscape is characterized by a myriad of players ranging from established gambling operators to innovative tech startups. The rising acceptance of online platforms among consumers, bolstered by the proliferation of mobile devices, has led to a robust market expansion. Companies compete on various fronts, including product diversity, quality of user experience, promotional strategies, and, importantly, compliance with an increasingly complex regulatory environment across different jurisdictions.

    As such, competitive insights into this market reveal not only the strengths and weaknesses of individual players but also the collective trends that shape the future of online gambling on a global scale.DraftKings has emerged as a formidable presence within the Online Gambling Market, primarily due to its innovative approach to sportsbook offerings and fantasy sports. The company's strengths lie in its robust technology platform, user-friendly interface, and comprehensive range of betting options, which cater to a diverse audience.

    DraftKings' strategic partnerships and marketing efforts have significantly enhanced brand visibility and customer acquisition, allowing it to capture a substantial market share and build a loyal customer base. Furthermore, the company's emphasis on customer engagement through promotional incentives and loyalty programs has reinforced its competitive positioning, making it a major player in the global landscape of online gambling.MGM Resorts is another key competitor in the Online Gambling Market, known for its extensive portfolio of products and services that include integrated resort experiences, real-money gaming, and entertainment offerings.

    The company's well-established reputation and brand equity lend it a competitive advantage, while its strategic initiatives in mergers and acquisitions have allowed it to deepen its market presence on a global scale. MGM Resorts has made significant investments in its online platforms, enhancing its ability to offer seamless gaming experiences across various channels. The strength of MGM Resorts lies in its ability to combine traditional casino experiences with online offerings, thereby catering to a wider demographic.

    Furthermore, the company's data-driven approach to understanding consumer behavior ensures that its marketing strategies and service improvements remain relevant and effective in a highly dynamic market.

    Key Companies in the Online Gambling Market market include

    Industry Developments

    The Online Gambling Market is still changing thanks to more users, record-breaking revenues, and important regulatory steps. In September 2023, iGaming in Pennsylvania brought in a record $159.5 million in one month, bringing the total amount of gambling to $476.3 million, which is 6.2% more than in 2022. On November 3, 2023, DraftKings and Caesars opened mobile sportsbooks in Maine. They worked with Native American tribes to enter the 25th U.S. sports betting market. The larger U.S. gambling market, on the other hand, reached new highs in 2023, bringing in $66.5 billion in total revenue.

    This was a 46.1% rise in sports betting and $6.17 billion in online gaming, with new states driving growth.Entain made a strategic move by buying Angstrom Sports, a company that analyzes data. The deal was announced in July 2023 and finished in October 2023. In August 2023, the William Hill Nevada sportsbook app also moved to and upgraded to Caesars' own Liberty platform. Flutter Entertainment and Bet365's valuations probably went up because of good regulations, but we don't have any specific numbers to back this up.

    These changes all point to how the online gambling industry is always changing and growing.

    Future Outlook

    Online Gambling Market Future Outlook

    <p>The Online Gambling Market is projected to grow at a 9.83% CAGR from 2024 to 2035, driven by technological advancements, regulatory changes, and increasing consumer engagement.</p>

    New opportunities lie in:

    • <p>Integration of AI-driven personalized gaming experiences</p>
    • <p>Expansion of mobile gaming platforms targeting emerging markets</p>
    • <p>Development of blockchain-based payment solutions for enhanced security</p>

    <p>By 2035, the Online Gambling Market is expected to achieve substantial growth and innovation.</p>

    Market Segmentation

    Online Gambling Market Regional Outlook

    • North America
    • Europe
    • South America
    • Asia Pacific
    • Middle East and Africa

    Online Gambling Market Game Type Outlook

    • Casino Games
    • Sports Betting
    • Poker
    • Bingo
    • Esports Betting

    Online Gambling Market User Type Outlook

    • Casual Players
    • Professional Players
    • High Rollers

    Online Gambling Market Device Type Outlook

    • Desktop
    • Mobile
    • Tablet

    Online Gambling Market Payment Method Outlook

    • Credit/Debit Cards
    • E-Wallets
    • Bank Transfers
    • Cryptocurrency

    Report Scope

    MARKET SIZE 202481.47(USD Billion)
    MARKET SIZE 202589.48(USD Billion)
    MARKET SIZE 2035228.57(USD Billion)
    COMPOUND ANNUAL GROWTH RATE (CAGR)9.83% (2024 - 2035)
    REPORT COVERAGERevenue Forecast, Competitive Landscape, Growth Factors, and Trends
    BASE YEAR2024
    Market Forecast Period2025 - 2035
    Historical Data2019 - 2024
    Market Forecast UnitsUSD Billion
    Key Companies ProfiledMarket analysis in progress
    Segments CoveredMarket segmentation analysis in progress
    Key Market OpportunitiesIntegration of blockchain technology enhances transparency and security in the Online Gambling Market.
    Key Market DynamicsRegulatory changes and technological advancements are reshaping competitive dynamics in the online gambling market.
    Countries CoveredNorth America, Europe, APAC, South America, MEA

    FAQs

    What is the expected market size of the Online Gambling Market in 2024?

    The Online Gambling Market is anticipated to be valued at 74.44 USD billion in 2024.

    What is the projected market size of the Online Gambling Market by 2035?

    By 2035, the Online Gambling Market is expected to reach a valuation of 152.7 USD Billion.

    What is the compound annual growth rate (CAGR) for the Online Gambling Market from 2025 to 2035?

    The Online Gambling Market is expected to grow at a CAGR of 6.75% between 2025 and 2035.

    Which segment is expected to have the highest market value in the Online Gambling Market in 2024?

    In 2024, the Sports Betting segment is expected to have the highest market value at 30.0 USD billion.

    What is the estimated market size of the Casino Games segment in 2035?

    The Casino Games segment is projected to reach a market size of 56.1 USD billion by 2035.

    Which region is expected to dominate the Online Gambling Market in 2024?

    North America is expected to dominate the Online Gambling Market with a value of 28.0 USD Billion in 2024.

    What is the anticipated market size for the Asia Pacific region in 2035?

    The Asia Pacific region is expected to reach a market size of 20.0 USD billion by 2035.

    Who are the key players in the Online Gambling Market?

    Major players in the Online Gambling Market include DraftKings, MGM Resorts, and PokerStars, among others.

    What is the market size for the Poker segment in the year 2024?

    The Poker segment is valued at 8.5 USD Billion in the Online Gambling Market for the year 2024.

    What is the expected growth rate for Sports Betting in the Online Gambling Market from 2025 to 2035?

    The Sports Betting segment is anticipated to grow significantly, contributing to the overall CAGR of 6.75% from 2025 to 2035.

    1. SECTION I: EXECUTIVE SUMMARY AND KEY HIGHLIGHTS
      1. | 1.1 EXECUTIVE SUMMARY
      2. | | 1.1.1 Market Overview
      3. | | 1.1.2 Key Findings
      4. | | 1.1.3 Market Segmentation
      5. | | 1.1.4 Competitive Landscape
      6. | | 1.1.5 Challenges and Opportunities
      7. | | 1.1.6 Future Outlook
    2. SECTION II: SCOPING, METHODOLOGY AND MARKET STRUCTURE
      1. | 2.1 MARKET INTRODUCTION
      2. | | 2.1.1 Definition
      3. | | 2.1.2 Scope of the study
      4. | | | 2.1.2.1 Research Objective
      5. | | | 2.1.2.2 Assumption
      6. | | | 2.1.2.3 Limitations
      7. | 2.2 RESEARCH METHODOLOGY
      8. | | 2.2.1 Overview
      9. | | 2.2.2 Data Mining
      10. | | 2.2.3 Secondary Research
      11. | | 2.2.4 Primary Research
      12. | | | 2.2.4.1 Primary Interviews and Information Gathering Process
      13. | | | 2.2.4.2 Breakdown of Primary Respondents
      14. | | 2.2.5 Forecasting Model
      15. | | 2.2.6 Market Size Estimation
      16. | | | 2.2.6.1 Bottom-Up Approach
      17. | | | 2.2.6.2 Top-Down Approach
      18. | | 2.2.7 Data Triangulation
      19. | | 2.2.8 Validation
    3. SECTION III: QUALITATIVE ANALYSIS
      1. | 3.1 MARKET DYNAMICS
      2. | | 3.1.1 Overview
      3. | | 3.1.2 Drivers
      4. | | 3.1.3 Restraints
      5. | | 3.1.4 Opportunities
      6. | 3.2 MARKET FACTOR ANALYSIS
      7. | | 3.2.1 Value chain Analysis
      8. | | 3.2.2 Porter's Five Forces Analysis
      9. | | | 3.2.2.1 Bargaining Power of Suppliers
      10. | | | 3.2.2.2 Bargaining Power of Buyers
      11. | | | 3.2.2.3 Threat of New Entrants
      12. | | | 3.2.2.4 Threat of Substitutes
      13. | | | 3.2.2.5 Intensity of Rivalry
      14. | | 3.2.3 COVID-19 Impact Analysis
      15. | | | 3.2.3.1 Market Impact Analysis
      16. | | | 3.2.3.2 Regional Impact
      17. | | | 3.2.3.3 Opportunity and Threat Analysis
    4. SECTION IV: QUANTITATIVE ANALYSIS
      1. | 4.1 Information and Communications Technology, BY Type (USD Billion)
      2. | | 4.1.1 Casino Games
      3. | | 4.1.2 Sports Betting
      4. | | 4.1.3 Poker
      5. | | 4.1.4 Bingo
      6. | | 4.1.5 Esports Betting
      7. | 4.2 Information and Communications Technology, BY Device (USD Billion)
      8. | | 4.2.1 Desktop
      9. | | 4.2.2 Mobile
      10. | | 4.2.3 Tablet
      11. | 4.3 Information and Communications Technology, BY Payment Method (USD Billion)
      12. | | 4.3.1 Credit/Debit Cards
      13. | | 4.3.2 E-Wallets
      14. | | 4.3.3 Bank Transfers
      15. | | 4.3.4 Cryptocurrency
      16. | 4.4 Information and Communications Technology, BY User Type (USD Billion)
      17. | | 4.4.1 Casual Players
      18. | | 4.4.2 Professional Players
      19. | | 4.4.3 High Rollers
      20. | 4.5 Information and Communications Technology, BY Region (USD Billion)
      21. | | 4.5.1 North America
      22. | | | 4.5.1.1 US
      23. | | | 4.5.1.2 Canada
      24. | | 4.5.2 Europe
      25. | | | 4.5.2.1 Germany
      26. | | | 4.5.2.2 UK
      27. | | | 4.5.2.3 France
      28. | | | 4.5.2.4 Russia
      29. | | | 4.5.2.5 Italy
      30. | | | 4.5.2.6 Spain
      31. | | | 4.5.2.7 Rest of Europe
      32. | | 4.5.3 APAC
      33. | | | 4.5.3.1 China
      34. | | | 4.5.3.2 India
      35. | | | 4.5.3.3 Japan
      36. | | | 4.5.3.4 South Korea
      37. | | | 4.5.3.5 Malaysia
      38. | | | 4.5.3.6 Thailand
      39. | | | 4.5.3.7 Indonesia
      40. | | | 4.5.3.8 Rest of APAC
      41. | | 4.5.4 South America
      42. | | | 4.5.4.1 Brazil
      43. | | | 4.5.4.2 Mexico
      44. | | | 4.5.4.3 Argentina
      45. | | | 4.5.4.4 Rest of South America
      46. | | 4.5.5 MEA
      47. | | | 4.5.5.1 GCC Countries
      48. | | | 4.5.5.2 South Africa
      49. | | | 4.5.5.3 Rest of MEA
    5. SECTION V: COMPETITIVE ANALYSIS
      1. | 5.1 Competitive Landscape
      2. | | 5.1.1 Overview
      3. | | 5.1.2 Competitive Analysis
      4. | | 5.1.3 Market share Analysis
      5. | | 5.1.4 Major Growth Strategy in the Information and Communications Technology
      6. | | 5.1.5 Competitive Benchmarking
      7. | | 5.1.6 Leading Players in Terms of Number of Developments in the Information and Communications Technology
      8. | | 5.1.7 Key developments and growth strategies
      9. | | | 5.1.7.1 New Product Launch/Service Deployment
      10. | | | 5.1.7.2 Merger & Acquisitions
      11. | | | 5.1.7.3 Joint Ventures
      12. | | 5.1.8 Major Players Financial Matrix
      13. | | | 5.1.8.1 Sales and Operating Income
      14. | | | 5.1.8.2 Major Players R&D Expenditure. 2023
      15. | 5.2 Company Profiles
      16. | | 5.2.1 Flutter Entertainment (GB)
      17. | | | 5.2.1.1 Financial Overview
      18. | | | 5.2.1.2 Products Offered
      19. | | | 5.2.1.3 Key Developments
      20. | | | 5.2.1.4 SWOT Analysis
      21. | | | 5.2.1.5 Key Strategies
      22. | | 5.2.2 Entain (GB)
      23. | | | 5.2.2.1 Financial Overview
      24. | | | 5.2.2.2 Products Offered
      25. | | | 5.2.2.3 Key Developments
      26. | | | 5.2.2.4 SWOT Analysis
      27. | | | 5.2.2.5 Key Strategies
      28. | | 5.2.3 DraftKings (US)
      29. | | | 5.2.3.1 Financial Overview
      30. | | | 5.2.3.2 Products Offered
      31. | | | 5.2.3.3 Key Developments
      32. | | | 5.2.3.4 SWOT Analysis
      33. | | | 5.2.3.5 Key Strategies
      34. | | 5.2.4 Bet365 (GB)
      35. | | | 5.2.4.1 Financial Overview
      36. | | | 5.2.4.2 Products Offered
      37. | | | 5.2.4.3 Key Developments
      38. | | | 5.2.4.4 SWOT Analysis
      39. | | | 5.2.4.5 Key Strategies
      40. | | 5.2.5 William Hill (GB)
      41. | | | 5.2.5.1 Financial Overview
      42. | | | 5.2.5.2 Products Offered
      43. | | | 5.2.5.3 Key Developments
      44. | | | 5.2.5.4 SWOT Analysis
      45. | | | 5.2.5.5 Key Strategies
      46. | | 5.2.6 Kindred Group (SE)
      47. | | | 5.2.6.1 Financial Overview
      48. | | | 5.2.6.2 Products Offered
      49. | | | 5.2.6.3 Key Developments
      50. | | | 5.2.6.4 SWOT Analysis
      51. | | | 5.2.6.5 Key Strategies
      52. | | 5.2.7 888 Holdings (GB)
      53. | | | 5.2.7.1 Financial Overview
      54. | | | 5.2.7.2 Products Offered
      55. | | | 5.2.7.3 Key Developments
      56. | | | 5.2.7.4 SWOT Analysis
      57. | | | 5.2.7.5 Key Strategies
      58. | | 5.2.8 Caesars Entertainment (US)
      59. | | | 5.2.8.1 Financial Overview
      60. | | | 5.2.8.2 Products Offered
      61. | | | 5.2.8.3 Key Developments
      62. | | | 5.2.8.4 SWOT Analysis
      63. | | | 5.2.8.5 Key Strategies
      64. | | 5.2.9 MGM Resorts International (US)
      65. | | | 5.2.9.1 Financial Overview
      66. | | | 5.2.9.2 Products Offered
      67. | | | 5.2.9.3 Key Developments
      68. | | | 5.2.9.4 SWOT Analysis
      69. | | | 5.2.9.5 Key Strategies
      70. | 5.3 Appendix
      71. | | 5.3.1 References
      72. | | 5.3.2 Related Reports
    6. LIST OF FIGURES
      1. | 6.1 MARKET SYNOPSIS
      2. | 6.2 NORTH AMERICA MARKET ANALYSIS
      3. | 6.3 US MARKET ANALYSIS BY TYPE
      4. | 6.4 US MARKET ANALYSIS BY DEVICE
      5. | 6.5 US MARKET ANALYSIS BY PAYMENT METHOD
      6. | 6.6 US MARKET ANALYSIS BY USER TYPE
      7. | 6.7 CANADA MARKET ANALYSIS BY TYPE
      8. | 6.8 CANADA MARKET ANALYSIS BY DEVICE
      9. | 6.9 CANADA MARKET ANALYSIS BY PAYMENT METHOD
      10. | 6.10 CANADA MARKET ANALYSIS BY USER TYPE
      11. | 6.11 EUROPE MARKET ANALYSIS
      12. | 6.12 GERMANY MARKET ANALYSIS BY TYPE
      13. | 6.13 GERMANY MARKET ANALYSIS BY DEVICE
      14. | 6.14 GERMANY MARKET ANALYSIS BY PAYMENT METHOD
      15. | 6.15 GERMANY MARKET ANALYSIS BY USER TYPE
      16. | 6.16 UK MARKET ANALYSIS BY TYPE
      17. | 6.17 UK MARKET ANALYSIS BY DEVICE
      18. | 6.18 UK MARKET ANALYSIS BY PAYMENT METHOD
      19. | 6.19 UK MARKET ANALYSIS BY USER TYPE
      20. | 6.20 FRANCE MARKET ANALYSIS BY TYPE
      21. | 6.21 FRANCE MARKET ANALYSIS BY DEVICE
      22. | 6.22 FRANCE MARKET ANALYSIS BY PAYMENT METHOD
      23. | 6.23 FRANCE MARKET ANALYSIS BY USER TYPE
      24. | 6.24 RUSSIA MARKET ANALYSIS BY TYPE
      25. | 6.25 RUSSIA MARKET ANALYSIS BY DEVICE
      26. | 6.26 RUSSIA MARKET ANALYSIS BY PAYMENT METHOD
      27. | 6.27 RUSSIA MARKET ANALYSIS BY USER TYPE
      28. | 6.28 ITALY MARKET ANALYSIS BY TYPE
      29. | 6.29 ITALY MARKET ANALYSIS BY DEVICE
      30. | 6.30 ITALY MARKET ANALYSIS BY PAYMENT METHOD
      31. | 6.31 ITALY MARKET ANALYSIS BY USER TYPE
      32. | 6.32 SPAIN MARKET ANALYSIS BY TYPE
      33. | 6.33 SPAIN MARKET ANALYSIS BY DEVICE
      34. | 6.34 SPAIN MARKET ANALYSIS BY PAYMENT METHOD
      35. | 6.35 SPAIN MARKET ANALYSIS BY USER TYPE
      36. | 6.36 REST OF EUROPE MARKET ANALYSIS BY TYPE
      37. | 6.37 REST OF EUROPE MARKET ANALYSIS BY DEVICE
      38. | 6.38 REST OF EUROPE MARKET ANALYSIS BY PAYMENT METHOD
      39. | 6.39 REST OF EUROPE MARKET ANALYSIS BY USER TYPE
      40. | 6.40 APAC MARKET ANALYSIS
      41. | 6.41 CHINA MARKET ANALYSIS BY TYPE
      42. | 6.42 CHINA MARKET ANALYSIS BY DEVICE
      43. | 6.43 CHINA MARKET ANALYSIS BY PAYMENT METHOD
      44. | 6.44 CHINA MARKET ANALYSIS BY USER TYPE
      45. | 6.45 INDIA MARKET ANALYSIS BY TYPE
      46. | 6.46 INDIA MARKET ANALYSIS BY DEVICE
      47. | 6.47 INDIA MARKET ANALYSIS BY PAYMENT METHOD
      48. | 6.48 INDIA MARKET ANALYSIS BY USER TYPE
      49. | 6.49 JAPAN MARKET ANALYSIS BY TYPE
      50. | 6.50 JAPAN MARKET ANALYSIS BY DEVICE
      51. | 6.51 JAPAN MARKET ANALYSIS BY PAYMENT METHOD
      52. | 6.52 JAPAN MARKET ANALYSIS BY USER TYPE
      53. | 6.53 SOUTH KOREA MARKET ANALYSIS BY TYPE
      54. | 6.54 SOUTH KOREA MARKET ANALYSIS BY DEVICE
      55. | 6.55 SOUTH KOREA MARKET ANALYSIS BY PAYMENT METHOD
      56. | 6.56 SOUTH KOREA MARKET ANALYSIS BY USER TYPE
      57. | 6.57 MALAYSIA MARKET ANALYSIS BY TYPE
      58. | 6.58 MALAYSIA MARKET ANALYSIS BY DEVICE
      59. | 6.59 MALAYSIA MARKET ANALYSIS BY PAYMENT METHOD
      60. | 6.60 MALAYSIA MARKET ANALYSIS BY USER TYPE
      61. | 6.61 THAILAND MARKET ANALYSIS BY TYPE
      62. | 6.62 THAILAND MARKET ANALYSIS BY DEVICE
      63. | 6.63 THAILAND MARKET ANALYSIS BY PAYMENT METHOD
      64. | 6.64 THAILAND MARKET ANALYSIS BY USER TYPE
      65. | 6.65 INDONESIA MARKET ANALYSIS BY TYPE
      66. | 6.66 INDONESIA MARKET ANALYSIS BY DEVICE
      67. | 6.67 INDONESIA MARKET ANALYSIS BY PAYMENT METHOD
      68. | 6.68 INDONESIA MARKET ANALYSIS BY USER TYPE
      69. | 6.69 REST OF APAC MARKET ANALYSIS BY TYPE
      70. | 6.70 REST OF APAC MARKET ANALYSIS BY DEVICE
      71. | 6.71 REST OF APAC MARKET ANALYSIS BY PAYMENT METHOD
      72. | 6.72 REST OF APAC MARKET ANALYSIS BY USER TYPE
      73. | 6.73 SOUTH AMERICA MARKET ANALYSIS
      74. | 6.74 BRAZIL MARKET ANALYSIS BY TYPE
      75. | 6.75 BRAZIL MARKET ANALYSIS BY DEVICE
      76. | 6.76 BRAZIL MARKET ANALYSIS BY PAYMENT METHOD
      77. | 6.77 BRAZIL MARKET ANALYSIS BY USER TYPE
      78. | 6.78 MEXICO MARKET ANALYSIS BY TYPE
      79. | 6.79 MEXICO MARKET ANALYSIS BY DEVICE
      80. | 6.80 MEXICO MARKET ANALYSIS BY PAYMENT METHOD
      81. | 6.81 MEXICO MARKET ANALYSIS BY USER TYPE
      82. | 6.82 ARGENTINA MARKET ANALYSIS BY TYPE
      83. | 6.83 ARGENTINA MARKET ANALYSIS BY DEVICE
      84. | 6.84 ARGENTINA MARKET ANALYSIS BY PAYMENT METHOD
      85. | 6.85 ARGENTINA MARKET ANALYSIS BY USER TYPE
      86. | 6.86 REST OF SOUTH AMERICA MARKET ANALYSIS BY TYPE
      87. | 6.87 REST OF SOUTH AMERICA MARKET ANALYSIS BY DEVICE
      88. | 6.88 REST OF SOUTH AMERICA MARKET ANALYSIS BY PAYMENT METHOD
      89. | 6.89 REST OF SOUTH AMERICA MARKET ANALYSIS BY USER TYPE
      90. | 6.90 MEA MARKET ANALYSIS
      91. | 6.91 GCC COUNTRIES MARKET ANALYSIS BY TYPE
      92. | 6.92 GCC COUNTRIES MARKET ANALYSIS BY DEVICE
      93. | 6.93 GCC COUNTRIES MARKET ANALYSIS BY PAYMENT METHOD
      94. | 6.94 GCC COUNTRIES MARKET ANALYSIS BY USER TYPE
      95. | 6.95 SOUTH AFRICA MARKET ANALYSIS BY TYPE
      96. | 6.96 SOUTH AFRICA MARKET ANALYSIS BY DEVICE
      97. | 6.97 SOUTH AFRICA MARKET ANALYSIS BY PAYMENT METHOD
      98. | 6.98 SOUTH AFRICA MARKET ANALYSIS BY USER TYPE
      99. | 6.99 REST OF MEA MARKET ANALYSIS BY TYPE
      100. | 6.100 REST OF MEA MARKET ANALYSIS BY DEVICE
      101. | 6.101 REST OF MEA MARKET ANALYSIS BY PAYMENT METHOD
      102. | 6.102 REST OF MEA MARKET ANALYSIS BY USER TYPE
      103. | 6.103 KEY BUYING CRITERIA OF INFORMATION AND COMMUNICATIONS TECHNOLOGY
      104. | 6.104 RESEARCH PROCESS OF MRFR
      105. | 6.105 DRO ANALYSIS OF INFORMATION AND COMMUNICATIONS TECHNOLOGY
      106. | 6.106 DRIVERS IMPACT ANALYSIS: INFORMATION AND COMMUNICATIONS TECHNOLOGY
      107. | 6.107 RESTRAINTS IMPACT ANALYSIS: INFORMATION AND COMMUNICATIONS TECHNOLOGY
      108. | 6.108 SUPPLY / VALUE CHAIN: INFORMATION AND COMMUNICATIONS TECHNOLOGY
      109. | 6.109 INFORMATION AND COMMUNICATIONS TECHNOLOGY, BY TYPE, 2024 (% SHARE)
      110. | 6.110 INFORMATION AND COMMUNICATIONS TECHNOLOGY, BY TYPE, 2024 TO 2035 (USD Billion)
      111. | 6.111 INFORMATION AND COMMUNICATIONS TECHNOLOGY, BY DEVICE, 2024 (% SHARE)
      112. | 6.112 INFORMATION AND COMMUNICATIONS TECHNOLOGY, BY DEVICE, 2024 TO 2035 (USD Billion)
      113. | 6.113 INFORMATION AND COMMUNICATIONS TECHNOLOGY, BY PAYMENT METHOD, 2024 (% SHARE)
      114. | 6.114 INFORMATION AND COMMUNICATIONS TECHNOLOGY, BY PAYMENT METHOD, 2024 TO 2035 (USD Billion)
      115. | 6.115 INFORMATION AND COMMUNICATIONS TECHNOLOGY, BY USER TYPE, 2024 (% SHARE)
      116. | 6.116 INFORMATION AND COMMUNICATIONS TECHNOLOGY, BY USER TYPE, 2024 TO 2035 (USD Billion)
      117. | 6.117 BENCHMARKING OF MAJOR COMPETITORS
    7. LIST OF TABLES
      1. | 7.1 LIST OF ASSUMPTIONS
      2. | | 7.1.1
      3. | 7.2 North America MARKET SIZE ESTIMATES; FORECAST
      4. | | 7.2.1 BY TYPE, 2025-2035 (USD Billion)
      5. | | 7.2.2 BY DEVICE, 2025-2035 (USD Billion)
      6. | | 7.2.3 BY PAYMENT METHOD, 2025-2035 (USD Billion)
      7. | | 7.2.4 BY USER TYPE, 2025-2035 (USD Billion)
      8. | 7.3 US MARKET SIZE ESTIMATES; FORECAST
      9. | | 7.3.1 BY TYPE, 2025-2035 (USD Billion)
      10. | | 7.3.2 BY DEVICE, 2025-2035 (USD Billion)
      11. | | 7.3.3 BY PAYMENT METHOD, 2025-2035 (USD Billion)
      12. | | 7.3.4 BY USER TYPE, 2025-2035 (USD Billion)
      13. | 7.4 Canada MARKET SIZE ESTIMATES; FORECAST
      14. | | 7.4.1 BY TYPE, 2025-2035 (USD Billion)
      15. | | 7.4.2 BY DEVICE, 2025-2035 (USD Billion)
      16. | | 7.4.3 BY PAYMENT METHOD, 2025-2035 (USD Billion)
      17. | | 7.4.4 BY USER TYPE, 2025-2035 (USD Billion)
      18. | 7.5 Europe MARKET SIZE ESTIMATES; FORECAST
      19. | | 7.5.1 BY TYPE, 2025-2035 (USD Billion)
      20. | | 7.5.2 BY DEVICE, 2025-2035 (USD Billion)
      21. | | 7.5.3 BY PAYMENT METHOD, 2025-2035 (USD Billion)
      22. | | 7.5.4 BY USER TYPE, 2025-2035 (USD Billion)
      23. | 7.6 Germany MARKET SIZE ESTIMATES; FORECAST
      24. | | 7.6.1 BY TYPE, 2025-2035 (USD Billion)
      25. | | 7.6.2 BY DEVICE, 2025-2035 (USD Billion)
      26. | | 7.6.3 BY PAYMENT METHOD, 2025-2035 (USD Billion)
      27. | | 7.6.4 BY USER TYPE, 2025-2035 (USD Billion)
      28. | 7.7 UK MARKET SIZE ESTIMATES; FORECAST
      29. | | 7.7.1 BY TYPE, 2025-2035 (USD Billion)
      30. | | 7.7.2 BY DEVICE, 2025-2035 (USD Billion)
      31. | | 7.7.3 BY PAYMENT METHOD, 2025-2035 (USD Billion)
      32. | | 7.7.4 BY USER TYPE, 2025-2035 (USD Billion)
      33. | 7.8 France MARKET SIZE ESTIMATES; FORECAST
      34. | | 7.8.1 BY TYPE, 2025-2035 (USD Billion)
      35. | | 7.8.2 BY DEVICE, 2025-2035 (USD Billion)
      36. | | 7.8.3 BY PAYMENT METHOD, 2025-2035 (USD Billion)
      37. | | 7.8.4 BY USER TYPE, 2025-2035 (USD Billion)
      38. | 7.9 Russia MARKET SIZE ESTIMATES; FORECAST
      39. | | 7.9.1 BY TYPE, 2025-2035 (USD Billion)
      40. | | 7.9.2 BY DEVICE, 2025-2035 (USD Billion)
      41. | | 7.9.3 BY PAYMENT METHOD, 2025-2035 (USD Billion)
      42. | | 7.9.4 BY USER TYPE, 2025-2035 (USD Billion)
      43. | 7.10 Italy MARKET SIZE ESTIMATES; FORECAST
      44. | | 7.10.1 BY TYPE, 2025-2035 (USD Billion)
      45. | | 7.10.2 BY DEVICE, 2025-2035 (USD Billion)
      46. | | 7.10.3 BY PAYMENT METHOD, 2025-2035 (USD Billion)
      47. | | 7.10.4 BY USER TYPE, 2025-2035 (USD Billion)
      48. | 7.11 Spain MARKET SIZE ESTIMATES; FORECAST
      49. | | 7.11.1 BY TYPE, 2025-2035 (USD Billion)
      50. | | 7.11.2 BY DEVICE, 2025-2035 (USD Billion)
      51. | | 7.11.3 BY PAYMENT METHOD, 2025-2035 (USD Billion)
      52. | | 7.11.4 BY USER TYPE, 2025-2035 (USD Billion)
      53. | 7.12 Rest of Europe MARKET SIZE ESTIMATES; FORECAST
      54. | | 7.12.1 BY TYPE, 2025-2035 (USD Billion)
      55. | | 7.12.2 BY DEVICE, 2025-2035 (USD Billion)
      56. | | 7.12.3 BY PAYMENT METHOD, 2025-2035 (USD Billion)
      57. | | 7.12.4 BY USER TYPE, 2025-2035 (USD Billion)
      58. | 7.13 APAC MARKET SIZE ESTIMATES; FORECAST
      59. | | 7.13.1 BY TYPE, 2025-2035 (USD Billion)
      60. | | 7.13.2 BY DEVICE, 2025-2035 (USD Billion)
      61. | | 7.13.3 BY PAYMENT METHOD, 2025-2035 (USD Billion)
      62. | | 7.13.4 BY USER TYPE, 2025-2035 (USD Billion)
      63. | 7.14 China MARKET SIZE ESTIMATES; FORECAST
      64. | | 7.14.1 BY TYPE, 2025-2035 (USD Billion)
      65. | | 7.14.2 BY DEVICE, 2025-2035 (USD Billion)
      66. | | 7.14.3 BY PAYMENT METHOD, 2025-2035 (USD Billion)
      67. | | 7.14.4 BY USER TYPE, 2025-2035 (USD Billion)
      68. | 7.15 India MARKET SIZE ESTIMATES; FORECAST
      69. | | 7.15.1 BY TYPE, 2025-2035 (USD Billion)
      70. | | 7.15.2 BY DEVICE, 2025-2035 (USD Billion)
      71. | | 7.15.3 BY PAYMENT METHOD, 2025-2035 (USD Billion)
      72. | | 7.15.4 BY USER TYPE, 2025-2035 (USD Billion)
      73. | 7.16 Japan MARKET SIZE ESTIMATES; FORECAST
      74. | | 7.16.1 BY TYPE, 2025-2035 (USD Billion)
      75. | | 7.16.2 BY DEVICE, 2025-2035 (USD Billion)
      76. | | 7.16.3 BY PAYMENT METHOD, 2025-2035 (USD Billion)
      77. | | 7.16.4 BY USER TYPE, 2025-2035 (USD Billion)
      78. | 7.17 South Korea MARKET SIZE ESTIMATES; FORECAST
      79. | | 7.17.1 BY TYPE, 2025-2035 (USD Billion)
      80. | | 7.17.2 BY DEVICE, 2025-2035 (USD Billion)
      81. | | 7.17.3 BY PAYMENT METHOD, 2025-2035 (USD Billion)
      82. | | 7.17.4 BY USER TYPE, 2025-2035 (USD Billion)
      83. | 7.18 Malaysia MARKET SIZE ESTIMATES; FORECAST
      84. | | 7.18.1 BY TYPE, 2025-2035 (USD Billion)
      85. | | 7.18.2 BY DEVICE, 2025-2035 (USD Billion)
      86. | | 7.18.3 BY PAYMENT METHOD, 2025-2035 (USD Billion)
      87. | | 7.18.4 BY USER TYPE, 2025-2035 (USD Billion)
      88. | 7.19 Thailand MARKET SIZE ESTIMATES; FORECAST
      89. | | 7.19.1 BY TYPE, 2025-2035 (USD Billion)
      90. | | 7.19.2 BY DEVICE, 2025-2035 (USD Billion)
      91. | | 7.19.3 BY PAYMENT METHOD, 2025-2035 (USD Billion)
      92. | | 7.19.4 BY USER TYPE, 2025-2035 (USD Billion)
      93. | 7.20 Indonesia MARKET SIZE ESTIMATES; FORECAST
      94. | | 7.20.1 BY TYPE, 2025-2035 (USD Billion)
      95. | | 7.20.2 BY DEVICE, 2025-2035 (USD Billion)
      96. | | 7.20.3 BY PAYMENT METHOD, 2025-2035 (USD Billion)
      97. | | 7.20.4 BY USER TYPE, 2025-2035 (USD Billion)
      98. | 7.21 Rest of APAC MARKET SIZE ESTIMATES; FORECAST
      99. | | 7.21.1 BY TYPE, 2025-2035 (USD Billion)
      100. | | 7.21.2 BY DEVICE, 2025-2035 (USD Billion)
      101. | | 7.21.3 BY PAYMENT METHOD, 2025-2035 (USD Billion)
      102. | | 7.21.4 BY USER TYPE, 2025-2035 (USD Billion)
      103. | 7.22 South America MARKET SIZE ESTIMATES; FORECAST
      104. | | 7.22.1 BY TYPE, 2025-2035 (USD Billion)
      105. | | 7.22.2 BY DEVICE, 2025-2035 (USD Billion)
      106. | | 7.22.3 BY PAYMENT METHOD, 2025-2035 (USD Billion)
      107. | | 7.22.4 BY USER TYPE, 2025-2035 (USD Billion)
      108. | 7.23 Brazil MARKET SIZE ESTIMATES; FORECAST
      109. | | 7.23.1 BY TYPE, 2025-2035 (USD Billion)
      110. | | 7.23.2 BY DEVICE, 2025-2035 (USD Billion)
      111. | | 7.23.3 BY PAYMENT METHOD, 2025-2035 (USD Billion)
      112. | | 7.23.4 BY USER TYPE, 2025-2035 (USD Billion)
      113. | 7.24 Mexico MARKET SIZE ESTIMATES; FORECAST
      114. | | 7.24.1 BY TYPE, 2025-2035 (USD Billion)
      115. | | 7.24.2 BY DEVICE, 2025-2035 (USD Billion)
      116. | | 7.24.3 BY PAYMENT METHOD, 2025-2035 (USD Billion)
      117. | | 7.24.4 BY USER TYPE, 2025-2035 (USD Billion)
      118. | 7.25 Argentina MARKET SIZE ESTIMATES; FORECAST
      119. | | 7.25.1 BY TYPE, 2025-2035 (USD Billion)
      120. | | 7.25.2 BY DEVICE, 2025-2035 (USD Billion)
      121. | | 7.25.3 BY PAYMENT METHOD, 2025-2035 (USD Billion)
      122. | | 7.25.4 BY USER TYPE, 2025-2035 (USD Billion)
      123. | 7.26 Rest of South America MARKET SIZE ESTIMATES; FORECAST
      124. | | 7.26.1 BY TYPE, 2025-2035 (USD Billion)
      125. | | 7.26.2 BY DEVICE, 2025-2035 (USD Billion)
      126. | | 7.26.3 BY PAYMENT METHOD, 2025-2035 (USD Billion)
      127. | | 7.26.4 BY USER TYPE, 2025-2035 (USD Billion)
      128. | 7.27 MEA MARKET SIZE ESTIMATES; FORECAST
      129. | | 7.27.1 BY TYPE, 2025-2035 (USD Billion)
      130. | | 7.27.2 BY DEVICE, 2025-2035 (USD Billion)
      131. | | 7.27.3 BY PAYMENT METHOD, 2025-2035 (USD Billion)
      132. | | 7.27.4 BY USER TYPE, 2025-2035 (USD Billion)
      133. | 7.28 GCC Countries MARKET SIZE ESTIMATES; FORECAST
      134. | | 7.28.1 BY TYPE, 2025-2035 (USD Billion)
      135. | | 7.28.2 BY DEVICE, 2025-2035 (USD Billion)
      136. | | 7.28.3 BY PAYMENT METHOD, 2025-2035 (USD Billion)
      137. | | 7.28.4 BY USER TYPE, 2025-2035 (USD Billion)
      138. | 7.29 South Africa MARKET SIZE ESTIMATES; FORECAST
      139. | | 7.29.1 BY TYPE, 2025-2035 (USD Billion)
      140. | | 7.29.2 BY DEVICE, 2025-2035 (USD Billion)
      141. | | 7.29.3 BY PAYMENT METHOD, 2025-2035 (USD Billion)
      142. | | 7.29.4 BY USER TYPE, 2025-2035 (USD Billion)
      143. | 7.30 Rest of MEA MARKET SIZE ESTIMATES; FORECAST
      144. | | 7.30.1 BY TYPE, 2025-2035 (USD Billion)
      145. | | 7.30.2 BY DEVICE, 2025-2035 (USD Billion)
      146. | | 7.30.3 BY PAYMENT METHOD, 2025-2035 (USD Billion)
      147. | | 7.30.4 BY USER TYPE, 2025-2035 (USD Billion)
      148. | 7.31 PRODUCT LAUNCH/PRODUCT DEVELOPMENT/APPROVAL
      149. | | 7.31.1
      150. | 7.32 ACQUISITION/PARTNERSHIP
      151. | | 7.32.1

    Online Gambling Market Segmentation


    Online Gambling Market By Game Type (USD Billion, 2019-2035)

    Casino Games

    Sports Betting

    Poker

    Bingo

    Esports Betting


    Online Gambling Market By Device Type (USD Billion, 2019-2035)

    Desktop

    Mobile

    Tablet


    Online Gambling Market By Payment Method (USD Billion, 2019-2035)

    Credit/Debit Cards

    E-Wallets

    Bank Transfers

    Cryptocurrency


    Online Gambling Market By User Type (USD Billion, 2019-2035)

    Casual Players

    Professional Players

    High Rollers


    Online Gambling Market By Regional (USD Billion, 2019-2035)

    North America

    Europe

    South America

    Asia Pacific

    Middle East and Africa


    Online Gambling Market Regional Outlook (USD Billion, 2019-2035)


    North America Outlook (USD Billion, 2019-2035)

    North America Online Gambling Market by Game Type

    Casino Games

    Sports Betting

    Poker

    Bingo

    Esports Betting

    North America Online Gambling Market by Device Type

    Desktop

    Mobile

    Tablet

    North America Online Gambling Market by Payment Method Type

    Credit/Debit Cards

    E-Wallets

    Bank Transfers

    Cryptocurrency

    North America Online Gambling Market by User Type

    Casual Players

    Professional Players

    High Rollers

    North America Online Gambling Market by Regional Type

    US

    Canada

    US Outlook (USD Billion, 2019-2035)

    US Online Gambling Market by Game Type

    Casino Games

    Sports Betting

    Poker

    Bingo

    Esports Betting

    US Online Gambling Market by Device Type

    Desktop

    Mobile

    Tablet

    US Online Gambling Market by Payment Method Type

    Credit/Debit Cards

    E-Wallets

    Bank Transfers

    Cryptocurrency

    US Online Gambling Market by User Type

    Casual Players

    Professional Players

    High Rollers

    CANADA Outlook (USD Billion, 2019-2035)

    CANADA Online Gambling Market by Game Type

    Casino Games

    Sports Betting

    Poker

    Bingo

    Esports Betting

    CANADA Online Gambling Market by Device Type

    Desktop

    Mobile

    Tablet

    CANADA Online Gambling Market by Payment Method Type

    Credit/Debit Cards

    E-Wallets

    Bank Transfers

    Cryptocurrency

    CANADA Online Gambling Market by User Type

    Casual Players

    Professional Players

    High Rollers

    Europe Outlook (USD Billion, 2019-2035)

    Europe Online Gambling Market by Game Type

    Casino Games

    Sports Betting

    Poker

    Bingo

    Esports Betting

    Europe Online Gambling Market by Device Type

    Desktop

    Mobile

    Tablet

    Europe Online Gambling Market by Payment Method Type

    Credit/Debit Cards

    E-Wallets

    Bank Transfers

    Cryptocurrency

    Europe Online Gambling Market by User Type

    Casual Players

    Professional Players

    High Rollers

    Europe Online Gambling Market by Regional Type

    Germany

    UK

    France

    Russia

    Italy

    Spain

    Rest of Europe

    GERMANY Outlook (USD Billion, 2019-2035)

    GERMANY Online Gambling Market by Game Type

    Casino Games

    Sports Betting

    Poker

    Bingo

    Esports Betting

    GERMANY Online Gambling Market by Device Type

    Desktop

    Mobile

    Tablet

    GERMANY Online Gambling Market by Payment Method Type

    Credit/Debit Cards

    E-Wallets

    Bank Transfers

    Cryptocurrency

    GERMANY Online Gambling Market by User Type

    Casual Players

    Professional Players

    High Rollers

    UK Outlook (USD Billion, 2019-2035)

    UK Online Gambling Market by Game Type

    Casino Games

    Sports Betting

    Poker

    Bingo

    Esports Betting

    UK Online Gambling Market by Device Type

    Desktop

    Mobile

    Tablet

    UK Online Gambling Market by Payment Method Type

    Credit/Debit Cards

    E-Wallets

    Bank Transfers

    Cryptocurrency

    UK Online Gambling Market by User Type

    Casual Players

    Professional Players

    High Rollers

    FRANCE Outlook (USD Billion, 2019-2035)

    FRANCE Online Gambling Market by Game Type

    Casino Games

    Sports Betting

    Poker

    Bingo

    Esports Betting

    FRANCE Online Gambling Market by Device Type

    Desktop

    Mobile

    Tablet

    FRANCE Online Gambling Market by Payment Method Type

    Credit/Debit Cards

    E-Wallets

    Bank Transfers

    Cryptocurrency

    FRANCE Online Gambling Market by User Type

    Casual Players

    Professional Players

    High Rollers

    RUSSIA Outlook (USD Billion, 2019-2035)

    RUSSIA Online Gambling Market by Game Type

    Casino Games

    Sports Betting

    Poker

    Bingo

    Esports Betting

    RUSSIA Online Gambling Market by Device Type

    Desktop

    Mobile

    Tablet

    RUSSIA Online Gambling Market by Payment Method Type

    Credit/Debit Cards

    E-Wallets

    Bank Transfers

    Cryptocurrency

    RUSSIA Online Gambling Market by User Type

    Casual Players

    Professional Players

    High Rollers

    ITALY Outlook (USD Billion, 2019-2035)

    ITALY Online Gambling Market by Game Type

    Casino Games

    Sports Betting

    Poker

    Bingo

    Esports Betting

    ITALY Online Gambling Market by Device Type

    Desktop

    Mobile

    Tablet

    ITALY Online Gambling Market by Payment Method Type

    Credit/Debit Cards

    E-Wallets

    Bank Transfers

    Cryptocurrency

    ITALY Online Gambling Market by User Type

    Casual Players

    Professional Players

    High Rollers

    SPAIN Outlook (USD Billion, 2019-2035)

    SPAIN Online Gambling Market by Game Type

    Casino Games

    Sports Betting

    Poker

    Bingo

    Esports Betting

    SPAIN Online Gambling Market by Device Type

    Desktop

    Mobile

    Tablet

    SPAIN Online Gambling Market by Payment Method Type

    Credit/Debit Cards

    E-Wallets

    Bank Transfers

    Cryptocurrency

    SPAIN Online Gambling Market by User Type

    Casual Players

    Professional Players

    High Rollers

    REST OF EUROPE Outlook (USD Billion, 2019-2035)

    REST OF EUROPE Online Gambling Market by Game Type

    Casino Games

    Sports Betting

    Poker

    Bingo

    Esports Betting

    REST OF EUROPE Online Gambling Market by Device Type

    Desktop

    Mobile

    Tablet

    REST OF EUROPE Online Gambling Market by Payment Method Type

    Credit/Debit Cards

    E-Wallets

    Bank Transfers

    Cryptocurrency

    REST OF EUROPE Online Gambling Market by User Type

    Casual Players

    Professional Players

    High Rollers

    APAC Outlook (USD Billion, 2019-2035)

    APAC Online Gambling Market by Game Type

    Casino Games

    Sports Betting

    Poker

    Bingo

    Esports Betting

    APAC Online Gambling Market by Device Type

    Desktop

    Mobile

    Tablet

    APAC Online Gambling Market by Payment Method Type

    Credit/Debit Cards

    E-Wallets

    Bank Transfers

    Cryptocurrency

    APAC Online Gambling Market by User Type

    Casual Players

    Professional Players

    High Rollers

    APAC Online Gambling Market by Regional Type

    China

    India

    Japan

    South Korea

    Malaysia

    Thailand

    Indonesia

    Rest of APAC

    CHINA Outlook (USD Billion, 2019-2035)

    CHINA Online Gambling Market by Game Type

    Casino Games

    Sports Betting

    Poker

    Bingo

    Esports Betting

    CHINA Online Gambling Market by Device Type

    Desktop

    Mobile

    Tablet

    CHINA Online Gambling Market by Payment Method Type

    Credit/Debit Cards

    E-Wallets

    Bank Transfers

    Cryptocurrency

    CHINA Online Gambling Market by User Type

    Casual Players

    Professional Players

    High Rollers

    INDIA Outlook (USD Billion, 2019-2035)

    INDIA Online Gambling Market by Game Type

    Casino Games

    Sports Betting

    Poker

    Bingo

    Esports Betting

    INDIA Online Gambling Market by Device Type

    Desktop

    Mobile

    Tablet

    INDIA Online Gambling Market by Payment Method Type

    Credit/Debit Cards

    E-Wallets

    Bank Transfers

    Cryptocurrency

    INDIA Online Gambling Market by User Type

    Casual Players

    Professional Players

    High Rollers

    JAPAN Outlook (USD Billion, 2019-2035)

    JAPAN Online Gambling Market by Game Type

    Casino Games

    Sports Betting

    Poker

    Bingo

    Esports Betting

    JAPAN Online Gambling Market by Device Type

    Desktop

    Mobile

    Tablet

    JAPAN Online Gambling Market by Payment Method Type

    Credit/Debit Cards

    E-Wallets

    Bank Transfers

    Cryptocurrency

    JAPAN Online Gambling Market by User Type

    Casual Players

    Professional Players

    High Rollers

    SOUTH KOREA Outlook (USD Billion, 2019-2035)

    SOUTH KOREA Online Gambling Market by Game Type

    Casino Games

    Sports Betting

    Poker

    Bingo

    Esports Betting

    SOUTH KOREA Online Gambling Market by Device Type

    Desktop

    Mobile

    Tablet

    SOUTH KOREA Online Gambling Market by Payment Method Type

    Credit/Debit Cards

    E-Wallets

    Bank Transfers

    Cryptocurrency

    SOUTH KOREA Online Gambling Market by User Type

    Casual Players

    Professional Players

    High Rollers

    MALAYSIA Outlook (USD Billion, 2019-2035)

    MALAYSIA Online Gambling Market by Game Type

    Casino Games

    Sports Betting

    Poker

    Bingo

    Esports Betting

    MALAYSIA Online Gambling Market by Device Type

    Desktop

    Mobile

    Tablet

    MALAYSIA Online Gambling Market by Payment Method Type

    Credit/Debit Cards

    E-Wallets

    Bank Transfers

    Cryptocurrency

    MALAYSIA Online Gambling Market by User Type

    Casual Players

    Professional Players

    High Rollers

    THAILAND Outlook (USD Billion, 2019-2035)

    THAILAND Online Gambling Market by Game Type

    Casino Games

    Sports Betting

    Poker

    Bingo

    Esports Betting

    THAILAND Online Gambling Market by Device Type

    Desktop

    Mobile

    Tablet

    THAILAND Online Gambling Market by Payment Method Type

    Credit/Debit Cards

    E-Wallets

    Bank Transfers

    Cryptocurrency

    THAILAND Online Gambling Market by User Type

    Casual Players

    Professional Players

    High Rollers

    INDONESIA Outlook (USD Billion, 2019-2035)

    INDONESIA Online Gambling Market by Game Type

    Casino Games

    Sports Betting

    Poker

    Bingo

    Esports Betting

    INDONESIA Online Gambling Market by Device Type

    Desktop

    Mobile

    Tablet

    INDONESIA Online Gambling Market by Payment Method Type

    Credit/Debit Cards

    E-Wallets

    Bank Transfers

    Cryptocurrency

    INDONESIA Online Gambling Market by User Type

    Casual Players

    Professional Players

    High Rollers

    REST OF APAC Outlook (USD Billion, 2019-2035)

    REST OF APAC Online Gambling Market by Game Type

    Casino Games

    Sports Betting

    Poker

    Bingo

    Esports Betting

    REST OF APAC Online Gambling Market by Device Type

    Desktop

    Mobile

    Tablet

    REST OF APAC Online Gambling Market by Payment Method Type

    Credit/Debit Cards

    E-Wallets

    Bank Transfers

    Cryptocurrency

    REST OF APAC Online Gambling Market by User Type

    Casual Players

    Professional Players

    High Rollers

    South America Outlook (USD Billion, 2019-2035)

    South America Online Gambling Market by Game Type

    Casino Games

    Sports Betting

    Poker

    Bingo

    Esports Betting

    South America Online Gambling Market by Device Type

    Desktop

    Mobile

    Tablet

    South America Online Gambling Market by Payment Method Type

    Credit/Debit Cards

    E-Wallets

    Bank Transfers

    Cryptocurrency

    South America Online Gambling Market by User Type

    Casual Players

    Professional Players

    High Rollers

    South America Online Gambling Market by Regional Type

    Brazil

    Mexico

    Argentina

    Rest of South America

    BRAZIL Outlook (USD Billion, 2019-2035)

    BRAZIL Online Gambling Market by Game Type

    Casino Games

    Sports Betting

    Poker

    Bingo

    Esports Betting

    BRAZIL Online Gambling Market by Device Type

    Desktop

    Mobile

    Tablet

    BRAZIL Online Gambling Market by Payment Method Type

    Credit/Debit Cards

    E-Wallets

    Bank Transfers

    Cryptocurrency

    BRAZIL Online Gambling Market by User Type

    Casual Players

    Professional Players

    High Rollers

    MEXICO Outlook (USD Billion, 2019-2035)

    MEXICO Online Gambling Market by Game Type

    Casino Games

    Sports Betting

    Poker

    Bingo

    Esports Betting

    MEXICO Online Gambling Market by Device Type

    Desktop

    Mobile

    Tablet

    MEXICO Online Gambling Market by Payment Method Type

    Credit/Debit Cards

    E-Wallets

    Bank Transfers

    Cryptocurrency

    MEXICO Online Gambling Market by User Type

    Casual Players

    Professional Players

    High Rollers

    ARGENTINA Outlook (USD Billion, 2019-2035)

    ARGENTINA Online Gambling Market by Game Type

    Casino Games

    Sports Betting

    Poker

    Bingo

    Esports Betting

    ARGENTINA Online Gambling Market by Device Type

    Desktop

    Mobile

    Tablet

    ARGENTINA Online Gambling Market by Payment Method Type

    Credit/Debit Cards

    E-Wallets

    Bank Transfers

    Cryptocurrency

    ARGENTINA Online Gambling Market by User Type

    Casual Players

    Professional Players

    High Rollers

    REST OF SOUTH AMERICA Outlook (USD Billion, 2019-2035)

    REST OF SOUTH AMERICA Online Gambling Market by Game Type

    Casino Games

    Sports Betting

    Poker

    Bingo

    Esports Betting

    REST OF SOUTH AMERICA Online Gambling Market by Device Type

    Desktop

    Mobile

    Tablet

    REST OF SOUTH AMERICA Online Gambling Market by Payment Method Type

    Credit/Debit Cards

    E-Wallets

    Bank Transfers

    Cryptocurrency

    REST OF SOUTH AMERICA Online Gambling Market by User Type

    Casual Players

    Professional Players

    High Rollers

    MEA Outlook (USD Billion, 2019-2035)

    MEA Online Gambling Market by Game Type

    Casino Games

    Sports Betting

    Poker

    Bingo

    Esports Betting

    MEA Online Gambling Market by Device Type

    Desktop

    Mobile

    Tablet

    MEA Online Gambling Market by Payment Method Type

    Credit/Debit Cards

    E-Wallets

    Bank Transfers

    Cryptocurrency

    MEA Online Gambling Market by User Type

    Casual Players

    Professional Players

    High Rollers

    MEA Online Gambling Market by Regional Type

    GCC Countries

    South Africa

    Rest of MEA

    GCC COUNTRIES Outlook (USD Billion, 2019-2035)

    GCC COUNTRIES Online Gambling Market by Game Type

    Casino Games

    Sports Betting

    Poker

    Bingo

    Esports Betting

    GCC COUNTRIES Online Gambling Market by Device Type

    Desktop

    Mobile

    Tablet

    GCC COUNTRIES Online Gambling Market by Payment Method Type

    Credit/Debit Cards

    E-Wallets

    Bank Transfers

    Cryptocurrency

    GCC COUNTRIES Online Gambling Market by User Type

    Casual Players

    Professional Players

    High Rollers

    SOUTH AFRICA Outlook (USD Billion, 2019-2035)

    SOUTH AFRICA Online Gambling Market by Game Type

    Casino Games

    Sports Betting

    Poker

    Bingo

    Esports Betting

    SOUTH AFRICA Online Gambling Market by Device Type

    Desktop

    Mobile

    Tablet

    SOUTH AFRICA Online Gambling Market by Payment Method Type

    Credit/Debit Cards

    E-Wallets

    Bank Transfers

    Cryptocurrency

    SOUTH AFRICA Online Gambling Market by User Type

    Casual Players

    Professional Players

    High Rollers

    REST OF MEA Outlook (USD Billion, 2019-2035)

    REST OF MEA Online Gambling Market by Game Type

    Casino Games

    Sports Betting

    Poker

    Bingo

    Esports Betting

    REST OF MEA Online Gambling Market by Device Type

    Desktop

    Mobile

    Tablet

    REST OF MEA Online Gambling Market by Payment Method Type

    Credit/Debit Cards

    E-Wallets

    Bank Transfers

    Cryptocurrency

    REST OF MEA Online Gambling Market by User Type

    Casual Players

    Professional Players

    High Rollers

    Infographic

    Free Sample Request

    Kindly complete the form below to receive a free sample of this Report

    Get Free Sample

    Customer Strories

    “I am very pleased with how market segments have been defined in a relevant way for my purposes (such as "Portable Freezers & refrigerators" and "last-mile"). In general the report is well structured. Thanks very much for your efforts.”

    Victoria Milne

    Founder
    Case Study
    Chemicals and Materials

    Compare Licence

    ×
    Features License Type
    Single User Multiuser License Enterprise User
    Price $4,950 $5,950 $7,250
    Maximum User Access Limit 1 User Upto 10 Users Unrestricted Access Throughout the Organization
    Free Customization
    Direct Access to Analyst
    Deliverable Format
    Platform Access
    Discount on Next Purchase 10% 15% 15%
    Printable Versions