物流自動化市場 (2026 – 2035)

物流自動化市場の規模、シェアおよび調査レポート(機能別:倉庫自動化、輸送自動化)、自動化レベル別(半自動システム、完全自動システム)、コンポーネント別(ハードウェア、ソフトウェア、サービス)、エンドユーザー産業別(Eコマースおよび小包、食品および飲料、食料品小売、アパレルおよびファッション、製造、その他)および地域別(北米、ヨーロッパ、南米、アジア太平洋、中東およびアフリカ) - 2035年までの業界予測。
ID: MRFR/ICT/6547-HCR 111 Pages Ankit Gupta Last Updated: September 15, 2026
Logistics Automation Market
Market Size
Forecast Period2026-2035
CAGR (2026-2035)8.55%
2025 Market SizeUSD 86.95 Billion
2035 Market SizeUSD 182.64 Billion
Key Players
Dematic
Honeywell Intelligrated
KNAPP AG
Daifuku Co., Ltd.
SSI SCHÄFER
Swisslog
Opportunities
  • Robotics-as-a-Service (RaaS) for SME Logistics Providers
  • Autonomous Middle-Mile Freight Corridors
  • AI-Powered Demand Sensing and Predictive Fulfillment

物流自動化市場 市場概要

The Logistics Automation Market was valued at USD 86.95 billion in 2025 and is projected to reach USD 96.52 billion in 2026 before climbing to USD 182.64 billion by 2035, expanding at a CAGR of 8.55% during 2026–2035. Two structural forces are accelerating this trajectory: persistently tight labor conditions across warehousing and freight corridors, and government-backed energy-efficiency mandates — including the EU's revised Energy Efficiency Directive — that penalize idle-asset logistics and reward automated warehouse systems capable of cutting facility energy use by 20–30% [2]. Global business-to-consumer parcel shipments crossed 128 billion units in 2025, overwhelming manual fulfillment infrastructure and compelling operators to deploy goods-to-person robotics at scale.

A technology pivot is reshaping the Logistics Automation Market from hardware-centric conveyor installations toward software-defined orchestration layers that unify robotic logistics solutions, fleet management, and real-time inventory visibility. Private 5G rollouts — backed by over USD 4.8 billion in enterprise edge-connectivity spending during 2024 alone — now enable low-latency coordination of hundreds of autonomous mobile robots inside a single distribution center [3]. Freight automation platforms are simultaneously absorbing legacy TMS modules, replacing siloed dispatch tools with AI-driven load-matching engines that cut empty-mile ratios by 12–18%.

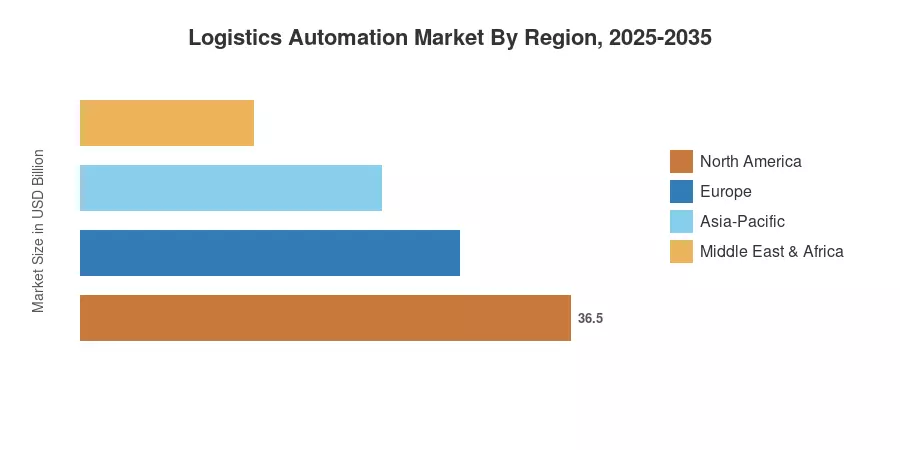
North America commands the largest share of the Logistics Automation Market at roughly 37% of 2025 revenue, anchored by the United States' dense e-commerce infrastructure and aggressive autonomous delivery technology pilots across suburban corridors. Asia-Pacific is the fastest-growing region, posting a CAGR of 8.75% through 2035, driven by China's smart-logistics corridor investments and India's warehouse modernization push under the National Logistics Policy. Europe holds the second-largest position, with supply chain automation spending concentrated in Germany, the Netherlands, and the Nordic countries. As labor costs continue rising and sustainability reporting standards tighten, the Logistics Automation Market is poised for sustained double-digit investment growth in several sub-segments through the end of the decade.

Key Report Takeaways

• By Function

  • Warehouse automation captured 60.15% revenue share of the Logistics Automation Market in 2025, driven by the proliferation of automated warehouse systems in mega-fulfillment centers
  • Transportation automation is projected to grow at a CAGR of 8.58% through 2035, propelled by freight automation platforms integrating real-time route optimization

• By Automation Level

  • Semi-automated systems accounted for USD 56.73 billion in 2025 spending, as brownfield facilities retrofitted existing conveyors with robotic logistics solutions
  • Fully-automated systems are the fastest-growing segment in the Logistics Automation Market, delivering an 8.62% CAGR across the forecast period

• By Component

  • Hardware dominated 65.47% of 2025 component spending, reflecting capital-intensive AMR and AS/RS deployments
  • Software is on track for the highest component CAGR at 8.67%, as supply chain automation shifts toward SaaS orchestration

• By End-User Industry

  • E-commerce and parcel operations held a 41.08% revenue share in 2025, with autonomous delivery technology investments accelerating last-mile speed
  • Grocery retail is forecast to deliver an 8.70% CAGR through 2035, fueled by micro-fulfillment center expansion

• By Region

  • North America led the Logistics Automation Market with 37.02% share in 2025
  • Asia-Pacific is poised for the fastest regional CAGR of 8.75% during 2026–2035, with China and India as primary growth engines

Market Size and Forecast (2021–2035)

MRFR's market sizing integrates bottom-up revenue analysis from 320+ logistics technology vendors, validated against top-down macro indicators including industrial robotics shipment data, warehouse construction permits, and freight-tech venture funding rounds. Historical figures reflect audited company revenues and customs data; forecast projections apply segment-level CAGR curves calibrated to regional policy timelines and capital expenditure cycles.
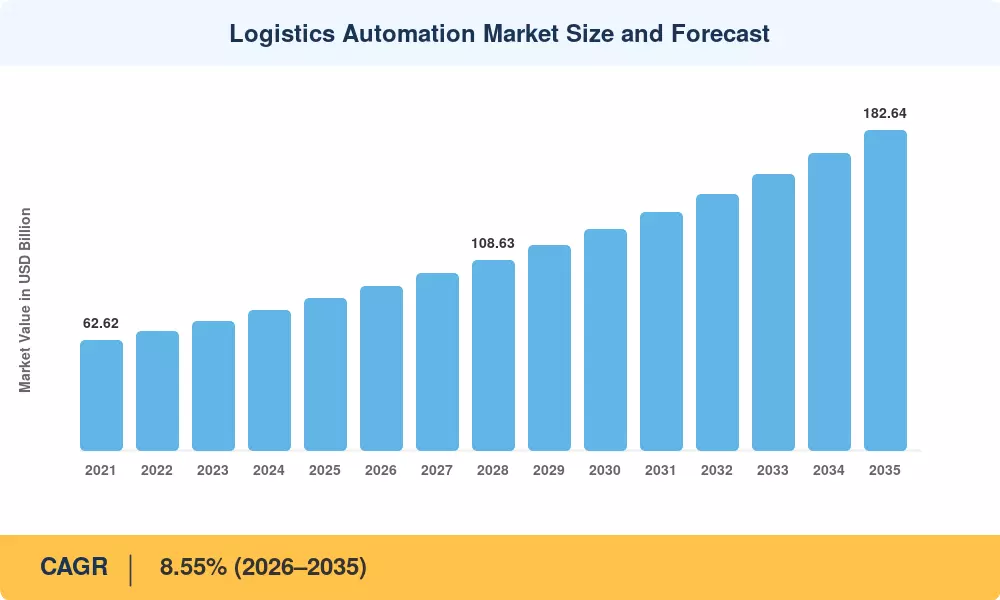
Logistics Automation Market Size and Forecast
Our Impact

Enabled $4.3B Revenue Impact for Fortune 500 and Leading Multinationals

Partnering with 2000+ Global Organizations Each Year

30K+ Citations by Top-Tier Firms in the Industry


Driver Impact Analysis

Driver ~% Impact on CAGR Geographic Relevance Impact Timeline
E-commerce parcel volume explosion +1.8% Global Short-term (≤2 yr)
Labor scarcity & wage inflation in warehousing +1.5% North America, Europe Medium-term (2–4 yr)
Private 5G & edge-connectivity rollouts +1.2% Asia-Pacific, North America Medium-term (2–4 yr)
Government energy-efficiency mandates +0.9% Europe, Asia-Pacific Long-term (≥4 yr)
Autonomous delivery technology commercialization +0.8% North America, China Long-term (≥4 yr)
Scope 3 emissions reduction pressure +0.7% Global Long-term (≥4 yr)
Micro-fulfillment center proliferation +0.6% North America, Europe Short-term (≤2 yr)


E-Commerce Parcel Volume Explosion

Global B2C parcel volumes reached 128 billion shipments in 2025, a 9.4% year-over-year increase that strained existing manual fulfillment networks [5]. Amazon alone added 14 new robotics-enabled fulfillment centers in 2024, each deploying 750+ autonomous mobile robots to sustain same-day delivery commitments. This parcel-density pressure is the single largest catalyst for automated warehouse systems investment, particularly in the Logistics Automation Market's goods-to-person and sortation segments, where throughput requirements now exceed what human pickers can sustain during peak periods.

Labor Scarcity and Wage Inflation

The U.S. Bureau of Labor Statistics reported a warehouse vacancy rate of 4.9% through Q3 2025, while average hourly wages for material handlers climbed 6.2% year-over-year to USD 21.45 [6]. In Germany, the Bundesagentur für Arbeit flagged logistics as one of 12 critical shortage occupations. These structural labor gaps make the payback period for robotic logistics solutions increasingly attractive — most goods-to-person systems now achieve ROI within 18–24 months, down from 36 months in 2021.

Private 5G and Edge-Connectivity Deployments

Enterprise spending on private 5G networks for industrial applications exceeded USD 4.8 billion in 2024, with logistics facilities accounting for roughly 22% of deployments [3]. Low-latency connectivity is essential for coordinating fleets of 200+ autonomous mobile robots operating simultaneously in a single warehouse. Deutsche Post DHL's Innovation Centers have demonstrated that 5G-connected supply chain automation reduces robot collision events by 68% compared to Wi-Fi-only setups, directly improving throughput density in the Logistics Automation Market's most demanding environments.

Government Energy-Efficiency Mandates

The EU's revised Energy Efficiency Directive (EED), effective December 2025, requires large logistics operators to conduct mandatory energy audits and implement efficiency improvements targeting a 11.7% reduction in final energy consumption by 2030 [2]. Automated warehouse systems consume 25–35% less energy per pick than equivalent manual operations, making them a compliance-friendly capital investment. Japan's Green Growth Strategy similarly earmarks ¥450 billion for logistics decarbonization through 2030, with freight automation platforms eligible for accelerated depreciation benefits.

Restraints Impact Analysis

Restraint ~% Impact on CAGR Geographic Relevance Impact Timeline
High upfront capital expenditure –1.1% Global (esp. SMEs) Short-term (≤2 yr)
Integration complexity with legacy WMS/TMS –0.8% North America, Europe Medium-term (2–4 yr)
Cybersecurity vulnerabilities in connected fleets –0.5% Global Long-term (≥4 yr)
Workforce reskilling gaps –0.4% Asia-Pacific, South America Medium-term (2–4 yr)
Regulatory fragmentation for autonomous vehicles –0.3% Europe, Asia-Pacific Long-term (≥4 yr)


High Upfront Capital Expenditure

A mid-sized automated warehouse systems installation — covering 50,000 sq. ft. with AS/RS, conveyor loops, and AMR integration — typically requires USD 8–15 million in upfront capital [15]. For small and mid-sized third-party logistics providers operating on 3–5% net margins, this represents a significant barrier. Robotics-as-a-Service (RaaS) models are beginning to address this constraint in the Logistics Automation Market, but RaaS penetration remains below 12% of total deployments as of 2025, limiting the pace at which cost-sensitive operators can adopt supply chain automation.

Integration Complexity with Legacy Systems

Over 60% of North American warehouses still run on WMS platforms deployed before 2018, and integrating modern robotic logistics solutions into these environments requires 6–12 months of middleware development and testing [16]. API incompatibilities between legacy ERP systems and newer freight automation platforms create data-synchronization bottlenecks that delay go-live timelines. This integration drag is particularly acute in the Logistics Automation Market's brownfield segment, where operators must balance modernization against uninterrupted order fulfillment.

Cybersecurity Vulnerabilities

Connected logistics fleets — spanning AMRs, autonomous trucks, and IoT-enabled conveyor systems — present an expanding attack surface. A 2024 Dragos report identified a 37% year-over-year increase in OT-targeted ransomware attacks against logistics facilities [17]. Freight automation platforms handling real-time routing data are especially vulnerable, as a single breach can paralyze fleet coordination across multiple distribution nodes in the Logistics Automation Market.

物流自動化市場 機会

Robotics-as-a-Service (RaaS) for SME Logistics Providers

The RaaS concept – where operators lease robotic logistics systems on a per-pick or per-hour basis – removes the up-front barrier of USD 8–15 million that limits SME adoption With over 180,000 third-party logistics providers globally operating facilities smaller than 100,000 square feet, the addressable opportunity in the Logistics Automation Market for RaaS could be greater than USD 12 billion by 2030 [15].

Autonomous Middle-Mile Freight Corridors

Autonomous delivery technology is moving from last-mile trials onto dedicated middle-mile highway routes. The U.S. DOT’s AV 4.0 framework permits autonomous trucking along approved interstate routes, and TuSimple’s autonomous freight network racked up 2.1 million commercial miles by late 2024 [8]. Hybrid networks mixing autonomous middle-mile with traditional first/last-mile, and decreasing transit times by 18–22% Freight automation systems.

AI-Powered Demand Sensing and Predictive Fulfillment

Machine-learning algorithms are using point-of-sale data, weather patterns, and social-media sentiment to do predictive pre-positioning of goods, reducing out-of-stock events by 30–40% for early adopters. This supply chain automation capabilities turns warehouses from passive storage facilities into proactive distribution nodes, and is a high-margin software opportunity in the Logistics Automation Market

Emerging Market Warehouse Modernization

India’s National Logistics Policy aims to reduce logistics costs from 13% to 8% of GDP by 2030 and unlock an estimated USD 22 billion in warehousing infrastructure investment [9]. Cold-chain automated warehousing systems are also being adopted by Southeast Asian nations, with Vietnam and Indonesia investing in such systems to meet increasing food export quantities. These greenfield deployments are the quickest adoption curve of robotic logistics solutions globally

Data Monetization Through Digital-Twin Platforms

Digital-twin models of warehouse operations generate continuous streams of operational data — pick rates, robot utilization, energy consumption — that logistics operators can monetize through benchmarking services and insurance-premium optimization. Supply chain automation vendors offering embedded analytics dashboards are commanding 15–20% price premiums over hardware-only competitors in the Logistics Automation Market

物流自動化市場 今後の見通し

AI-Orchestrated Autonomous Operations

By 2030, an estimated 45% of tier-1 distribution centers will operate under AI-orchestrated workflow engines that dynamically allocate tasks between human workers, AMRs, and fixed automation. These systems will move the Logistics Automation Market beyond rule-based automation toward adaptive operations where robotic logistics solutions self-optimize pick paths, charging schedules, and labor deployment in real time. MRFR projects that AI-driven orchestration can improve warehouse throughput by 25–35% compared to traditional WCS-controlled environments.

Platform Economics and Interoperability Standards

The fragmentation of proprietary robot communication protocols is giving way to open interoperability standards — notably MassRobotics AMR Interop Standard and VDA 5050 in Europe — that allow operators to deploy multi-vendor fleets of automated warehouse systems without middleware lock-in [16]. This platform-economics shift will reshape competitive dynamics in the Logistics Automation Market, favoring software orchestration vendors over single-brand hardware suppliers and accelerating supply chain automation adoption among cost-sensitive mid-market operators.

Electrification and Sustainable Freight Networks

The International Energy Agency projects that electrified freight vehicles will constitute 18% of global medium-duty truck sales by 2030 [13]. Freight automation platforms are integrating battery-management and route-optimization algorithms that maximize electric-vehicle range while minimizing charging downtime. Combined with solar-powered distribution centers and regenerative-braking conveyors, these developments position the Logistics Automation Market as a critical enabler of Scope 3 emissions reduction across global supply chains.

Edge Computing and Digital-Twin Convergence

Edge computing deployments in logistics facilities are expected to grow at 28% CAGR through 2030, enabling real-time digital-twin simulations that mirror physical warehouse operations with sub-second latency [3]. These digital twins allow operators to simulate layout changes, test new autonomous delivery technology configurations, and predict equipment failures before they occur. MRFR anticipates that by 2032, over 60% of new automated warehouse system installations in the Logistics Automation Market will include embedded digital-twin capabilities as a standard feature.

Regional Market Share Analysis

Region Key Metric Primary Investment Themes
North America 37.02% share (2025) E-commerce fulfillment, autonomous delivery technology pilots
Europe USD 22.61 Billion (2025) Energy-efficiency compliance, cold-chain robotic logistics solutions
Asia-Pacific 8.75% CAGR (2026–2035) Greenfield mega-warehouses, freight automation platforms
South America USD 4.52 Billion (2025) Nearshoring-driven 3PL expansion, supply chain automation
Middle East & Africa 7.85% CAGR (2026–2035) Free-zone logistics hubs, last-mile automation
Total USD 86.95 Billion (2025) —

The Logistics Automation Market exhibits distinct regional investment patterns shaped by labor economics, regulatory environments, and e-commerce maturity. North America and Europe prioritize brownfield retrofits and supply chain automation software, while Asia-Pacific leads in greenfield deployments of automated warehouse systems. South America and MEA remain nascent but are accelerating, driven by nearshoring trends and government-led logistics modernization programs.


North America

Country Key Metric Key Driver
United States 78.4% of regional revenue Amazon/Walmart automated fulfillment arms race
Canada 8.15% CAGR (2026–2035) Cold-chain modernization for agri-food exports
Mexico USD 2.18 Billion (2025) Nearshoring-driven warehouse expansion along border corridors


North America's dominance in the Logistics Automation Market stems from the continent's hyper-competitive e-commerce landscape, where same-day and next-day delivery expectations force continuous investment in automated warehouse systems. The U.S. accounts for roughly 78% of regional revenue, with Walmart committing USD 2.3 billion to supply chain automation upgrades across its distribution network during 2024–2026 [6]. Canada is emerging as a secondary growth node, with the Canada Infrastructure Bank earmarking CAD 1.2 billion for cold-chain logistics modernization to support perishable agri-food exports.

Europe

Country Key Metric Key Driver
Germany 28.5% of regional revenue Industrie 4.0 warehouse digitization
United Kingdom 8.30% CAGR (2026–2035) Post-Brexit labor shortages accelerating robotic logistics solutions
France USD 3.42 Billion (2025) Government-subsidized cold-chain automation
Italy 7.90% CAGR (2026–2035) Fashion/apparel fulfillment upgrades
Spain USD 1.85 Billion (2025) Mediterranean fresh-produce logistics
Nordic Countries 8.45% CAGR (2026–2035) Sustainability-driven supply chain automation
Russia USD 1.28 Billion (2025) Domestic e-commerce platform expansion
Rest of Europe 7.65% CAGR (2026–2035) EU cohesion-fund warehouse grants


Europe's Logistics Automation Market is shaped by the dual pressures of energy-efficiency regulation and acute labor shortages, particularly in the UK and Germany. The EU's EED mandates are driving large-scale retrofits of existing distribution centers with energy-efficient automated warehouse systems, while the UK's post-Brexit immigration constraints have pushed warehouse automation adoption rates 15% above pre-2020 baselines [2]. Germany's Fraunhofer IML continues to anchor the region's innovation ecosystem for freight automation platforms and autonomous intralogistics.

Asia-Pacific

Country Key Metric Key Driver
China 42.3% of regional revenue Smart-logistics corridor investments by JD.com, Cainiao
India 9.10% CAGR (2026–2035) National Logistics Policy warehouse modernization
Japan USD 5.85 Billion (2025) Labor-shortage-driven automated warehouse systems adoption
South Korea 8.65% CAGR (2026–2035) Semiconductor and electronics supply chain automation
ASEAN USD 3.74 Billion (2025) Cold-chain expansion for food exports
Rest of Asia-Pacific 8.20% CAGR (2026–2035) Cross-border e-commerce fulfillment hubs


Asia-Pacific is the fastest-growing region in the Logistics Automation Market, underpinned by China's aggressive deployment of robotic logistics solutions across its top 50 logistics parks. JD Logistics operates 43 fully autonomous warehouses capable of processing 200,000 orders per day with fewer than 10 human operators per facility [10]. India's production-linked incentive (PLI) scheme for warehousing equipment, combined with the National Logistics Policy's cost-reduction targets, is catalyzing greenfield deployments of autonomous delivery technology and freight automation platforms.

South America

Country Key Metric Key Driver
Brazil 62.8% of regional revenue Mercado Libre fulfillment center expansion
Argentina 7.50% CAGR (2026–2035) Agricultural export logistics upgrades
Rest of South America USD 0.82 Billion (2025) Cross-border trade facilitation


South America's Logistics Automation Market is anchored by Brazil, where Mercado Libre's USD 1.7 billion logistics investment program is driving demand for sortation systems and supply chain automation software across São Paulo and Minas Gerais [20]. Argentina and Chile are secondary growth nodes, with agricultural exporters adopting automated warehouse systems to meet quality-traceability requirements from European and Asian buyers.

Middle East & Africa

Country Key Metric Key Driver
Saudi Arabia 31.5% of regional revenue Vision 2030 logistics hub development
UAE 8.25% CAGR (2026–2035) Dubai Logistics Corridor free-zone investments
South Africa USD 0.68 Billion (2025) Mining supply chain modernization
Egypt 7.45% CAGR (2026–2035) Suez Canal Economic Zone logistics automation
Rest of MEA USD 0.54 Billion (2025) Humanitarian logistics modernization


The Middle East & Africa Logistics Automation Market is concentrated in the Gulf Cooperation Council states, where Saudi Arabia's Vision 2030 and the UAE's Dubai Logistics Corridor initiative are channeling billions into robotic logistics solutions for free-zone distribution hubs [21]. Neom's planned logistics district alone envisions a fully autonomous freight automation platform network connecting industrial zones to Red Sea port facilities. South Africa represents the largest sub-Saharan opportunity, driven by mining-sector supply chain automation and Johannesburg's growing e-commerce fulfillment infrastructure.


Logistics Automation Market By Region, 2025-2035
 

物流自動化市場 市場セグメンテーション

By Function

Segment Key Metric Primary Demand Driver
Warehouse Automation 60.15% share (2025) E-commerce throughput requirements
Transportation Automation 8.58% CAGR (2026–2035) Freight automation platforms and autonomous trucking


The Logistics Automation Market's warehouse automation segment encompasses AS/RS, conveyor and sortation systems, goods-to-person robotics, and AMR fleets. This segment's dominance reflects the capital-intensive nature of automated warehouse systems, where a single mega-fulfillment center can represent USD 150–300 million in automation investment. E-commerce operators are the primary demand driver, deploying robotic logistics solutions to sustain sub-24-hour delivery commitments.

Transportation automation — covering autonomous delivery technology, fleet-management platforms, and load-optimization software — is the faster-growing function. Freight automation platforms are consolidating previously siloed TMS, route-planning, and carrier-matching capabilities into unified SaaS offerings, enabling shippers to orchestrate multimodal supply chain automation from a single interface.

By Automation Level

Segment Key Metric Primary Demand Driver
Semi-Automated Systems USD 56.73 Billion (2025) Brownfield retrofit economics
Fully-Automated Systems 8.62% CAGR (2026–2035) Greenfield mega-warehouse deployments


Semi-automated systems still dominate the Logistics Automation Market by installed base, as most existing facilities adopt incremental automation — adding AMR fleets or pick-to-light systems alongside manual processes. Fully-automated systems are gaining ground in greenfield deployments where operators can design facility layouts around automated warehouse systems from the outset, achieving 3–5x throughput density compared to semi-automated equivalents.

By Component

Segment Key Metric Primary Demand Driver
Hardware 65.47% share (2025) AMR, AS/RS, and conveyor installations
Software 8.67% CAGR (2026–2035) SaaS orchestration and supply chain automation platforms
Services USD 8.26 Billion (2025) System integration, maintenance, and consulting

Hardware retains the largest revenue share in the Logistics Automation Market due to the capital intensity of physical robotic logistics solutions. Software is closing the gap rapidly as operators recognize that the value of automated warehouse systems depends on the orchestration layer that coordinates them. Services — encompassing system integration, ongoing maintenance, and change-management consulting — represent a stable recurring revenue stream for vendors.

By End-User Industry

Segment Key Metric Primary Demand Driver
E-Commerce and Parcel 41.08% share (2025) Same-day delivery expectations
Food and Beverage USD 10.22 Billion (2025) Temperature-controlled supply chain automation
Grocery Retail 8.70% CAGR (2026–2035) Micro-fulfillment center deployment
Apparel and Fashion USD 6.52 Billion (2025) Returns processing automation
Manufacturing 7.85% CAGR (2026–2035) Just-in-time inbound logistics
Others USD 5.38 Billion (2025) Healthcare, aerospace, and specialty logistics

E-commerce and parcel operations remain the dominant end-user vertical in the Logistics Automation Market, with Amazon, JD.com, and Cainiao collectively operating over 200 facilities deploying advanced robotic logistics solutions [5]. Grocery retail is the fastest-growing end-user segment, as quick-commerce operators install compact micro-fulfillment centers — typically 8,000–15,000 sq. ft. — inside or adjacent to existing stores to enable autonomous delivery technology for 15-minute grocery delivery.

Competitive Benchmarking

The Logistics Automation Market exhibits medium concentration, with the top five players accounting for an estimated 32–38% of global revenue. The competitive field spans industrial-automation conglomerates, pure-play robotics firms, and logistics-technology platform companies. Pure-play robotics vendors are gaining share by offering modular, rapidly deployable automated warehouse systems that satisfy 18–24 month ROI hurdles. Strategic M&A activity has accelerated, with established players acquiring niche freight automation platforms and autonomous delivery technology startups to fill portfolio gaps.

Company Est. Revenue Share Range Key Offerings for Logistics Automation Market Strategic Positioning
Dematic (KION Group) ~7–10% AS/RS, conveyor systems, software orchestration Full-stack automated warehouse systems integrator
Honeywell Intelligrated ~6–9% Sortation, robotics, warehouse execution software Diversified industrial with supply chain automation focus
KNAPP AG ~4–6% Shuttle systems, pocket sorters, OSR Shuttle Evo Pharmacy and healthcare logistics specialist
Daifuku Co., Ltd. ~5–8% Airport baggage, automotive, e-commerce fulfillment Global leader in material-handling robotic logistics solutions
SSI SCHÄFER ~4–6% Modular racking, shuttle systems, software Configurable automated warehouse systems for mid-market
Swisslog (KUKA) ~3–5% AutoStore integration, SynQ software Robotics-native freight automation platforms partner
TGW Logistics Group ~3–5% High-performance shuttle, FlashPick system Fashion and grocery vertical specialist
Locus Robotics ~2–4% Autonomous mobile robots (AMRs) RaaS pioneer for supply chain automation
Blue Yonder (Panasonic) ~3–5% AI-driven WMS, demand sensing, control tower Software-first autonomous delivery technology orchestration
Geek+ ~2–4% Goods-to-person robots, sorting systems Asia-Pacific robotic logistics solutions leader

Recent News & Developments

  • Dematic (KION Group) (March 2025): Opened a USD 180 million automated micro-fulfillment production facility in Grand Rapids, Michigan, targeting quick-commerce supply chain automation demand [22].
  • Honeywell Intelligrated (October 2025): buys a cloud-native warehouse-execution-software company, increasing the company’s ability to operate heterogenous robot fleets.
  • Blue Yonder (August 2024): Partnered with Microsoft Azure to launch a generative-AI-powered control tower for real-time autonomous delivery technology decision support in the Logistics Automation Market.
 

物流自動化市場 レポートの範囲


物流自動化市場 Market Report Scope

パラメータ 詳細
市場範囲 グローバル物流自動化市場 — 倉庫および輸送機能におけるハードウェア、ソフトウェア、サービス
調査期間 2021–2035
CAGR(予測期間) 8.55%(2026–2035)
市場規模(2025年) 869.5億米ドル
市場規模(2035年) 1826.4億米ドル
最も成長が早いセグメント 食料品小売(エンドユーザー);完全自動化システム(自動化レベル)
プロファイル企業 10社(デマティック、ハネウェルインテリグレーテッド、ナップ、ダイフク、SSIシェーファー、スイスログ、TGW、ローカスロボティクス、ブルー・ヨンダー、ギーク+)
評価通貨 米ドル(十億)

よくある質問

中規模の3PLがフル倉庫自動化導入から期待すべきROIのタイムラインは?
50,000〜100,000平方フィートの範囲で自動倉庫システムを導入する中規模の3PLは、2交代制の運用と1日あたり15,000ユニット以上のパーセル量を前提に、20〜28ヶ月以内に全額回収を達成します[15]。RaaSモデルは、初期資本を排除することでこれを12ヶ月に短縮できます。
物流自動化市場はCSRDの下でのスコープ3排出量報告にどのように対処していますか?
自動化システムは、CSRD準拠のスコープ3計算に直接フィードされる監査可能なエネルギー消費とスループットデータを生成します[13]。この組み込みのトレーサビリティは、手動データ収集コストを40〜55%削減します。
ブラウンフィールド倉庫に最も早く導入できるロボット物流ソリューションはどれですか?
自律移動ロボットは固定インフラを必要とせず、AS/RSの改修に対して4〜8週間での導入が可能です[4]。人に物を運ぶAMR艦隊は、物流自動化市場におけるブラウンフィールドの優先エントリーポイントです。
VDA 5050のような相互運用性基準は、物流自動化市場におけるベンダー選定にどのように影響しますか?
VDA 5050は、複数のベンダーのAMR艦隊が単一のオーケストレーションレイヤーの下で運用できるようにし、ベンダーロックインリスクを低減します[16]。購入者は、VDA 5050またはMassRoboticsの認証を受けたベンダーを優先すべきです。
接続された貨物自動化プラットフォームに推奨されるサイバーセキュリティフレームワークは何ですか?
IEC 62443は、ネットワークセグメンテーション、デバイス認証、インシデントレスポンスをカバーする物流施設向けの主要なOTサイバーセキュリティ基準です[17]。オペレーターは、SaaSベンダーからSOC 2タイプIIの認証を義務付けるべきです。
物流自動化市場は冷蔵チェーンの製薬物流にどのように進化していますか?
±0.5°Cの精度を維持する温度管理されたAS/RSシステムが手動の冷蔵保管を置き換え、製薬流通業者の廃棄損失を25〜30%削減しています。GDP準拠の自動化は、年間約9%の成長を遂げています。
新興市場におけるサプライチェーン自動化プロジェクトのためにどのような資金調達構造が利用可能ですか?
IFCやADBを含む多国間開発銀行は、適格国の自動化プロジェクトに対して3〜5%の金利で優遇物流インフラローンを提供しています[9]。公共助成金と民間のRaaS契約を組み合わせたブレンドファイナンス構造が物流自動化市場で注目を集めています。
著者
著者 Author Profile Ankit Gupta LinkedIn Team Lead - Research
Ankit Gupta is a seasoned market intelligence and strategic research professional with over six plus years of experience in the ICT and Semiconductor industries. With academic roots in Telecom, Marketing, and Electronics, he blends technical insight with business strategy. Ankit has led 200+ projects, including work for Fortune 500 clients like Microsoft and Rio Tinto, covering market sizing, tech forecasting, and go-to-market strategies. Known for bridging engineering and enterprise decision-making, his insights support growth, innovation, and investment planning across diverse technology markets.
無料サンプルをダウンロード

このレポートの無料サンプルを受け取るには、以下のフォームにご記入ください

Download PDF ×

We do not share your information with anyone. However, we may send you emails based on your report interest from time to time. You may contact us at any time to opt-out.

















