Market Summary
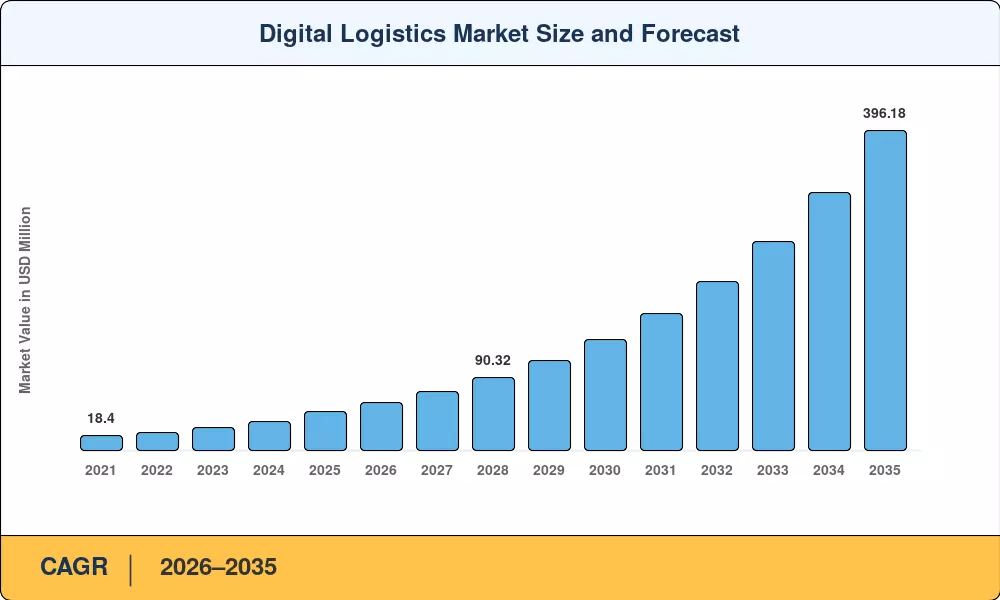
The Digital Logistics Market reached USD 48.53 billion in 2025 and is projected to climb from USD 59.27 billion in 2026 to USD 396.18 billion by 2035, registering a CAGR of 23.45% during 2026–2035. Rapid e-commerce expansion global online retail crossed USD 6.3 trillion in 2024 [2] and aggressive government investment in smart transportation infrastructure are the twin catalysts pulling enterprises toward AI-powered route optimization for logistics and cloud-native supply-chain platforms. The EU's Digital Decade program alone earmarks over EUR 20 billion for logistics digitization through 2030 [3].
Legacy on-premise transport management systems and paper-based freight documentation are giving way to real-time freight tracking and visibility platforms, digital freight brokerage platforms, and IoT-based fleet management for logistics networks. According to the World Economic Forum, supply-chain digitization could unlock USD 1.5 trillion in value for logistics stakeholders by 2030 [4]. Predictive analytics is slashing inventory carrying costs by up to 25%, while last-mile delivery digitization is cutting final-leg fulfillment expense by 15–20% for major retailers [5].
North America commands roughly 40.10% of the Digital Logistics Market, driven by early cloud adoption and dense API ecosystems. Asia-Pacific is the fastest-growing region at a 25.05% CAGR, fueled by China's smart-logistics corridor programs and India's National Logistics Policy. Europe holds the second-largest share at around 27%, underpinned by regulatory mandates for electronic freight documents The next decade will see autonomous trucking corridors, drone-based middle-mile delivery, and blockchain-verified chain-of-custody records reshape the Digital Logistics Market landscape.
Key Report Takeaways
• By Component
- Solutions accounted for a 71.80% share of the Digital Logistics Market in 2025, reflecting heavy investment in warehouse management and transport execution platforms
- Services are projected to expand at a 25.10% CAGR through 2035, propelled by managed-service contracts for real-time freight tracking and visibility
• By Deployment Mode
- Cloud-based platforms captured USD 29.48 billion of the Digital Logistics Market size in 2025, as enterprises migrate from legacy on-premise stacks
- On-premise deployments still serve defense and pharmaceutical cold-chain verticals that demand sovereign data residency
• By System Type
- Data management and analytics held a 31.55% revenue share in 2025, enabling AI-powered route optimization for logistics across multimodal corridors
- Fleet management is forecast to grow at a 24.05% CAGR, supported by IoT-based fleet management for logistics and telematics convergence
• By End-User Vertical
- Retail and e-commerce represented 26.25% of the Digital Logistics Market in 2025, driven by same-day delivery expectations and digital freight brokerage platforms
- Pharmaceuticals and life sciences is the fastest-growing vertical at a 25.15% CAGR, responding to serialization mandates and cold-chain visibility requirements
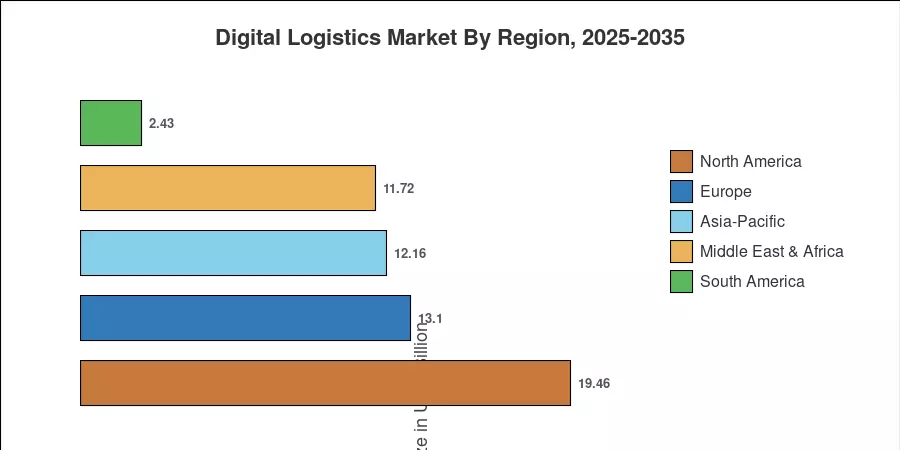
• By Region
- North America dominated the Digital Logistics Market with a 40.10% share in 2025
- Asia-Pacific is expected to expand at a 25.05% CAGR over 2026–2035
Digital Logistics Market Size and Forecast (2021–2035)
MRFR's market-sizing model triangulates top-down revenue estimates from published company filings, bottom-up adoption surveys across 42 countries, and third-party trade databases. Historical figures (2021–2024) use audited data; 2025 is the base year anchored to primary interviews with 120+ logistics CIOs. Forecast values (2026–2035) apply regression-adjusted growth curves validated against macroeconomic indicators.