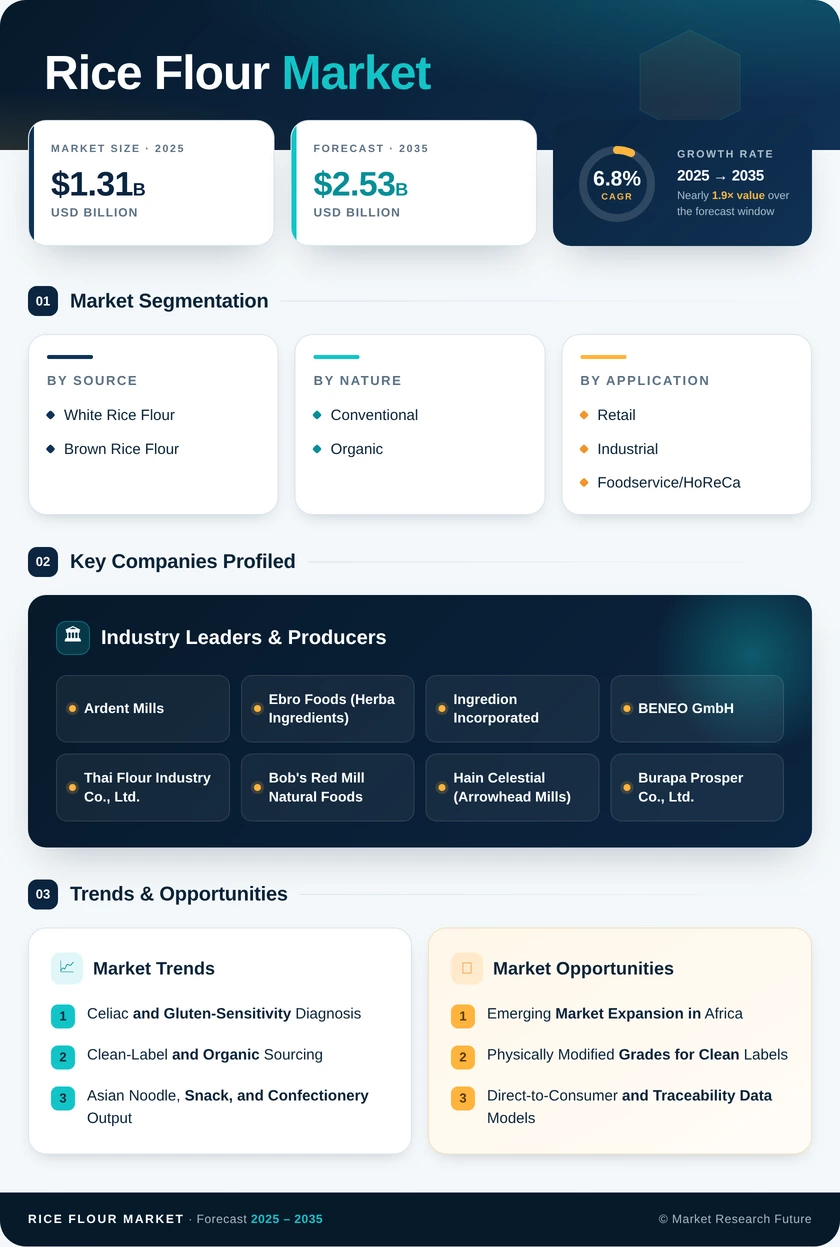
Rice Flour Market (2026 - 2035)

ID: MRFR/FnB/5976-HCR 90 Pages Snehal Singh Last Updated: October 24, 2026
Rice Flour Market Size, Share, Industry Trend & Analysis Research Report Information By Source (White Rice Flour, Brown Rice Flour), By Nature (Conventional, Organic), By End Use (Retail, Industrial, Foodservice/HoReCa), By Region (North America, Europe, Asia-Pacific, South America, Middle East & Africa) - Global Forecast till 2035
Rice Flour Market
Market Size
Forecast Period2026-2035
CAGR (2026-2035)6.8%
2025 Market SizeUSD 1.31 Billion
2035 Market SizeUSD 2.53 Billion
Key Players
Ardent Mills
Ebro Foods
Ingredion Incorporated
BENEO GmbH
Thai Flour Industry Co., Ltd.
Bob's Red Mill Natural Foods
Opportunities
  • Emerging Market Expansion in Africa
  • Physically Modified Grades for Clean Labels
  • Direct-to-Consumer and Traceability Data Models
  1. 1 Market Summary | |
  2. 2 Key Report Takeaways | |
    1. 2.1 By Source | |
    2. 2.2 By Nature | |
    3. 2.3 By End Use | |
    4. 2.4 By Region | |
  3. 3 Market Size and Forecast (2021–2035) | |
    1. 3.1 Historical Market Size (2021–2025) | |
    2. 3.2 Forecast Market Size (2026–2035) | |
    3. 3.3 Year-over-Year Growth Analysis | |
  4. 4 Driver Impact Analysis | |
    1. 4.1 Celiac and Gluten-Sensitivity Diagnosis | |
    2. 4.2 Clean-Label and Organic Sourcing | |
    3. 4.3 Asian Noodle, Snack, and Confectionery Output | |
    4. 4.4 Retail Home Baking and E-commerce | |
    5. 4.5 Functional Flour Replacing Modified Starch | |
    6. 4.6 Rice Trade Normalization | |
  5. 5 Restraints Impact Analysis | |
    1. 5.1 Inorganic Arsenic and Contaminant Limits | |
    2. 5.2 Rice Price and Export Policy Volatility | |
    3. 5.3 Functional Gaps Versus Gluten-Containing Flours | |
    4. 5.4 Shelf-Life Limits of Brown Rice Flour | |
    5. 5.5 Organic Certification Cost and Supply Constraints | |
  6. 6 Opportunities | |
    1. 6.1 Emerging Market Expansion in Africa | |
    2. 6.2 Physically Modified Grades for Clean Labels | |
    3. 6.3 Direct-to-Consumer and Traceability Data Models | |
    4. 6.4 Sprouted and Brown Rice Premiumization | |
    5. 6.5 Plant-Based Dairy and Infant Nutrition | |
  7. 7 Regional Market Share and Country-Level Analysis | |
    1. 7.1 North America | | |
      1. 7.1.1 US | | |
      2. 7.1.2 Canada | | |
      3. 7.1.3 Mexico | |
    2. 7.2 Europe | | |
      1. 7.2.1 Germany | | |
      2. 7.2.2 UK | | |
      3. 7.2.3 France | | |
      4. 7.2.4 Italy | | |
      5. 7.2.5 Spain | | |
      6. 7.2.6 Nordic Countries | | |
      7. 7.2.7 Russia | | |
      8. 7.2.8 Rest of Europe | |
    3. 7.3 Asia-Pacific | | |
      1. 7.3.1 China | | |
      2. 7.3.2 India | | |
      3. 7.3.3 Japan | | |
      4. 7.3.4 South Korea | | |
      5. 7.3.5 ASEAN | | |
      6. 7.3.6 Rest of Asia-Pacific | |
    4. 7.4 South America | | |
      1. 7.4.1 Brazil | | |
      2. 7.4.2 Argentina | | |
      3. 7.4.3 Rest of South America | |
    5. 7.5 Middle East & Africa | | |
      1. 7.5.1 Saudi Arabia | | |
      2. 7.5.2 UAE | | |
      3. 7.5.3 South Africa | | |
      4. 7.5.4 Egypt | | |
      5. 7.5.5 Rest of Middle East & Africa | |
  8. 8 Future Outlook (2026–2035) | |
    1. 8.1 Processing Technology and Functional Grades | |
    2. 8.2 Climate Resilience and Supply Diversification | |
    3. 8.3 Retail Channel and Private-Label Growth | |
    4. 8.4 Sustainability and Traceability Reporting | |
  9. 9 Segmentation Analysis | |
    1. 9.1 By Source | | |
      1. 9.1.1 White Rice Flour | | |
      2. 9.1.2 Brown Rice Flour | |
    2. 9.2 By Nature | | |
      1. 9.2.1 Conventional | | |
      2. 9.2.2 Organic | |
    3. 9.3 By End Use | | |
      1. 9.3.1 Retail | | |
      2. 9.3.2 Industrial | | |
      3. 9.3.3 Foodservice/HoReCa | |
  10. 10 Competitive Landscape | |
    1. 10.1 Market Concentration Analysis | |
    2. 10.2 Competitive Benchmarking Matrix | |
    3. 10.3 Company Profiles | | |
      1. 10.3.1 Ardent Mills | | |
      2. 10.3.2 Ebro Foods (Herba Ingredients) | | |
      3. 10.3.3 Ingredion Incorporated | | |
      4. 10.3.4 BENEO GmbH | | |
      5. 10.3.5 Thai Flour Industry Co., Ltd. | | |
      6. 10.3.6 Bob's Red Mill Natural Foods | | |
      7. 10.3.7 Hain Celestial (Arrowhead Mills) | | |
      8. 10.3.8 Burapa Prosper Co., Ltd. | | |
      9. 10.3.9 Cho Heng Rice Vermicelli Factory (Erawan) | | |
      10. 10.3.10 Koda Farms | | |
      11. 10.3.11 Shiloh Farms | |
  11. 11 Recent News & Developments | |
  12. 12 Report Scope and Methodology | |
  13. 13 Detailed Sources and Citations | |
  14. 14 Frequently Asked Questions (FAQs) | | LIST OF TABLES | |
  15. TABLE 1 Global Rice Flour Market Summary Snapshot, 2025–2035 | |
  16. TABLE 2 Global Rice Flour Market Size & Forecast, by Revenue (USD Billion), 2021–2035 | |
  17. TABLE 3 Driver Impact Analysis – Global Rice Flour Market | |
  18. TABLE 4 Restraints Impact Analysis – Global Rice Flour Market | |
  19. TABLE 5 Global Rice Flour Market, by Region, 2025 (Regional Summary) | |
  20. TABLE 6 North America Rice Flour Market, by Country, 2025 | |
  21. TABLE 7 Europe Rice Flour Market, by Country, 2025 | |
  22. TABLE 8 Asia-Pacific Rice Flour Market, by Country, 2025 | |
  23. TABLE 9 South America Rice Flour Market, by Country, 2025 | |
  24. TABLE 10 Middle East & Africa Rice Flour Market, by Country, 2025 | |
  25. TABLE 11 Global Rice Flour Market, by Source, 2025 | |
  26. TABLE 12 Global Rice Flour Market, by Nature, 2025 | |
  27. TABLE 13 Global Rice Flour Market, by End Use, 2025 | |
  28. TABLE 14 Competitive Benchmarking Matrix – Global Rice Flour Market | |
  29. TABLE 15 Report Scope and Methodology | |
  30. TABLE 16 Detailed Sources and Citations | |
  31. TABLE 17 Segmentation Quick Reference | | LIST OF FIGURES | |
  32. FIGURE 1 Global Rice Flour Market Dynamics – Drivers, Restraints, Opportunities | |
  33. FIGURE 2 Rice Flour Industry Value Chain Analysis | |
  34. FIGURE 3 Porter's Five Forces Analysis – Global Rice Flour Market | |
  35. FIGURE 4 Global Rice Flour Market Size Trend (USD Billion), 2021–2035 | |
  36. FIGURE 5 Global Rice Flour Market Share, by Source, 2025 | |
  37. FIGURE 6 Global Rice Flour Market Share, by Nature, 2025 | |
  38. FIGURE 7 Global Rice Flour Market Share, by End Use, 2025 | |
  39. FIGURE 8 Global Rice Flour Market Share, by Region, 2025 | |
  40. FIGURE 9 Asia-Pacific Rice Flour Market Share, by Country, 2025 | |
  41. FIGURE 10 Competitive Landscape – Estimated Revenue Share Ranges of Key Players

Segmentation Quick Reference

DimensionSub-SegmentsDominant SegmentFastest Growing Segment
By SourceWhite Rice Flour, Brown Rice FlourWhite Rice Flour (74.8% share)Brown Rice Flour (7.5% CAGR)
By NatureConventional, OrganicConventional (81.2% share)Organic (8.0% CAGR)
By End UseRetail, Industrial, Foodservice/HoReCaIndustrial (51.6% share)Retail (7.7% CAGR)
By RegionNorth America, Europe, Asia-Pacific, South America, Middle East & AfricaAsia-Pacific (52.4% share)Asia-Pacific (52.4% share)

Market Segmentation Overview

By Source

Sub-SegmentKey Trend
White Rice FlourEnzyme-treated and fine-milled grades for instant and extruded foods
Brown Rice FlourStabilized and sprouted variants for whole-grain bakery and snacks

White Rice Flour leads because its high starch content, neutral flavor, and long shelf life fit extrusion and spray-drying lines used by noodle and instant-food makers. Brown Rice Flour grows fastest as bran stabilization and finer milling reduce rancidity and grittiness. Retained bran and germ give brown flour fiber and micronutrient claims that white flour cannot match, pulling it into premium bakery.

By Nature

Sub-SegmentKey Trend
ConventionalCost-led procurement for noodles, foodservice, and exports
OrganicCertified clean-label lines in premium retail and specialty bakery

Conventional flour leads on price and supply reliability, serving high-volume industrial buyers that compete on cost per kilogram. Organic flour grows fastest as retailers expand certified ranges and shoppers pay premiums for traceability. Growth is capped by paddy conversion periods and audit costs under USDA, EU, and NPOP schemes, which keep organic supply tighter than demand.

By End Use

Sub-SegmentKey Trend
RetailGluten-free baking mixes and direct-to-consumer online sales
IndustrialBulk supply to noodle, snack, bakery, and processed food makers
Foodservice/HoReCaAllergen-safe menus and Asian cuisine in restaurants and institutions

Industrial use leads because noodle, snack, and bakery manufacturers buy in bulk under long-term contracts and value rice flour's neutral, gluten-free functionality. Retail grows fastest as home bakers and celiac households buy single-ingredient flours and mixes online. Foodservice/HoReCa sits between the two, driven by restaurants and institutional kitchens that need allergen-safe batters and doughs.


Download PDF ×

We do not share your information with anyone. However, we may send you emails based on your report interest from time to time. You may contact us at any time to opt-out.