ID: MRFR/F-B & N/1275-HCR | August 2022 | Region: Global | 110 Pages
TABLE OF CONTENTS
1 EXECUTIVE SUMMARY
2 SCOPE OF THE REPORT
2.1 MARKET DEFINITION
2.2 SCOPE OF THE STUDY
2.2.1 RESEARCH OBJECTIVES
2.2.2 ASSUMPTIONS & LIMITATIONS
2.3 MARKETS STRUCTURE
3 MARKET RESEARCH METHODOLOGY
3.1 RESEARCH FUNCTION
3.2 SECONDARY RESEARCH
3.3 PRIMARY RESEARCH
3.4 FORECAST MODEL
4 MARKET LANDSCAPE
4.1 SUPPLY CHAIN ANALYSIS
4.1.1 RAW MATERIAL SUPPLIERS
4.1.2 MANUFACTURERS/PRODUCERS
4.1.3 DISTRIBUTORS/RETAILERS/WHOLESALERS/E-COMMERCE
4.1.4 END-USERS
4.2 PORTERβS FIVE FORCES ANALYSIS
4.2.1 THREAT OF NEW ENTRANTS
4.2.2 BARGAINING POWER OF BUYERS
4.2.3 BARGAINING POWER OF SUPPLIERS
4.2.4 THREAT OF SUBSTITUTES
4.2.5 INTENSITY OF COMPETITIVE RIVALRY
5 MARKET DYNAMICS OF GLOBAL FUNCTIONAL FLOUR MARKET
5.1 INTRODUCTION
5.2 DRIVERS
5.3 RESTRAINTS
5.4 OPPORTUNITIES
5.5 CHALLENGES
5.6 TRENDS/FORMS
6. GLOBAL FUNCTIONAL FLOUR MARKET, BY SOURCE
6.1 INTRODUCTION
6.2 WHEAT
6.2.1 MARKET ESTIMATES & FORECAST, 2020β2027
6.2.2 MARKET ESTIMATES & FORECAST, BY REGION, 2020β2027
6.3 CORN
6.3.1 MARKET ESTIMATES & FORECAST, 2020β2027
6.3.2 MARKET ESTIMATES & FORECAST, BY REGION, 2020β2027
6.4 RICE
6.4.1 MARKET ESTIMATES & FORECAST, 2020β2027
6.4.2 MARKET ESTIMATES & FORECAST, BY REGION, 2020β2027
6.5 RYE
6.5.1 MARKET ESTIMATES & FORECAST, 2020β2027
6.5.2 MARKET ESTIMATES & FORECAST, BY REGION, 2020β2027
6.6 PEANUT
6.6.1 MARKET ESTIMATES & FORECAST, 2020β2027
6.6.2 MARKET ESTIMATES & FORECAST, BY REGION, 2020β2027
6.7 SPROUTS
6.7.1 MARKET ESTIMATES & FORECAST, 2020β2027
6.7.2 MARKET ESTIMATES & FORECAST, BY REGION, 2020β2027
6.8 TAPIOCA
6.8.1 MARKET ESTIMATES & FORECAST, 2020β2027
6.8.2 MARKET ESTIMATES & FORECAST, BY REGION, 2020β2027
6.9 OTHERS
6.9.1 MARKET ESTIMATES & FORECAST, 2020β2027
6.9.2 MARKET ESTIMATES & FORECAST, BY REGION, 2020β2027
7. GLOBAL FUNCTIONAL FLOUR MARKET, BY CLAIM
7.1 INTRODUCTION
7.2 GLUTEN FREE
7.2.1 MARKET ESTIMATES & FORECAST, 2020β2027
7.2.2 MARKET ESTIMATES & FORECAST, BY REGION, 2020β2027
7.3 ORGANIC
7.3.1 MARKET ESTIMATES & FORECAST, 2020β2027
7.3.2 MARKET ESTIMATES & FORECAST, BY REGION, 2020β2027
7.4 PRE- GELATINIZED
7.4.1 MARKET ESTIMATES & FORECAST, 2020β2027
7.4.2 MARKET ESTIMATES & FORECAST, BY REGION, 2020β2027
7.5 OTHERS
7.5.1 MARKET ESTIMATES & FORECAST, 2020β2027
7.5.2 MARKET ESTIMATES & FORECAST, BY REGION, 2020β2027
8. GLOBAL FUNCTIONAL FLOUR MARKET, BY DISTRIBUTION CHANNEL
8.1 INTRODUCTION
8.1.1 STORE BASED
8.1.1.1 SUPERMARKETS/HYPERMARKETS
8.1.1.1.1 MARKET ESTIMATES & FORECAST, 2020-2027
8.1.1.1.2 MARKET ESTIMATES & FORECAST, BY REGION, 2020β2027
8.1.1.2 CONVENIENCE STORES
8.1.1.2.1 MARKET ESTIMATES & FORECAST, 2020-2027
8.1.1.2.2 MARKET ESTIMATES & FORECAST, BY REGION, 2020β2027
8.1.1.3 SPECIALTY STORES
8.1.1.3.1 MARKET ESTIMATES & FORECAST, 2020-2027
8.1.1.3.2 MARKET ESTIMATES & FORECAST, BY REGION, 2020β2027
8.1.1.4 OTHERS
8.1.1.4.1 MARKET ESTIMATES & FORECAST, 2020-2027
8.1.1.4.2 MARKET ESTIMATES & FORECAST, BY REGION, 2020β2027
8.1.2 NON-STORE BASED
8.1.2.1 MARKET ESTIMATES & FORECAST, 2020-2027
8.1.2.2 MARKET ESTIMATES & FORECAST, BY REGION, 2020β2027
9. GLOBAL FUNCTIONAL FLOUR MARKET, BY REGION
9.1 INTRODUCTION
9.2 NORTH AMERICA
9.2.1 MARKET ESTIMATES & FORECAST, 2020β2027
9.2.2 MARKET ESTIMATES & FORECAST, BY SOURCE, 2020β2027
9.2.3 MARKET ESTIMATES & FORECAST, BY CLAIM, 2020β2027
9.2.4 MARKET ESTIMATES & FORECAST, BY DISTRIBUTION CHANNEL, 2020β2027
9.2.5 U.S.
9.2.5.1 MARKET ESTIMATES & FORECAST, 2020β2027
9.2.5.2 MARKET ESTIMATES & FORECAST, BY SOURCE, 2020β2027
9.2.5.3 MARKET ESTIMATES & FORECAST, BY CLAIM, 2020β2027
9.2.5.4 MARKET ESTIMATES & FORECAST, BY DISTRIBUTION CHANNEL, 2020β2027
9.2.6 CANADA
9.2.6.1 MARKET ESTIMATES & FORECAST, 2020β2027
9.2.6.2 MARKET ESTIMATES & FORECAST, BY SOURCE, 2020β2027
9.2.6.3 MARKET ESTIMATES & FORECAST, BY CLAIM, 2020β2027
9.2.6.4 MARKET ESTIMATES & FORECAST, BY DISTRIBUTION CHANNEL, 2020β2027
9.3 EUROPE
9.3.1 MARKET ESTIMATES & FORECAST, 2020β2027
9.3.2 MARKET ESTIMATES & FORECAST, BY SOURCE, 2020β2027
9.3.3 MARKET ESTIMATES & FORECAST, BY CLAIM, 2020β2027
9.3.4 MARKET ESTIMATES & FORECAST, BY DISTRIBUTION CHANNEL, 2020β2027
9.3.5 GERMANY
9.3.5.1 MARKET ESTIMATES & FORECAST, 2020β2027
9.3.5.2 MARKET ESTIMATES & FORECAST, BY SOURCE, 2020β2027
9.3.5.3 MARKET ESTIMATES & FORECAST, BY CLAIM, 2020β2027
9.3.5.4 MARKET ESTIMATES & FORECAST, BY DISTRIBUTION CHANNEL, 2020β2027
9.3.6 FRANCE
9.3.6.1 MARKET ESTIMATES & FORECAST, 2020β2027
9.3.6.2 MARKET ESTIMATES & FORECAST, BY SOURCE, 2020β2027
9.3.6.3 MARKET ESTIMATES & FORECAST, BY CLAIM, 2020β2027
9.3.6.4 MARKET ESTIMATES & FORECAST, BY DISTRIBUTION CHANNEL, 2020β2027
9.3.7 ITALY
9.3.7.1 MARKET ESTIMATES & FORECAST, 2020β2027
9.3.7.2 MARKET ESTIMATES & FORECAST, BY SOURCE, 2020β2027
9.3.7.3 MARKET ESTIMATES & FORECAST, BY CLAIM, 2020β2027
9.3.7.4 MARKET ESTIMATES & FORECAST, BY DISTRIBUTION CHANNEL, 2020β2027
9.3.8 SPAIN
9.3.8.1 MARKET ESTIMATES & FORECAST, 2020β2027
9.3.8.2 MARKET ESTIMATES & FORECAST, BY SOURCE, 2020β2027
9.3.8.3 MARKET ESTIMATES & FORECAST, BY CLAIM, 2020β2027
9.3.8.4 MARKET ESTIMATES & FORECAST, BY DISTRIBUTION CHANNEL, 2020β2027
9.3.9 U.K.
9.3.9.1 MARKET ESTIMATES & FORECAST, 2020β2027
9.3.9.2 MARKET ESTIMATES & FORECAST, BY SOURCE, 2020β2027
9.3.9.3 MARKET ESTIMATES & FORECAST, BY CLAIM, 2020β2027
9.3.6.4 MARKET ESTIMATES & FORECAST, BY DISTRIBUTION CHANNEL, 2020β2027
9.3.10 RUSSIA
9.3.10.1 MARKET ESTIMATES & FORECAST, 2020β2027
9.3.10.2 MARKET ESTIMATES & FORECAST, BY SOURCE, 2020β2027
9.3.10.3 MARKET ESTIMATES & FORECAST, BY CLAIM, 2020β2027
9.3.10.4 MARKET ESTIMATES & FORECAST, BY DISTRIBUTION CHANNEL, 2020β2027
9.3.11 POLAND
9.3.11.1 MARKET ESTIMATES & FORECAST, 2020β2027
9.3.11.2 MARKET ESTIMATES & FORECAST, BY SOURCE, 2020β2027
9.3.11.3 MARKET ESTIMATES & FORECAST, BY CLAIM, 2020β2027
9.3.11.4 MARKET ESTIMATES & FORECAST, BY DISTRIBUTION CHANNEL, 2020β2027
9.3.12 REST OF EUROPE
9.3.12.1 MARKET ESTIMATES & FORECAST, 2020β2027
9.3.12.2 MARKET ESTIMATES & FORECAST, BY SOURCE, 2020β2027
9.3.12.3 MARKET ESTIMATES & FORECAST, BY CLAIM, 2020β2027
9.3.12.4 MARKET ESTIMATES & FORECAST, BY DISTRIBUTION CHANNEL, 2020β2027
9.4 ASIA-PACIFIC
9.4.1 MARKET ESTIMATES & FORECAST, 2020β2027
9.4.2 MARKET ESTIMATES & FORECAST, BY SOURCE, 2020β2027
9.4.3 MARKET ESTIMATES & FORECAST, BY CLAIM, 2020β2027
9.4.4 MARKET ESTIMATES & FORECAST, BY DISTRIBUTION CHANNEL, 2020β2027
9.4.5 CHINA
9.4.5.1 MARKET ESTIMATES & FORECAST, 2020β2027
9.4.5.2 MARKET ESTIMATES & FORECAST, BY SOURCE, 2020β2027
9.4.5.3 MARKET ESTIMATES & FORECAST, BY CLAIM, 2020β2027
9.4.5.4 MARKET ESTIMATES & FORECAST, BY DISTRIBUTION CHANNEL, 2020β2027
9.4.6 INDIA
9.4.6.1 MARKET ESTIMATES & FORECAST, 2020β2027
9.4.6.2 MARKET ESTIMATES & FORECAST, BY SOURCE, 2020β2027
9.4.6.3 MARKET ESTIMATES & FORECAST, BY CLAIM, 2020β2027
9.4.6.4 MARKET ESTIMATES & FORECAST, BY DISTRIBUTION CHANNEL, 2020β2027
9.4.7 JAPAN
9.4.7.1 MARKET ESTIMATES & FORECAST, 2020β2027
9.4.7.2 MARKET ESTIMATES & FORECAST, BY SOURCE, 2020β2027
9.4.7.3 MARKET ESTIMATES & FORECAST, BY CLAIM, 2020β2027
9.4.7.4 MARKET ESTIMATES & FORECAST, BY DISTRIBUTION CHANNEL, 2020β2027
9.4.8 AUSTRALIA & NEW ZEALAND
9.4.8.1 MARKET ESTIMATES & FORECAST, 2020β2027
9.4.8.2 MARKET ESTIMATES & FORECAST, BY SOURCE, 2020β2027
9.4.8.3 MARKET ESTIMATES & FORECAST, BY CLAIM, 2020β2027
9.4.8.4 MARKET ESTIMATES & FORECAST, BY DISTRIBUTION CHANNEL, 2020β2027
9.4.9 REST OF ASIA-PACIFIC
9.4.9.1 MARKET ESTIMATES & FORECAST, 2020β2027
9.4.9.2 MARKET ESTIMATES & FORECAST, BY SOURCE, 2020β2027
9.4.9.3 MARKET ESTIMATES & FORECAST, BY CLAIM, 2020β2027
9.4.9.4 MARKET ESTIMATES & FORECAST, BY DISTRIBUTION CHANNEL, 2020β2027
9.5 MIDDLE EAST & AFRICA
9.5.1 MARKET ESTIMATES & FORECAST, 2020β2027
9.5.2 MARKET ESTIMATES & FORECAST, BY SOURCE, 2020β2027
9.5.3 MARKET ESTIMATES & FORECAST, BY CLAIM, 2020β2027
9.5.4 MARKET ESTIMATES & FORECAST, BY DISTRIBUTION CHANNEL, 2020β2027
9.5.5 GCC
9.5.5.1 MARKET ESTIMATES & FORECAST, 2020β2027
9.5.5.2 MARKET ESTIMATES & FORECAST, BY SOURCE, 2020β2027
9.5.5.3 MARKET ESTIMATES & FORECAST, BY CLAIM, 2020β2027
9.5.5.4 MARKET ESTIMATES & FORECAST, BY DISTRIBUTION CHANNEL, 2020β2027
9.5.6 ISRAEL
9.5.6.1 MARKET ESTIMATES & FORECAST, 2020β2027
9.5.6.2 MARKET ESTIMATES & FORECAST, BY SOURCE, 2020β2027
9.5.6.3 MARKET ESTIMATES & FORECAST, BY CLAIM, 2020β2027
9.5.6.4 MARKET ESTIMATES & FORECAST, BY DISTRIBUTION CHANNEL, 2020β2027
9.5.7 NORTH AFRICA
9.5.7.1 MARKET ESTIMATES & FORECAST, 2020β2027
9.5.7.2 MARKET ESTIMATES & FORECAST, BY SOURCE, 2020β2027
9.5.7.3 MARKET ESTIMATES & FORECAST, BY CLAIM, 2020β2027
9.5.7.4 MARKET ESTIMATES & FORECAST, BY DISTRIBUTION CHANNEL, 2020β2027
9.5.8 TURKEY
9.5.8.1 MARKET ESTIMATES & FORECAST, 2020β2027
9.5.8.2 MARKET ESTIMATES & FORECAST, BY SOURCE, 2020β2027
9.5.8.3 MARKET ESTIMATES & FORECAST, BY CLAIM, 2020β2027
9.5.8.4 MARKET ESTIMATES & FORECAST, BY DISTRIBUTION CHANNEL, 2020β2027
9.5.9 REST OF THE MIDDLE EAST & AFRICA
9.5.9.1 MARKET ESTIMATES & FORECAST, 2020β2027
9.5.9.2 MARKET ESTIMATES & FORECAST, BY SOURCE, 2020β2027
9.5.9.3 MARKET ESTIMATES & FORECAST, BY CLAIM, 2020β2027
9.5.9.4 MARKET ESTIMATES & FORECAST, BY DISTRIBUTION CHANNEL, 2020β2027
9.6 LATIN AMERICA
9.6.1 MARKET ESTIMATES & FORECAST, 2020β2027
9.6.2 MARKET ESTIMATES & FORECAST, BY SOURCE, 2020β2027
9.6.3 MARKET ESTIMATES & FORECAST, BY CLAIM, 2020β2027
9.6.4 MARKET ESTIMATES & FORECAST, BY DISTRIBUTION CHANNEL, 2020β2027
9.6.5 BRAZIL
9.6.5.1 MARKET ESTIMATES & FORECAST, 2020β2027
9.6.5.2 MARKET ESTIMATES & FORECAST, BY SOURCE, 2020β2027
9.6.5.3 MARKET ESTIMATES & FORECAST, BY CLAIM, 2020β2027
9.5.5.4 MARKET ESTIMATES & FORECAST, BY DISTRIBUTION CHANNEL, 2020β2027
9.6.6 MEXICO
9.6.6.1 MARKET ESTIMATES & FORECAST, 2020β2027
9.6.6.2 MARKET ESTIMATES & FORECAST, BY SOURCE, 2020β2027
9.6.6.3 MARKET ESTIMATES & FORECAST, BY CLAIM, 2020β2027
9.6.6.4 MARKET ESTIMATES & FORECAST, BY DISTRIBUTION CHANNEL, 2020β2027
9.6.7 ARGENTINA
9.6.7.1 MARKET ESTIMATES & FORECAST, 2020β2027
9.6.7.2 MARKET ESTIMATES & FORECAST, BY SOURCE, 2020β2027
9.6.7.3 MARKET ESTIMATES & FORECAST, BY CLAIM, 2020β2027
9.6.7.4 MARKET ESTIMATES & FORECAST, BY DISTRIBUTION CHANNEL, 2020β2027
9.6.8 REST OF LATIN AMERICA
9.6.8.1 MARKET ESTIMATES & FORECAST, 2020β2027
9.6.8.2 MARKET ESTIMATES & FORECAST, BY SOURCE, 2020β2027
9.6.8.3 MARKET ESTIMATES & FORECAST, BY CLAIM, 2020β2027
9.6.8.4 MARKET ESTIMATES & FORECAST, BY DISTRIBUTION CHANNEL, 2020β2027
10. COMPANY LANDSCAPE
10.1 INTRODUCTION
10.2 MARKET STRATEGY
10.3 KEY DEVELOPMENT ANALYSIS
(EXPANSIONS/MERGERS & ACQUISITIONS/JOINT VENTURES/NEW PRODUCT DEVELOPMENTS/AGREEMENTS/INVESTMENTS)
11. COMPANY PROFILES
11.1 CARGILL (U.S.)
11.1.1 COMPANY OVERVIEW
11.1.2 FINANCIAL UPDATES
11.1.3 PRODUCT/BUSINESS SEGMENT OVERVIEW
11.1.4 STRATEGY
11.1.5 KEY DEVELOPMENTS
11.1.6 SWOT ANALYSIS
11.2 ARCHER DANIELS MIDLAND COMPANY. (U.S.)
11.2.1 COMPANY OVERVIEW
11.2.2 FINANCIAL UPDATES
11.2.3 PRODUCT/BUSINESS SEGMENT OVERVIEW
11.2.4 STRATEGY
11.2.5 KEY DEVELOPMENTS
11.2.6 SWOT ANALYSIS
11.3 BUNGE LIMITED (U.S.)
11.3.1 COMPANY OVERVIEW
11.3.2 FINANCIAL UPDATES
11.3.3 PRODUCT/BUSINESS SEGMENT OVERVIEW
11.3.4 STRATEGY
11.3.5 KEY DEVELOPMENTS
11.3.6 SWOT ANALYSIS
11.4 ASSOCIATED BRITISH FOODS PLC. (U.K)
11.4.1 COMPANY OVERVIEW
11.4.2 FINANCIAL UPDATES
11.4.3 PRODUCT/BUSINESS SEGMENT OVERVIEW
11.4.4 STRATEGY
11.4.5 KEY DEVELOPMENTS
11.4.6 SWOT ANALYSIS
11.5 GENERAL MILLS, INC. (U.S.)
11.5.1 COMPANY OVERVIEW
11.5.2 FINANCIAL UPDATES
11.5.3 PRODUCT/BUSINESS SEGMENT OVERVIEW
11.5.4 STRATEGY
11.5.5 KEY DEVELOPMENTS
11.5.6 SWOT ANALYSIS
11.6 THE SCOULAR COMPANY (U.S.)
11.6.1 COMPANY OVERVIEW
11.6.2 FINANCIAL UPDATES
11.6.3 PRODUCT/BUSINESS SEGMENT OVERVIEW
11.6.4 STRATEGY
11.6.5 KEY DEVELOPMENTS
11.6.6 SWOT ANALYSIS
11.7 AGRANA BETEILIGUNGS-AG (AUSTRIA)
11.7.1 COMPANY OVERVIEW
11.7.2 FINANCIAL UPDATES
11.7.3 PRODUCT/BUSINESS SEGMENT OVERVIEW
11.7.4 STRATEGY
11.7.5 KEY DEVELOPMENTS
11.7.6 SWOT ANALYSIS
11.8 THE HAIN CELESTIAL GROUP INC. (U.S.)
11.8.1 COMPANY OVERVIEW
11.8.2 FINANCIAL UPDATES
11.8.3 PRODUCT/BUSINESS SEGMENT OVERVIEW
11.8.4 STRATEGY
11.8.5 KEY DEVELOPMENTS
11.8.6 SWOT ANALYSIS
11.9 SUNOPTA INC (CANADA)
11.9.1 COMPANY OVERVIEW
11.9.2 FINANCIAL UPDATES
11.9.3 PRODUCT/BUSINESS SEGMENT OVERVIEW
11.9.4 STRATEGY
11.9.5 KEY DEVELOPMENTS
11.9.6 SWOT ANALYSIS
11.10 PARRISH AND HEIMBECKER LIMITED (CANADA)
11.10.1 COMPANY OVERVIEW
11.10.2 FINANCIAL UPDATES
11.10.3 PRODUCT/BUSINESS SEGMENT OVERVIEW
11.10.4 STRATEGY
11.10.5 KEY DEVELOPMENTS
11.10.6 SWOT ANALYSIS
12. CONCLUSION
LIST OF TABLES
TABLE 1 GLOBAL FUNCTIONAL FLOUR MARKET, BY REGION, 2020β2027
TABLE 2 NORTH AMERICA: FUNCTIONAL FLOUR MARKET, BY COUNTRY, 2020β2027
TABLE 3 EUROPE: FUNCTIONAL FLOUR MARKET, BY COUNTRY, 2020β2027
TABLE 4 ASIA-PACIFIC: FUNCTIONAL FLOUR MARKET, BY COUNTRY, 2020β2027
TABLE 5 MIDDLE EAST & AFRICA: FUNCTIONAL FLOUR MARKET, BY COUNTRY, 2020β2027
TABLE 6 LATIN AMERICA: FUNCTIONAL FLOUR MARKET, BY COUNTRY, 2020β2027
TABLE 7 GLOBAL FUNCTIONAL FLOUR SOURCE MARKET, BY REGION, 2020β2027
TABLE 9 NORTH AMERICA: FUNCTIONAL FLOUR SOURCE MARKET, BY COUNTRY, 2020β2027
TABLE 9 EUROPE: FUNCTIONAL FLOUR SOURCE MARKET, BY COUNTRY, 2020β2027
TABLE10 ASIA-PACIFIC: FUNCTIONAL FLOUR SOURCE MARKET, BY COUNTRY, 2020β2027
TABLE11 MIDDLE EAST & AFRICA: FUNCTIONAL FLOUR SOURCE MARKET, BY COUNTRY, 2020β2027
TABLE12 LATIN AMERICA: FUNCTIONAL FLOUR SOURCE MARKET, BY COUNTRY, 2020β2027
TABLE13 GLOBAL FUNCTIONAL FLOUR CLAIM MARKET, BY REGION, 2020β2027
TABLE14 NORTH AMERICA: FUNCTIONAL FLOUR CLAIM MARKET, BY COUNTRY, 2020β2027
TABLE15 EUROPE: FUNCTIONAL FLOUR CLAIM MARKET, BY COUNTRY, 2020β2027
TABLE16 ASIA-PACIFIC: FUNCTIONAL FLOUR CLAIM MARKET, BY COUNTRY, 2020β2027
TABLE17 MIDDLE EAST & AFRICA: FUNCTIONAL FLOUR CLAIM MARKET, BY COUNTRY, 2020β2027
TABLE19 LATIN AMERICA: FUNCTIONAL FLOUR CLAIM MARKET, BY COUNTRY, 2020β2027
TABLE20 GLOBAL FUNCTIONAL FLOUR DISTRIBUTION CHANNEL MARKET, BY REGION, 2020β2027
TABLE21 NORTH AMERICA: FUNCTIONAL FLOUR DISTRIBUTION CHANNEL MARKET, BY COUNTRY, 2020β2027
TABLE22 EUROPE: FUNCTIONAL FLOUR DISTRIBUTION CHANNEL MARKET, BY COUNTRY, 2020β2027
TABLE23 ASIA-PACIFIC: FUNCTIONAL FLOUR DISTRIBUTION CHANNEL MARKET, BY COUNTRY, 2020β2027
TABLE24 MIDDLE EAST & AFRICA: FUNCTIONAL FLOUR DISTRIBUTION CHANNEL MARKET, BY COUNTRY, 2020β2027
TABLE25 LATIN AMERICA: FUNCTIONAL FLOUR DISTRIBUTION CHANNEL MARKET, BY COUNTRY, 2020β2027
TABLE26 GLOBAL SOURCE MARKET, BY REGION, 2020β2027
TABLE27 GLOBAL CLAIM MARKET, BY REGION, 2020β2027
TABLE28 GLOBAL DISTRIBUTION CHANNEL MARKET, BY REGION, 2020β2027
TABLE29 NORTH AMERICA: FUNCTIONAL FLOUR MARKET, BY COUNTRY
TABLE30 NORTH AMERICA: FUNCTIONAL FLOUR MARKET, BY SOURCE
TABLE31 NORTH AMERICA: FUNCTIONAL FLOUR MARKET, BY CLAIM
TABLE32 NORTH AMERICA: FUNCTIONAL FLOUR MARKET, BY DISTRIBUTION CHANNEL
TABLE33 EUROPE: FUNCTIONAL FLOUR MARKET, BY COUNTRY
TABLE34 EUROPE: FUNCTIONAL FLOUR MARKET, BY SOURCE
TABLE35 EUROPE: FUNCTIONAL FLOUR MARKET, BY CLAIM
TABLE36 EUROPE: FUNCTIONAL FLOUR MARKET, BY DISTRIBUTION CHANNEL
TABLE37 ASIA-PACIFIC: FUNCTIONAL FLOUR MARKET, BY COUNTRY
TABLE38 ASIA-PACIFIC: FUNCTIONAL FLOUR MARKET, BY SOURCE
TABLE39 ASIA-PACIFIC: FUNCTIONAL FLOUR MARKET, BY CLAIM
TABLE40 ASIA-PACIFIC: FUNCTIONAL FLOUR MARKET, BY DISTRIBUTION CHANNEL
TABLE41 MIDDLE EAST & AFRICA: FUNCTIONAL FLOUR MARKET, BY COUNTRY
TABLE42 MIDDLE EAST & AFRICA FUNCTIONAL FLOUR MARKET, BY SOURCE
TABLE43 MIDDLE EAST & AFRICA FUNCTIONAL FLOUR MARKET, BY CLAIM
TABLE44 MIDDLE EAST & AFRICA FUNCTIONAL FLOUR MARKET, BY DISTRIBUTION CHANNEL
TABLE45 LATIN AMERICA: FUNCTIONAL FLOUR MARKET, BY COUNTRY
TABLE46 LATIN AMERICA FUNCTIONAL FLOUR MARKET, BY SOURCE
TABLE47 LATIN AMERICA FUNCTIONAL FLOUR MARKET, BY CLAIM
TABLE48 LATIN AMERICA FUNCTIONAL FLOUR MARKET, BY DISTRIBUTION CHANNEL
LIST OF FIGURES
FIGURE 1 GLOBAL FUNCTIONAL FLOUR MARKET SEGMENTATION
FIGURE 2 FORECAST RESEARCH METHODOLOGY
FIGURE 3 FIVE FORCES ANALYSIS OF GLOBAL FUNCTIONAL FLOUR MARKET
FIGURE 4 VALUE CHAIN OF GLOBAL FUNCTIONAL FLOUR MARKET
FIGURE 5 SHARE OF GLOBAL FUNCTIONAL FLOUR MARKET IN 2020, BY COUNTRY (%)
FIGURE 6 GLOBAL FUNCTIONAL FLOUR MARKET, 2020β2027,
FIGURE 7 GLOBAL FUNCTIONAL FLOUR MARKET SIZE BY SOURCES, 2020
FIGURE 8 SHARE OF GLOBAL FUNCTIONAL FLOUR MARKET, BY SOURCE, 2020β2027
FIGURE 9 GLOBAL FUNCTIONAL FLOUR MARKET SIZE, BY CLAIM, 2020
FIGURE 10 SHARE OF GLOBAL FUNCTIONAL FLOUR MARKET, BY CLAIM, 2020β2027
FIGURE 11 GLOBAL FUNCTIONAL FLOUR MARKET SIZE, BY DISTRIBUTION CHANNEL, 2020
FIGURE 12 SHARE OF GLOBAL FUNCTIONAL FLOUR MARKET, BY DISTRIBUTION CHANNEL, 2020β2027
$53,355 Million
8.6%
North America
2021-2030
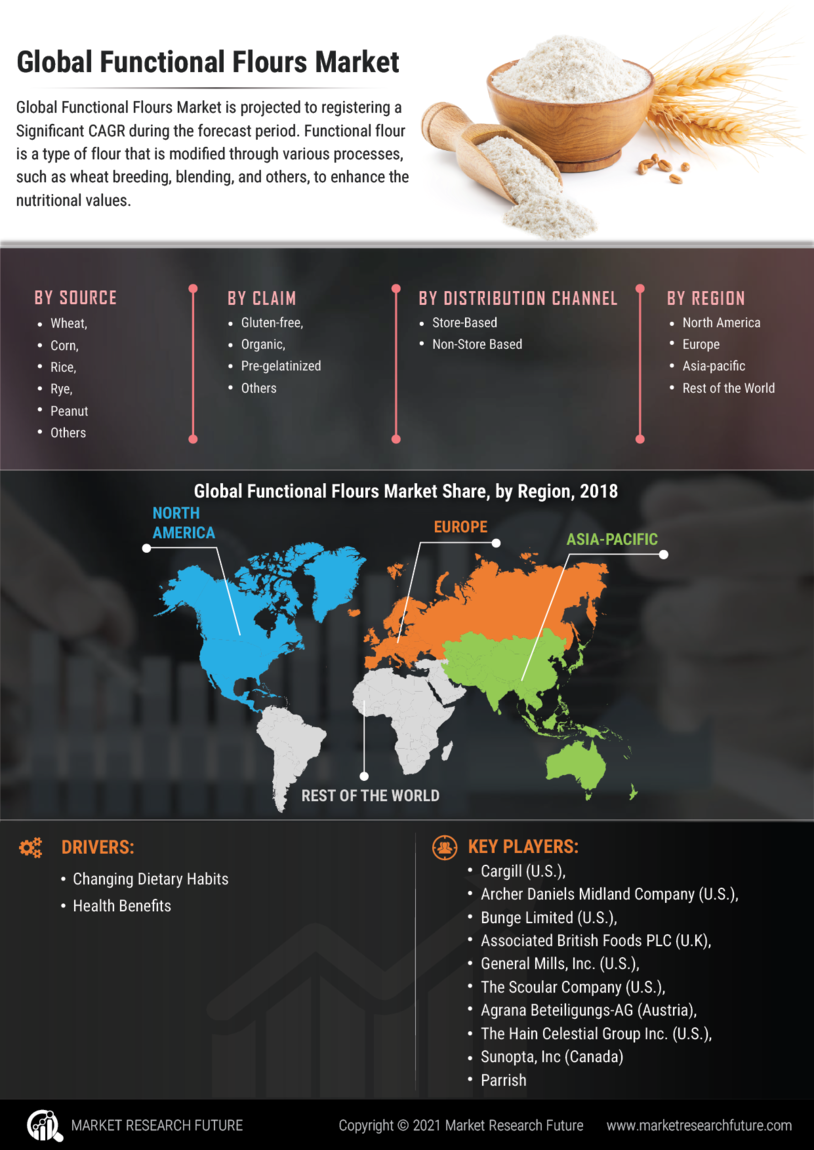
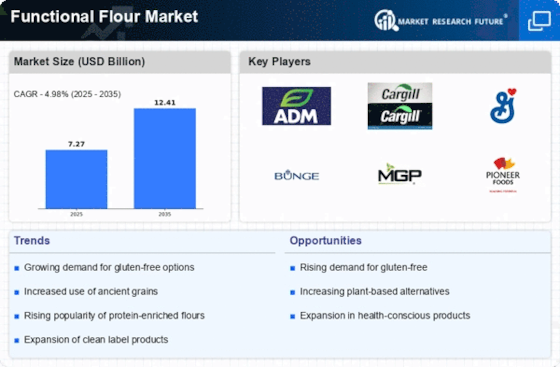
The functional flours market size is growing rapidly in the forecast period. Today, functional flour is an ingredient that has various health benefits. These functional flours are produced through many processes. Breeding and blending is some of the techniques in products these high nutritional value flours. There are lots of advantages to using functional flours. Regular flour may have many unhealthy ingredients. However, the waste or any unhealthy ingredients is removed in functional flours. It is flour that is rich in vitamins and minerals.
Today, the functional foods market has growing demand among consumers. The consumer inclination towards this product is huge. The functional flours are created with herbs, vitamins, and other healthy ingredients. The overall shelf life of this product is higher than the regular flours. Today, consumers across the world are trying to take lentils, cereal, and grains every day. However, functional flour is a food item that offers all these elements to the consumer.
It is a convenient food that is easy and ready to prepare. The wheat functional flour segment of the market is experiencing the highest demand. The gluten-free organic flours are healthy and suitable for anyone. Health-conscious individuals have a high preference for these gluten-free flours. All these are factors that will have a positive impact on functional flour's market value.
Covid Analysis
The outbreak of covid 19 is leading to many challenges for the global market. There is low production in many regions. Due to the lockdowns and restrictions, the supply of many markets is less. The lockdowns are affecting the production facilities of various markets.
However, functional food is gaining more traction in this period. Many people are getting more aware of the benefits of this food item. Due to this adoption of functional flour is rising. From 2021 the production and supply of the market are surging. Flour is an essential product in this period. The production of flour is rising during this period. It is expected to satisfy the food requirements of the population n various countries. The high shelf life and convenience of this product lead to high growth. These are factors that will create a positive functional flours market outlook.
Market Dynamics
Crucial Market Drivers
The growing use of functional foods in many industries is a crucial driver. The use of functional flour is now prevalent in many regions. They are used in the bakery industry and other ready-to-eat food markets. The increasing demand for functional flour in all these industries will have a positive impact on this market. Further, the changing lifestyle of the consumers is a crucial factor that drivers demand. The food habits and lifestyle of people are becoming healthy. Functional food is a low diet that has many benefits. It helps to regulate weight and body health.
These are factors that will play a crucial role to raise the demand of the market. Furthermore, rising awareness about gluten's impact on the body is raising the demand for healthy flour alternatives. Gluten can have a bad impact on health. It can increase sugar levels and body weight in individuals. However, gluten-free flour is exceptional in quality. The surging demand for functional flours will create a positive impact on this market. The surging demand will raise the overall profitability and supply of this market. These are factors that raise functional flours market trends.
The Market Growth Opportunities
The rise in disposable income will create high functional flours market growth opportunities. In the upcoming years, the per capita income of individuals in many countries will rise. This will improve the overall spending on the functional flours market. These factors will lead to high supply rates in the market. Further, the rising demand for premium flours will create new growth opportunities. The demand for premium products is growing rapidly.
Functional flour is a premium product with nutritional ingredients. It Isa healthier and more natural flour loaded with benefits. Modern consumers prefer quality over price. The demand for premium functional flours will lead to more demand for the market in the forecast period. Furthermore, the growing demand for low-fat alternatives will spark new developments. Low-calorie food items are a high preference of the health-conscious population.
The demand for the market will surge with the launch of lower-calorie flours. Furthermore, demand from the emerging economies will flourish the market growth. The emerging markets are expensing their demand for functional foods. Investments from Asia pacific will have a great impact on the growth and supply of this market. All these factors will contribute to the overall profitability of this market.
The Market Restraints
Stringent regulations in the market are a major restraint of the market. The functional flours market has the highest regulations. The functional flours market uses various ingredients and additives to increase the shelf life. However, the use of such ingredients is restricted by policies.
This creates restrictions in the production of these flours. All these restraints can have a major impact on the growth of this market. Furthermore, the volatility of raw materials is another factor that can affect the growth of this market. Due to raw materials price changes, many factors decline the demand of the market.
The Market Challenges
The lack of infrastructure is a challenge for the functional flours market. Functional foods are an emerging market. The growth of this market is steady. However, the lack of infrastructure makes the production process complex. Due to many complexities, the price of these products is high.
All these are factors that can pose a challenge to the functional flours market. Further, the price can affect the overall demand of the market in developing regions. Low expansion rates are prevalent due to these challenges.
Cumulative Growth Analysis
The functional flours market analysis shows stable growth. Many factors drive demand in the functional flours market. Rising awareness about functional food affects the market positively. However, some regions have few restraints. The difficulties and climatic changes in crop yield can also affect the production of functional flours.
Further, the raw material price volatility is affecting the growth of this market. Still, the demand for organic functional flour is constantly surging. The promising growth opportunities of the market lead to high growth. There are new product developments and expansions that will impact the growth rate.
Value Chain Analysis
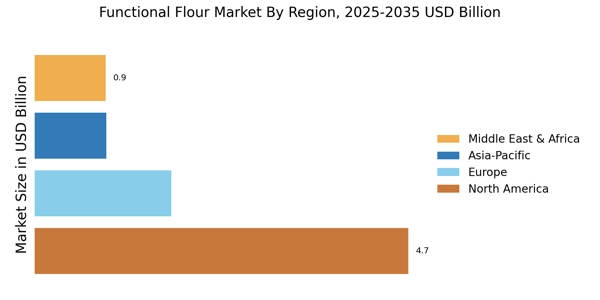
Functional flours market forecast suggests that North America is the country with the largest shares. Awareness of functional foods is high in this region. There is continuous innovation and growth of functional flours in the market. Factors such as the rising awareness about gluten-free flour will raise overall demand during the forecast period. The growing health benefits of the market are rising demand for the market. The investments from the market are high due to contributions from US and Canada. Further, new product developments will cause high scope for this market.
Segment Overview
Functional Flours Market by Product
Functional Flours Market by Claim
Functional Flours Market by Distribution Channel
Functional flours market by Geography
North America
Europe
Asia pacific
Competitive Landscape
The competition in the functional flours market is rising. Many factors contribute to the growth of this market. Market expansions, mergers, acquisitions, and collaborations are key strategies in the competitive landscape. New product developments are expected in the market is forecast.
Regional Analysis
The crucial regional players in the market are Asia Pacific, Europe, and North America. North America is a region holds the highest functional flours market share. Innovation and developments in these markets are higher. Also, in future years the new product launched in the market is high. The awareness about functional flours and their health benefits are highest among the key players. Europe is the second-largest flour market with the highest production.
There is exceptional demand and supply in the market. Further, Asia Pacific is the region with the highest growth rate. The demand for functional foods is emerging rapidly in all these regions. The store-based functional foods have the highest demand rate in the forecast period.
The Key Players in The Functional Flours Market Are
Report Overview
Frequently Asked Questions (FAQ) :
Wheat will lead the functional flour market.
Key players profiled in the functional flour market include Parrish and Heimbecker Limited (Canada), Sunopta, Inc (Canada), The Hain Celestial Group Inc. (U.S.), Agrana Beteiligungs-AG (Austria), The Scoular Company (U.S.), General Mills, Inc. (U.S.), Associated British Foods PLC (U.K), Bunge Limited (U.S.), Archer Daniels Midland Company (U.S.), and Cargill (U.S.).
North America will have the largest share in the functional flour market.
Changing dietary habits and multiple health benefits of functional flour are the key factors driving the functional flour market growth over the forecast period.
High raw material cost may limit the functional flour market growth.