• Cat-intel
  • MedIntelliX
  • Resources
  • About Us
  • Hero Background
    English
    Chinese
    French
    Japanese
    Korean
    German
    Spanish

    Military Power Solutions Market Size

    ID: MRFR/A&D/8832-CR
    168 Pages
    Sejal Akre
    November 2022

    Military Power Solutions Market Research Report Information by Type (Portable, Non-Portable), By Source (Batteries, Generators, Fuel Cells, Solar Power, Energy Harvesters), By Platform (Air, Marine, Ground), By Wattage (Low-Power, Medium Power, High Power), and Region (North America, Europe, Asia-Pacific, Middle East & Africa, and Latin America)—Forecast till 2035

    Share:
    Download PDF ×

    We do not share your information with anyone. However, we may send you emails based on your report interest from time to time. You may contact us at any time to opt-out.

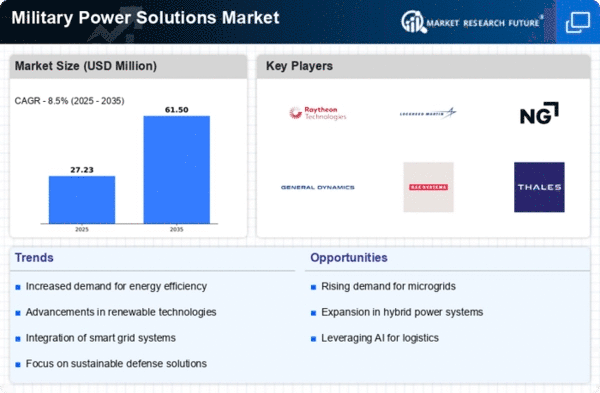
    Military Power Solutions Market Infographic
    $ 4,950.0
    $ 5,950.0
    $ 7,250.0

    Military Power Solutions Size

    Military Power Solutions Market Growth Projections and Opportunities

    The military power solutions market is influenced by several key factors that shape its growth and development. One significant factor is the increasing demand for reliable, portable, and efficient power sources to support modern military operations. Military forces require power solutions to operate a wide range of equipment and systems, including communication devices, surveillance systems, unmanned vehicles, and electronic warfare systems, among others. As military operations become increasingly complex and technology-driven, there is a growing need for power solutions that can deliver sufficient energy to support mission-critical applications in diverse environments, from remote combat zones to forward operating bases.

    Moreover, technological advancements play a crucial role in shaping the military power solutions market. Advances in battery technology, energy storage systems, renewable energy sources, and power management technologies have led to the development of more efficient, compact, and lightweight power solutions for military applications. Lithium-ion batteries, for example, offer higher energy density and longer operational lifetimes compared to traditional battery chemistries, making them well-suited for portable power applications in military environments. Additionally, advancements in renewable energy sources such as solar and wind power enable military forces to reduce reliance on fossil fuels and increase energy resilience in the field.

    Furthermore, market demand for military power solutions is driven by factors such as operational requirements, environmental considerations, and budget constraints. Military forces require power solutions that are rugged, reliable, and capable of operating in harsh environmental conditions, including extreme temperatures, high humidity, and rough terrain. Additionally, as governments and defense agencies seek to reduce their carbon footprint and comply with environmental regulations, there is a growing interest in deploying eco-friendly power solutions that minimize emissions and environmental impact. Furthermore, budget constraints and cost considerations influence procurement decisions, driving demand for cost-effective power solutions that offer the best value for money in terms of performance, reliability, and lifecycle costs.

    Moreover, the increasing adoption of electrification and digitization in military platforms and systems is driving market growth in the military power solutions sector. Modern military platforms, such as armored vehicles, aircraft, and naval vessels, are equipped with an array of electronic systems and sensors that require reliable and uninterrupted power to function effectively. Additionally, the proliferation of unmanned systems, including drones, robotics, and autonomous vehicles, further increases the demand for lightweight and portable power solutions that can power these systems during extended missions. Furthermore, the integration of advanced electronics, such as sensors, communication systems, and electronic warfare equipment, into military platforms drives demand for power solutions that can meet the increased power demands and ensure mission success.

    Additionally, market factors such as geopolitical tensions, security threats, and modernization initiatives drive investment in military power solutions. As geopolitical tensions rise and security threats evolve, countries around the world are investing in strengthening their defense capabilities and modernizing their armed forces. This includes upgrading existing military platforms, acquiring new technologies, and enhancing operational readiness to address emerging threats and maintain strategic superiority. Military power solutions play a critical role in supporting these modernization efforts by providing the energy infrastructure needed to power advanced weapons systems, communication networks, and electronic warfare capabilities.

    Furthermore, regulatory frameworks and standards significantly influence market dynamics in the military power solutions sector. Military power solutions must comply with stringent regulatory requirements and safety standards to ensure interoperability, reliability, and performance in military operations. Additionally, defense contractors and suppliers must adhere to export control regulations and international arms control agreements when supplying military power solutions to foreign customers. Compliance with these regulations is essential for maintaining market access, securing contracts, and building trust with military customers and stakeholders.

    Moreover, market factors such as technological innovation, industry partnerships, and global collaborations drive market competitiveness and innovation in the military power solutions sector. Defense contractors, technology providers, and research organizations collaborate to develop and deploy cutting-edge power solutions that meet the evolving needs of military customers. Additionally, strategic partnerships and alliances enable companies to leverage complementary capabilities, resources, and expertise to develop integrated power solutions that offer enhanced performance, reliability, and efficiency. Furthermore, investment in research and development (R&D) and technology innovation drives market differentiation and fosters the development of next-generation power solutions that address emerging challenges and opportunities in military operations.
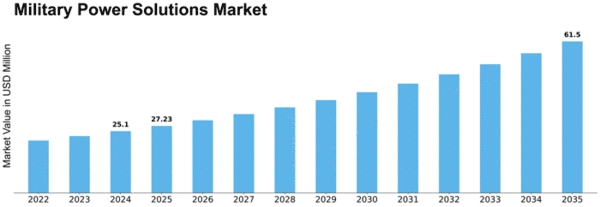
    Military Power Solutions Market Size Graph

    Market Summary

    The Global Military Power Solutions Market is projected to grow from 4.26 USD Billion in 2024 to 8.66 USD Billion by 2035.

    Key Market Trends & Highlights

    Military Power Solutions Key Trends and Highlights

    • The market is expected to achieve a compound annual growth rate (CAGR) of 6.65 percent from 2025 to 2035. By 2035, the market valuation is anticipated to reach 8.66 USD Billion, indicating robust growth. The base year valuation for the market stands at 4.26 USD Billion in 2024, reflecting its current size. Growing adoption of advanced military technologies due to increasing defense budgets is a major market driver.

    Market Size & Forecast

    2024 Market Size 4.26 (USD Million)
    2035 Market Size 8.66 (USD Million)
    CAGR (2025-2035) 6.65%
    Largest Regional Market Share in 2024 latin_america)

    Major Players

    <p>Cummins Inc (US), Gresham Power Electronics Limited (UK), EaglePicher Technologies (US), Enersys (US), SAFT (France), Schaefer, Inc. (US), Arotech Corporation (US), SFC Energy AG (Germany), Raytheon Technologies Corporation (US), GS Yuasa Corporation (Japan)</p>

    Market Trends

    <p>The ongoing evolution of military power solutions reflects a strategic imperative to enhance operational readiness and adaptability in an increasingly complex global security environment.</p>

    U.S. Department of Defense

    Military Power Solutions Market Market Drivers

    Geopolitical Tensions

    Geopolitical tensions are a significant driver of the Global Military Power Solutions Industry. The ongoing conflicts and territorial disputes in various regions have led to an urgent need for nations to bolster their military capabilities. This heightened focus on defense is expected to propel the market towards an estimated value of 8.66 USD Billion by 2035. Countries are increasingly investing in power solutions that ensure operational continuity and reliability in hostile environments. As military operations become more complex, the demand for robust power systems that can withstand diverse challenges is likely to intensify, further fueling market growth.

    Focus on Energy Resilience

    The emphasis on energy resilience within military operations is a key factor influencing the Global Military Power Solutions Industry. Armed forces are recognizing the importance of maintaining uninterrupted power supply during missions, which has led to increased investments in reliable power solutions. This focus is particularly critical in remote or austere environments where traditional power sources may be compromised. As a result, the market is witnessing a shift towards portable and adaptable power systems that can be deployed in various scenarios. This trend is expected to contribute to the overall growth of the market, aligning with the projected CAGR of 6.65% from 2025 to 2035.

    Increasing Defense Budgets

    The Global Military Power Solutions Industry is experiencing a notable surge due to the increasing defense budgets across various nations. Countries are allocating more resources to enhance their military capabilities, which is reflected in the projected market value of 4.26 USD Billion in 2024. This trend is particularly evident in regions such as Asia-Pacific and Europe, where geopolitical tensions have prompted governments to invest heavily in advanced military technologies. As nations prioritize modernization and readiness, the demand for innovative power solutions, including energy-efficient systems and reliable power sources, is expected to rise significantly.

    Technological Advancements

    Technological advancements play a crucial role in shaping the Global Military Power Solutions Industry. Innovations in energy generation, storage, and distribution are driving the development of more efficient military power systems. For instance, the integration of renewable energy sources, such as solar and wind, into military operations is becoming increasingly prevalent. This shift not only enhances operational efficiency but also aligns with global sustainability goals. As military forces seek to reduce their carbon footprint while maintaining operational readiness, the market is likely to see a compound annual growth rate of 6.65% from 2025 to 2035, indicating a robust future for advanced power solutions.

    Emerging Markets and Global Collaboration

    Emerging markets are becoming increasingly influential in the Global Military Power Solutions Industry. Countries in regions such as Asia and the Middle East are expanding their military capabilities and seeking advanced power solutions to support their defense initiatives. Collaborative efforts between nations, including joint exercises and technology sharing, are fostering innovation and enhancing the development of military power systems. This collaborative approach is likely to drive market growth as nations work together to address common security challenges. The combined effect of these emerging markets and global partnerships may lead to a more dynamic and competitive landscape in the military power solutions sector.

    Market Segment Insights

    Regional Insights

    Key Companies in the Military Power Solutions Market market include

    Industry Developments

    In April 2024, Tekever, a company specializing in uncrewed aerial systems (UAS), introduced its new modular ARX platform in Lisbon, Portugal. The ARX, Tekever's inaugural UAS with swarm capabilities, offers users the flexibility to select from a range of sensors, including EO/IR, LIDAR, SAR, and SIGINT/COMINT/ELINT. The ARX is equipped with advanced onboard artificial intelligence/machine learning (AI/ML) capabilities, SATCOM and mesh connection, and the capability to function in GNSS-denied conditions both at sea and on land. Tekever also provides the "ARX Digital Twin" alongside the ARX launch. This model serves as a digital representation of the system and may be used for simulation, integration, testing, monitoring, and maintenance. The ARX is scheduled to be released in 2025. In February 2024, Vecow Co., Ltd., a group of international specialists in embedded technology, introduced their new Fanless High-Endurance System designed for workstation use. The Vecow HEC-1000 is specifically engineered to be deployed in demanding environments, offering robust computing power based on the 13th Generation Intel® Core™ i9/i7/i5/i3 processor. It is equipped with dependable input/output interfaces, making it ideal for outdoor applications such as Advanced Driver Assistance Systems (ADAS), Autonomous Mobile Robots (AMR), Robotic Control, and rugged Edge Artificial Intelligence (AI) deployments. 

    Collins Aerospace (a division of Raytheon) has created a new power module to serve open architecture programs including radar, signal processors, mission computers, and aircraft communication. For platforms working in severe environments with limited space, weight, and power (SWAP), the Collins 3Phase 3U power module provides up to 800 watts of power without the need for extra filtering hardware. On February 2022

    Seanergy 2.0, a new lithium-ion (Li-ion) battery system for fully electric and hybrid ships, has been introduced by Saft, a TotalEnergies subsidiary. The marine battery can assist ship owners in lowering their fuel costs, CO2 and NOx emissions, and air pollution without compromising performance or being overly expensive. On June 2022

    Enersys announced the successful integration of its ABSL Lithium-ion (Li-ion) batteries into the launch of the James Webb Space Telescope by the National Aeronautics and Space Administration (NASA). The Web space telescope, which replaces the venerable Hubble space telescope, was developed through international cooperation between NASA, the European Space Agency (ESA), the Canadian Space Agency (CSA), and Northrop Grumman, the leading company in the field. On December 2021

    Cummins announced the acquisition of Meritor, Inc. had been completed. Through the integration of Meritor's people, products, and skills in axle and brake technology, Cummins will be positioned as a leading provider of integrated powertrain solutions in both internal combustion and electric power applications. On August 2022

    Future Outlook

    Military Power Solutions Market Future Outlook

    <p>The Military Power Solutions Market is projected to grow at a 6.65% CAGR from 2024 to 2035, driven by technological advancements, increased defense budgets, and the shift towards renewable energy sources.</p>

    New opportunities lie in:

    • <p>Develop advanced energy storage systems for military applications. Invest in hybrid power solutions to enhance operational efficiency. Create innovative microgrid technologies for remote military bases.</p>

    <p>By 2035, the Military Power Solutions Market is expected to be robust, reflecting significant advancements and strategic investments.</p>

    Market Segmentation

    Report Scope

    {"0"=>{"market_size"=>" 2030: USD 6,258.52 Million "}, "1"=>{"cagr"=>"6.7% CAGR (2022-2030) "}, "2"=>{"base_year"=>"2021"}, "3"=>{"forecast_period"=>"2022-2030"}, "4"=>{"historical_data"=>" 2019 and 2020"}, "5"=>{"forecast_units"=>"Value (USD Million)"}, "6"=>{"report_coverage"=>" Revenue Forecast, Competitive Landscape, Growth Factors, and Trends "}, "7"=>{"segments_covered"=>" Type, source, platform, wattage, and region/country."}, "8"=>{"geographies_covered"=>" North America, Europe, Asia-Pacific, Middle East & Africa, and Latin America "}, "9"=>{"key_vendors"=>"Cummins Inc (US), Gresham Power Electronics Limited (UK) EaglePicher Technologies (US)"}, "10"=>{"key_market_opportunities"=>"•\tIncreasing popularity and need for renewable sources of energy\r\n•\tIncreasing demand for UAVs which requires a long-lasting power supply"}, "11"=>{"key_market_drivers"=>"•\tIssues related to the inefficiency in generating a high power output\r\n•\tHigh initial cost of development\r\n•\tHigh cost of thermoelectric materials\r\n•\tStringent military regulations \r\n"}}

    Market Highlights

    Author

    Sejal Akre
    Senior Research Analyst

    She holds an experience of about 6+ years in market research and business consulting, working under the spectrum of information communication technology, telecommunications and semiconductor domains. aarti conceptualizes and implements a scalable business strategy and provides strategic leadership to the clients. her expertise lies in market estimation, competitive intelligence, pipeline analysis, customer assessment, etc.

    Leave a Comment

    Latest Comments

    John Doe
    john@example.com

    This is a great article! Really helped me understand the topic better.

    Posted on July 23, 2025, 10:15 AM
    Jane Smith
    jane@domain.com

    Thanks for sharing this. I’ve bookmarked it for later reference.

    Posted on July 22, 2025, 7:45 PM

    FAQs

    Which type of segment is driving the market?

    The nonportable segment is expected to drive the market during the forecasted period.

    What is the growth scope of the market?

    The global Military Power Solutions market has been growing rapidly over the past few decades and is expected to reach USD 6,258.5 Million by 2030, at a CAGR of 6.7% during the forecast period.

    Which segment is expected to register the highest CAGR?

    The ground segment is expected to register the highest CAR during the forecast period owing to the increasing demand for military power solutions for military base camps and military vehicles.

    Which segment is anticipated to be the fastest-growing segment of the global Military Power Solutions Market?

    The fuel cells segment is anticipated to be the fastest-growing segment of the global market for military power solutions.

    In Which region is guiding the achievement of the market?

    The North American region is expected to be the largest market for Military Power Solutions market during the forecast period.

    What can limit the expansion of the global market?

    Stringtent military regulations and the high initial cost of development may slow the growth of the Military Power Solutions market during the forecast period.

    1. EXECUTIVE SUMMARY 18
      1. \r\n
      2. MARKET ATTRACTIVENESS ANALYSIS 20
      3. \r\n
    2. MARKET INTRODUCTION 21
      1. \r\n
      2. DEFINITION 21
      3. \r\n
      4. SCOPE OF THE STUDY 21
      5. \r\n
      6. RESEARCH OBJECTIVE 21
      7. \r\n
      8. MARKET STRUCTURE 21
      9. \r\n
    3. RESEARCH METHODOLOGY 22
      1. \r\n
    4. MARKET INSIGHTS 28
      1. \r\n
    5. MARKET DYNAMICS 30
      1. \r\n
      2. MARKET DRIVERS 30
        1. INCREASING DEMAND FOR PORTABLE POWER SUPPLY SOLUTIONS 31
        2. GROWING EMERGENCE OF MODERN WARFARE TECHNIQUES 31
        3. RISING DEFENSE ELECTRONICS BUDGET 32
      3. \r\n
      4. \r\n
      5. \r\n
      6. \r\n
      7. RESTRAINS 32
        1. ISSUES RELATED TO INEFFICIENCY TO GENERATE HIGH OUTPUT POWER 32
        2. HIGH INITIAL COST OF DEVELOPMENT 33
        3. HIGH COST OF THERMOELECTRIC MATERIALS 33
        4. STRINGENT MILITARY REGULATIONS 33
      8. \r\n
      9. \r\n
      10. \r\n
      11. \r\n
      12. \r\n
      13. OPPORTUNITY 33
        1. INCREASING POPULARITY AND NEED FOR RENEWABLE SOURCES OF ENERGY 33
        2. INCREASING DEMAND FOR UAVS WHICH REQUIRE LONG-LASTING POWER SUPPLY 33
      14. \r\n
      15. \r\n
      16. \r\n
      17. REGULATIONS 34
      18. \r\n
      19. PATENT ANALYSIS 34
      20. \r\n
    6. MARKET FACTOR ANALYSIS 36
      1. \r\n
      2. VALUE CHAIN 36
        1. R&D AND DESIGNING 37
        2. MANUFACTURING 37
        3. DISTRIBUTION & SALES 37
        4. POST-SALES MONITORING 37
      3. \r\n
      4. \r\n
      5. \r\n
      6. \r\n
      7. \r\n
      8. PORTER’S FIVE FORCES MODEL 38
        1. THREAT OF NEW ENTRANTS 39
        2. BARGAINING POWER OF SUPPLIERS 39
        3. BARGAINING POWER OF BUYERS 39
        4. THREAT OF SUBSTITUTES 39
        5. INTENSITY OF RIVALRY 39
      9. \r\n
      10. \r\n
      11. \r\n
      12. \r\n
      13. \r\n
      14. \r\n
      15. IMPACT OF COVID-19 ON MILITARY POWER SOLUTIONS MARKET 39
      16. \r\n
    7. GLOBAL MILITARY POWER SOLUTIONS MARKET, BY TYPE 41
      1. \r\n
      2. OVERVIEW 41
        1. GLOBAL MILITARY POWER SOLUTIONS MARKET, BY TYPE, 2022–2030 (USD MILLION) 42
      3. \r\n
      4. \r\n
      5. PORTABLE 42
      6. \r\n
      7. NON-PORTABLE 42
      8. \r\n
    8. GLOBAL MILITARY POWER SOLUTIONS MARKET, BY SOURCE 43
      1. \r\n
      2. OVERVIEW 43
        1. GLOBAL MILITARY POWER SOLUTIONS MARKET, BY SOURCE, 2022–2030 (USD MILLION) 44
      3. \r\n
      4. \r\n
      5. BATTERIES 44
      6. \r\n
      7. GENERATORS 45
      8. \r\n
      9. FUEL CELLS 45
      10. \r\n
      11. SOLAR POWER 45
      12. \r\n
      13. ENERGY HARVESTERS 45
      14. \r\n
    9. GLOBAL MILITARY POWER SOLUTIONS MARKET, BY PLATFORM 46
      1. \r\n
      2. OVERVIEW 46
        1. GLOBAL MILITARY POWER SOLUTIONS MARKET, BY PLATFORM, 2022–2030 (USD MILLION) 47
      3. \r\n
      4. \r\n
      5. AIR 47
      6. \r\n
      7. MARINE 47
      8. \r\n
      9. GROUND 48
      10. \r\n
    10. GLOBAL MILITARY POWER SOLUTIONS MARKET, BY WATTAGE 49
      1. \r\n
      2. OVERVIEW 49
        1. GLOBAL MILITARY POWER SOLUTIONS MARKET, BY WATTAGE, 2022–2030 (USD MILLION) 50
      3. \r\n
      4. \r\n
      5. LOW POWER 50
      6. \r\n
      7. MEDIUM POWER 50
      8. \r\n
      9. HIGH POWER 50
      10. \r\n
    11. GLOBAL MILITARY POWER SOLUTIONS MARKET, BY REGION 52
      1. \r\n
      2. OVERVIEW 52
        1. GLOBAL MILITARY POWER SOLUTIONS MARKET, BY REGION, 2021 VS 2030 (USD MILLION) 52
        2. GLOBAL MILITARY POWER SOLUTIONS MARKET, BY REGION, 2022–2030 (USD MILLION) 53
      3. \r\n
      4. \r\n
      5. \r\n
      6. NORTH AMERICA 54
        1. NORTH AMERICA: MILITARY POWER SOLUTIONS MARKET, BY COUNTRY, 2022–2030 (USD MILLION) 55
        2. NORTH AMERICA MILITARY POWER SOLUTIONS MARKET, BY TYPE, 2022–2030 (USD MILLION) 56
        3. NORTH AMERICA MILITARY POWER SOLUTIONS MARKET, BY SOURCE, 2022–2030 (USD MILLION) 57
        4. NORTH AMERICA MILITARY POWER SOLUTIONS MARKET, BY PLATFORM, 2022–2030 (USD MILLION) 57
        5. NORTH AMERICA MILITARY POWER SOLUTIONS MARKET, BY WATTAGE, 2022–2030 (USD MILLION) 58
        6. US 59
        7. CANADA 60
      7. \r\n
      8. \r\n
      9. \r\n
      10. \r\n
      11. \r\n
      12. \r\n
      13. \r\n
      14. \r\n
      15. \r\n
      16. \r\n
      17. \r\n
      18. \r\n
      19. \r\n
      20. \r\n
      21. \r\n
      22. \r\n
      23. EUROPE 61
        1. EUROPE: MILITARY POWER SOLUTIONS MARKET, BY COUNTRY, 2022–2030 (USD MILLION) 62
        2. EUROPE MILITARY POWER SOLUTIONS MARKET, BY TYPE, 2022–2030 (USD MILLION) 63
        3. EUROPE MILITARY POWER SOLUTIONS MARKET, BY SOURCE, 2022–2030 (USD MILLION) 63
        4. EUROPE MILITARY POWER SOLUTIONS MARKET, BY PLATFORM, 2022–2030 (USD MILLION) 64
        5. EUROPE MILITARY POWER SOLUTIONS MARKET, BY WATTAGE, 2022–2030 (USD MILLION) 65
        6. NETHERLANDS 65
        7. FRANCE 66
        8. GERMANY 67
        9. UK 68
        10. SPAIN 69
        11. ITALY 70
        12. SWEDEN 71
        13. CANADA 72
        14. FINLAND 73
        15. BELGIUM 74
        16. REST OF EUROPE 75
      24. \r\n
      25. \r\n
      26. \r\n
      27. \r\n
      28. \r\n
      29. \r\n
      30. \r\n
      31. \r\n
      32. \r\n
      33. \r\n
      34. \r\n
      35. \r\n
      36. \r\n
      37. \r\n
      38. \r\n
      39. \r\n
      40. \r\n
      41. \r\n
      42. \r\n
      43. \r\n
      44. \r\n
      45. \r\n
      46. \r\n
      47. \r\n
      48. \r\n
      49. \r\n
      50. \r\n
      51. \r\n
      52. \r\n
      53. \r\n
      54. \r\n
      55. \r\n
      56. \r\n
      57. \r\n
      58. \r\n
      59. \r\n
      60. \r\n
      61. \r\n
      62. \r\n
      63. \r\n
      64. \r\n
      65. \r\n
      66. \r\n
      67. \r\n
      68. \r\n
      69. \r\n
      70. \r\n
      71. \r\n
      72. \r\n
      73. \r\n
      74. \r\n
      75. \r\n
      76. \r\n
      77. \r\n
      78. \r\n
      79. \r\n
      80. \r\n
      81. \r\n
      82. \r\n
      83. \r\n
      84. \r\n
      85. ASIA-PACIFIC 77
        1. ASIA-PACIFIC: MILITARY POWER SOLUTIONS MARKET, BY COUNTRY, 2022–2030 (USD MILLION) 78
        2. ASIA-PACIFIC MILITARY POWER SOLUTIONS MARKET, BY TYPE, 2022–2030 (USD MILLION) 79
        3. ASIA-PACIFIC MILITARY POWER SOLUTIONS MARKET, BY SOURCE, 2022–2030 (USD MILLION) 80
        4. ASIA-PACIFIC MILITARY POWER SOLUTIONS MARKET, BY PLATFORM, 2022–2030 (USD MILLION) 80
        5. ASIA-PACIFIC MILITARY POWER SOLUTIONS MARKET, BY WATTAGE, 2022–2030 (USD MILLION) 81
        6. CHINA 82
        7. JAPAN 83
        8. INDIA 84
        9. REST OD ASIA-PACICIC 85
      86. \r\n
      87. \r\n
      88. \r\n
      89. \r\n
      90. \r\n
      91. \r\n
      92. \r\n
      93. \r\n
      94. \r\n
      95. \r\n
      96. \r\n
      97. \r\n
      98. \r\n
      99. \r\n
      100. \r\n
      101. \r\n
      102. \r\n
      103. \r\n
      104. \r\n
      105. \r\n
      106. \r\n
      107. \r\n
      108. \r\n
      109. \r\n
      110. \r\n
      111. \r\n
      112. REST OF THE WORLD 86
        1. REST OF THE WORLD: MILITARY POWER SOLUTIONS MARKET, BY COUNTRY, 2022–2030 (USD MILLION) 86
        2. REST OF THE WORLD MILITARY POWER SOLUTIONS MARKET, BY TYPE, 2022–2030 (USD MILLION) 87
        3. REST OF THE WORLD MILITARY POWER SOLUTIONS MARKET, BY SOURCE, 2022–2030 (USD MILLION) 88
        4. REST OF THE WORLD MILITARY POWER SOLUTIONS MARKET, BY PLATFORM, 2022–2030 (USD MILLION) 88
        5. REST OF THE WORLD MILITARY POWER SOLUTIONS MARKET, BY WATTAGE, 2022–2030 (USD MILLION) 89
        6. MIDDLE EAST & AFRICA 89
        7. LATIN AMERICA 91
      113. \r\n
      114. \r\n
      115. \r\n
      116. \r\n
      117. \r\n
      118. \r\n
      119. \r\n
      120. \r\n
      121. \r\n
      122. \r\n
      123. \r\n
      124. \r\n
      125. \r\n
      126. \r\n
      127. \r\n
      128. \r\n
    12. COMPETITVE LANDSCAPE 92
      1. \r\n
      2. COMPETITIVE BENCHMARKING 93
      3. \r\n
      4. VENDOR SHARE ANALYSIS 94
      5. \r\n
      6. RECENT DEVELOPMENTS 94
        1. PARTNERSHIPS/AGREEMENTS/CONTRACTS/COLLABORATIONS 95
      7. \r\n
      8. \r\n
    13. COMPANY PROFILES 96
      1. \r\n
      2. CUMMINS INC. 96
        1. COMPANY OVERVIEW 96
        2. FINANCIAL OVERVIEW 97
        3. PRODUCTS/SOLUTIONS/SERVICES OFFERED 98
        4. KEY DEVELOPMENTS 98
        5. SWOT ANALYSIS 99
        6. KEY STRATEGIES 99
      3. \r\n
      4. \r\n
      5. \r\n
      6. \r\n
      7. \r\n
      8. \r\n
      9. \r\n
      10. GRESHAM POWER ELECTRONICS LIMITED 100
        1. COMPANY OVERVIEW 100
        2. FINANCIAL OVERVIEW 100
        3. PRODUCTS/SOLUTIONS/SERVICES OFFERED 100
        4. KEY DEVELOPMENTS 100
        5. SWOT ANALYSIS 101
        6. KEY STRATEGIES 101
      11. \r\n
      12. \r\n
      13. \r\n
      14. \r\n
      15. \r\n
      16. \r\n
      17. \r\n
      18. EAGLEPICHER TECHNOLOGIES 102
        1. COMPANY OVERVIEW 102
        2. FINANCIAL OVERVIEW 102
        3. PRODUCTS/SOLUTIONS/SERVICES OFFERED 102
        4. KEY DEVELOPMENTS 103
        5. SWOT ANALYSIS 103
        6. KEY STRATEGIES 103
      19. \r\n
      20. \r\n
      21. \r\n
      22. \r\n
      23. \r\n
      24. \r\n
      25. \r\n
      26. ENERSYS. 104
        1. COMPANY OVERVIEW 104
        2. FINANCIAL OVERVIEW 104
        3. PRODUCTS/SOLUTIONS/SERVICES OFFERED 105
        4. KEY DEVELOPMENTS 105
        5. SWOT ANALYSIS 106
        6. KEY STRATEGIES 106
      27. \r\n
      28. \r\n
      29. \r\n
      30. \r\n
      31. \r\n
      32. \r\n
      33. \r\n
      34. SAFT 107
        1. COMPANY OVERVIEW 107
        2. FINANCIAL OVERVIEW 107
        3. PRODUCTS/SOLUTIONS/SERVICES OFFERED 108
        4. KEY DEVELOPMENTS 108
        5. SWOT ANALYSIS 109
        6. KEY STRATEGIES 109
      35. \r\n
      36. \r\n
      37. \r\n
      38. \r\n
      39. \r\n
      40. \r\n
      41. \r\n
      42. SCHAEFER,INC. 110
        1. COMPANY OVERVIEW 110
        2. FINANCIAL OVERVIEW 110
        3. PRODUCTS/SOLUTIONS/SERVICES OFFERED 110
        4. KEY DEVELOPMENTS 111
        5. SWOT ANALYSIS 111
        6. KEY STRATEGIES 111
      43. \r\n
      44. \r\n
      45. \r\n
      46. \r\n
      47. \r\n
      48. \r\n
      49. \r\n
      50. AROTECH CORPORATION. 112
        1. COMPANY OVERVIEW 112
        2. FINANCIAL OVERVIEW 112
        3. PRODUCTS/SOLUTIONS/SERVICES OFFERED 113
        4. KEY DEVELOPMENTS 113
      51. \r\n
      52. \r\n
      53. \r\n
      54. \r\n
      55. \r\n
      56. SFC ENERGY AG 114
        1. COMPANY OVERVIEW 114
        2. FINANCIAL OVERVIEW 114
        3. PRODUCTS/SOLUTIONS/SERVICES OFFERED 115
        4. KEY DEVELOPMENTS 115
        5. SWOT ANALYSIS 116
        6. KEY STRATEGIES 116
      57. \r\n
      58. \r\n
      59. \r\n
      60. \r\n
      61. \r\n
      62. \r\n
      63. \r\n
      64. RAYTHEON TECHNOLOGIES CORPORATION 117
        1. COMPANY OVERVIEW 117
        2. FINANCIAL OVERVIEW 118
        3. PRODUCTS/SOLUTIONS/SERVICES OFFERED 119
        4. KEY DEVELOPMENTS 119
        5. SWOT ANALYSIS 120
        6. KEY STRATEGIES 120
      65. \r\n
      66. \r\n
      67. \r\n
      68. \r\n
      69. \r\n
      70. \r\n
      71. \r\n
      72. GS YUASA CORPORATION 121
        1. COMPANY OVERVIEW 121
        2. FINANCIAL OVERVIEW 122
        3. PRODUCTS/SOLUTIONS/SERVICES OFFERED 123
        4. KEY DEVELOPMENTS 123
        5. SWOT ANALYSIS 124
        6. KEY STRATEGIES 124
      73. \r\n
      74. \r\n
      75. \r\n
      76. \r\n
      77. \r\n
      78. \r\n
      79. \r\n
      80. \r\n
    14. LIST OF TABLES
      1. \r\n
    15. MAJOR GRANTED PATENTS ON MILITARY POWER SOLUTIONS 34
      1. \r\n
    16. GLOBAL MILITARY POWER SOLUTIONS MARKET, BY TYPE, 2022–2030 (USD MILLION) 42
      1. \r\n
    17. GLOBAL MILITARY POWER SOLUTIONS MARKET, BY SOURCE, 2022–2030 (USD MILLION) 44
      1. \r\n
    18. GLOBAL MILITARY POWER SOLUTIONS MARKET, BY PLATFORM, 2022–2030 (USD MILLION) 47
      1. \r\n
    19. GLOBAL MILITARY POWER SOLUTIONS MARKET, BY WATTAGE, 2022–2030 (USD MILLION) 50
      1. \r\n
    20. GLOBAL MILITARY POWER SOLUTIONS MARKET, BY REGION, 2022–2030 (USD MILLION) 53
      1. \r\n
    21. NORTH AMERICA MILITARY POWER SOLUTIONS MARKET, BY COUNTRY, 2022–2030 (USD MILLION) 55
      1. \r\n
    22. NORTH AMERICA MILITARY POWER SOLUTIONS MARKET, BY TYPE, 2022–2030 (USD MILLION) 56
      1. \r\n
    23. NORTH AMERICA MILITARY POWER SOLUTIONS MARKET, BY SOURCE, 2022–2030 (USD MILLION) 57
      1. \r\n
    24. NORTH AMERICA MILITARY POWER SOLUTIONS MARKET, BY PLATFORM, 2022–2030 (USD MILLION) 57
      1. \r\n
    25. NORTH AMERICA MILITARY POWER SOLUTIONS MARKET, BY WATTAGE, 2022–2030 (USD MILLION) 58
      1. \r\n
    26. US MILITARY POWER SOLUTIONS MARKET, BY TYPE, 2022–2030 (USD MILLION) 59
      1. \r\n
    27. US MILITARY POWER SOLUTIONS MARKET, BY SOURCE, 2022–2030 (USD MILLION) 59
      1. \r\n
    28. US MILITARY POWER SOLUTIONS MARKET, BY PLATFORM, 2022–2030 (USD MILLION) 59
      1. \r\n
    29. US MILITARY POWER SOLUTIONS MARKET, BY WATTAGE, 2022–2030 (USD MILLION) 59
      1. \r\n
    30. CANADA MILITARY POWER SOLUTIONS MARKET, BY TYPE, 2022–2030 (USD MILLION) 60
      1. \r\n
    31. CANADA MILITARY POWER SOLUTIONS MARKET, BY SOURCE, 2022–2030 (USD MILLION) 60
      1. \r\n
    32. CANADA MILITARY POWER SOLUTIONS MARKET, BY PLATFORM, 2022–2030 (USD MILLION) 60
      1. \r\n
    33. CANADA MILITARY POWER SOLUTIONS MARKET, BY WATTAGE, 2022–2030 (USD MILLION) 60
      1. \r\n
    34. EUROPE MILITARY POWER SOLUTIONS MARKET, BY COUNTRY, 2022–2030 (USD MILLION) 62
      1. \r\n
    35. EUROPE MILITARY POWER SOLUTIONS MARKET, BY TYPE, 2022–2030 (USD MILLION) 63
      1. \r\n
    36. EUROPE MILITARY POWER SOLUTIONS MARKET, BY SOURCE, 2022–2030 (USD MILLION) 63
      1. \r\n
    37. EUROPE MILITARY POWER SOLUTIONS MARKET, BY PLATFORM, 2022–2030 (USD MILLION) 64
      1. \r\n
    38. EUROPE MILITARY POWER SOLUTIONS MARKET, BY WATTAGE, 2022–2030 (USD MILLION) 65
      1. \r\n
    39. NETHERLANDS MILITARY POWER SOLUTIONS MARKET, BY TYPE, 2022–2030 (USD MILLION) 65
      1. \r\n
    40. NETHERLANDS MILITARY POWER SOLUTIONS MARKET, BY SOURCE, 2022–2030 (USD MILLION) 65
      1. \r\n
    41. NETHERLANDS MILITARY POWER SOLUTIONS MARKET, BY PLATFORM, 2022–2030 (USD MILLION) 65
      1. \r\n
    42. NETHERLANDS MILITARY POWER SOLUTIONS MARKET, BY WATTAGE, 2022–2030 (USD MILLION) 66
      1. \r\n
    43. FRANCE MILITARY POWER SOLUTIONS MARKET, BY TYPE, 2022–2030 (USD MILLION) 66
      1. \r\n
    44. FRANCE MILITARY POWER SOLUTIONS MARKET, BY SOURCE, 2022–2030 (USD MILLION) 66
      1. \r\n
    45. FRANCE MILITARY POWER SOLUTIONS MARKET, BY PLATFORM, 2022–2030 (USD MILLION) 66
      1. \r\n
    46. FRANCE MILITARY POWER SOLUTIONS MARKET, BY WATTAGE, 2022–2030 (USD MILLION) 67
      1. \r\n
    47. GERMANY MILITARY POWER SOLUTIONS MARKET, BY TYPE, 2022–2030 (USD MILLION) 67
      1. \r\n
    48. GERMANY MILITARY POWER SOLUTIONS MARKET, BY SOURCE, 2022–2030 (USD MILLION) 67
      1. \r\n
    49. GERMANY MILITARY POWER SOLUTIONS MARKET, BY PLATFORM, 2022–2030 (USD MILLION) 67
      1. \r\n
    50. GERMANY MILITARY POWER SOLUTIONS MARKET, BY WATTAGE, 2022–2030 (USD MILLION) 68
      1. \r\n
    51. UK MILITARY POWER SOLUTIONS MARKET, BY TYPE, 2022–2030 (USD MILLION) 68
      1. \r\n
    52. UK MILITARY POWER SOLUTIONS MARKET, BY SOURCE, 2022–2030 (USD MILLION) 68
      1. \r\n
    53. UK MILITARY POWER SOLUTIONS MARKET, BY PLATFORM, 2022–2030 (USD MILLION) 68
      1. \r\n
    54. UK MILITARY POWER SOLUTIONS MARKET, BY WATTAGE, 2022–2030 (USD MILLION) 69
      1. \r\n
    55. SPAIN MILITARY POWER SOLUTIONS MARKET, BY TYPE, 2022–2030 (USD MILLION) 69
      1. \r\n
    56. SPAIN MILITARY POWER SOLUTIONS MARKET, BY SOURCE, 2022–2030 (USD MILLION) 69
      1. \r\n
    57. SPAIN MILITARY POWER SOLUTIONS MARKET, BY PLATFORM, 2022–2030 (USD MILLION) 69
      1. \r\n
    58. SPAIN MILITARY POWER SOLUTIONS MARKET, BY WATTAGE, 2022–2030 (USD MILLION) 70
      1. \r\n
    59. ITALY MILITARY POWER SOLUTIONS MARKET, BY TYPE, 2022–2030 (USD MILLION) 70
      1. \r\n
    60. ITALY MILITARY POWER SOLUTIONS MARKET, BY SOURCE, 2022–2030 (USD MILLION) 70
      1. \r\n
    61. ITALY MILITARY POWER SOLUTIONS MARKET, BY PLATFORM, 2022–2030 (USD MILLION) 70
      1. \r\n
    62. ITALY MILITARY POWER SOLUTIONS MARKET, BY WATTAGE, 2022–2030 (USD MILLION) 71
      1. \r\n
    63. SWEDEN MILITARY POWER SOLUTIONS MARKET, BY TYPE, 2022–2030 (USD MILLION) 71
      1. \r\n
    64. SWEDEN MILITARY POWER SOLUTIONS MARKET, BY SOURCE, 2022–2030 (USD MILLION) 71
      1. \r\n
    65. SWEDEN MILITARY POWER SOLUTIONS MARKET, BY PLATFORM, 2022–2030 (USD MILLION) 71
      1. \r\n
    66. SWEDEN MILITARY POWER SOLUTIONS MARKET, BY WATTAGE, 2022–2030 (USD MILLION) 72
      1. \r\n
    67. DENMARK MILITARY POWER SOLUTIONS MARKET, BY TYPE, 2022–2030 (USD MILLION) 72
      1. \r\n
    68. DENMARK MILITARY POWER SOLUTIONS MARKET, BY SOURCE, 2022–2030 (USD MILLION) 72
      1. \r\n
    69. DENMARK MILITARY POWER SOLUTIONS MARKET, BY PLATFORM, 2022–2030 (USD MILLION) 72
      1. \r\n
    70. DENMARK MILITARY POWER SOLUTIONS MARKET, BY WATTAGE, 2022–2030 (USD MILLION) 73
      1. \r\n
    71. FINLAND MILITARY POWER SOLUTIONS MARKET, BY TYPE, 2022–2030 (USD MILLION) 73
      1. \r\n
    72. FINLAND MILITARY POWER SOLUTIONS MARKET, BY SOURCE, 2022–2030 (USD MILLION) 73
      1. \r\n
    73. FINLAND MILITARY POWER SOLUTIONS MARKET, BY PLATFORM, 2022–2030 (USD MILLION) 73
      1. \r\n
    74. FINLAND MILITARY POWER SOLUTIONS MARKET, BY WATTAGE, 2022–2030 (USD MILLION) 74
      1. \r\n
    75. BELGIUM MILITARY POWER SOLUTIONS MARKET, BY TYPE, 2022–2030 (USD MILLION) 74
      1. \r\n
    76. BELGIUM MILITARY POWER SOLUTIONS MARKET, BY SOURCE, 2022–2030 (USD MILLION) 74
      1. \r\n
    77. BELGIUM MILITARY POWER SOLUTIONS MARKET, BY PLATFORM, 2022–2030 (USD MILLION) 74
      1. \r\n
    78. BELGIUM MILITARY POWER SOLUTIONS MARKET, BY WATTAGE, 2022–2030 (USD MILLION) 75
      1. \r\n
    79. REST OF EUROPE MILITARY POWER SOLUTIONS MARKET, BY TYPE, 2022–2030 (USD MILLION) 75
      1. \r\n
    80. REST OF EUROPE MILITARY POWER SOLUTIONS MARKET, BY SOURCE, 2022–2030 (USD MILLION) 75
      1. \r\n
    81. REST OF EUROPE MILITARY POWER SOLUTIONS MARKET, BY PLATFORM, 2022–2030 (USD MILLION) 75
      1. \r\n
    82. REST OF EUROPE MILITARY POWER SOLUTIONS MARKET, BY WATTAGE, 2022–2030 (USD MILLION) 76
      1. \r\n
    83. ASIA-PACIFIC MILITARY POWER SOLUTIONS MARKET, BY COUNTRY, 2022–2030 (USD MILLION) 78
      1. \r\n
    84. ASIA-PACIFIC MILITARY POWER SOLUTIONS MARKET, BY TYPE, 2022–2030 (USD MILLION) 79
      1. \r\n
    85. ASIA-PACIFIC MILITARY POWER SOLUTIONS MARKET, BY SOURCE, 2022–2030 (USD MILLION) 80
      1. \r\n
    86. ASIA-PACIFIC MILITARY POWER SOLUTIONS MARKET, BY PLATFORM, 2022–2030 (USD MILLION) 80
      1. \r\n
    87. ASIA-PACIFIC MILITARY POWER SOLUTIONS MARKET, BY WATTAGE, 2022–2030 (USD MILLION) 81
      1. \r\n
    88. CHINA MILITARY POWER SOLUTIONS MARKET, BY TYPE, 2022–2030 (USD MILLION) 82
      1. \r\n
    89. CHINA MILITARY POWER SOLUTIONS MARKET, BY SOURCE, 2022–2030 (USD MILLION) 82
      1. \r\n
    90. CHINA MILITARY POWER SOLUTIONS MARKET, BY PLATFORM, 2022–2030 (USD MILLION) 82
      1. \r\n
    91. CHINA MILITARY POWER SOLUTIONS MARKET, BY WATTAGE, 2022–2030 (USD MILLION) 82
      1. \r\n
    92. JAPAN MILITARY POWER SOLUTIONS MARKET, BY TYPE, 2022–2030 (USD MILLION) 83
      1. \r\n
    93. JAPAN MILITARY POWER SOLUTIONS MARKET, BY SOURCE, 2022–2030 (USD MILLION) 83
      1. \r\n
    94. JAPAN MILITARY POWER SOLUTIONS MARKET, BY PLATFORM, 2022–2030 (USD MILLION) 83
      1. \r\n
    95. JAPAN MILITARY POWER SOLUTIONS MARKET, BY WATTAGE, 2022–2030 (USD MILLION) 83
      1. \r\n
    96. INDIA MILITARY POWER SOLUTIONS MARKET, BY TYPE, 2022–2030 (USD MILLION) 84
      1. \r\n
    97. INDIA MILITARY POWER SOLUTIONS MARKET, BY SOURCE, 2022–2030 (USD MILLION) 84
      1. \r\n
    98. INDIA MILITARY POWER SOLUTIONS MARKET, BY PLATFORM, 2022–2030 (USD MILLION) 84
      1. \r\n
    99. INDIA MILITARY POWER SOLUTIONS MARKET, BY WATTAGE, 2022–2030 (USD MILLION) 84
      1. \r\n
    100. REST OF ASIA-PACIFIC MILITARY POWER SOLUTIONS MARKET, BY TYPE, 2022–2030 (USD MILLION) 85
      1. \r\n
    101. REST OF ASIA-PACIFIC MILITARY POWER SOLUTIONS MARKET, BY SOURCE, 2022–2030 (USD MILLION) 85
      1. \r\n
    102. REST OF ASIA-PACIFIC MILITARY POWER SOLUTIONS MARKET, BY PLATFORM, 2022–2030 (USD MILLION) 85
      1. \r\n
    103. REST OF ASIA-PACIFIC MILITARY POWER SOLUTIONS MARKET, BY WATTAGE, 2022–2030 (USD MILLION) 85
      1. \r\n
    104. REST OF THE WORLD MILITARY POWER SOLUTIONS MARKET, BY COUNTRY, 2022–2030 (USD MILLION) 86
      1. \r\n
    105. REST OF THE WORLD MILITARY POWER SOLUTIONS MARKET, BY TYPE, 2022–2030 (USD MILLION) 87
      1. \r\n
    106. REST OF THE WORLD MILITARY POWER SOLUTIONS MARKET, BY SOURCE, 2022–2030 (USD MILLION) 88
      1. \r\n
    107. REST OF THE WORLD MILITARY POWER SOLUTIONS MARKET, BY PLATFORM, 2022–2030 (USD MILLION) 88
      1. \r\n
    108. REST OF THE WORLD MILITARY POWER SOLUTIONS MARKET, BY WATTAGE, 2022–2030 (USD MILLION) 89
      1. \r\n
    109. MIDDLE EAST & AFRICA MILITARY POWER SOLUTIONS MARKET, BY TYPE, 2022–2030 (USD MILLION) 89
      1. \r\n
    110. MIDDLE EAST & AFRICA MILITARY POWER SOLUTIONS MARKET, BY SOURCE, 2022–2030 (USD MILLION) 90
      1. \r\n
    111. MIDDLE EAST & AFRICA MILITARY POWER SOLUTIONS MARKET, BY PLATFORM, 2022–2030 (USD MILLION) 90
      1. \r\n
    112. MIDDLE EAST & AFRICA MILITARY POWER SOLUTIONS MARKET, BY WATTAGE, 2022–2030 (USD MILLION) 90
      1. \r\n
    113. LATIN AMERICA MILITARY POWER SOLUTIONS MARKET, BY TYPE, 2022–2030 (USD MILLION) 91
      1. \r\n
    114. LATIN AMERICA MILITARY POWER SOLUTIONS MARKET, BY SOURCE, 2022–2030 (USD MILLION) 91
      1. \r\n
    115. LATIN AMERICA MILITARY POWER SOLUTIONS MARKET, BY PLATFORM, 2022–2030 (USD MILLION) 91
      1. \r\n
    116. LATIN AMERICA MILITARY POWER SOLUTIONS MARKET, BY WATTAGE, 2022–2030 (USD MILLION) 91
      1. \r\n
    117. PRODUCT DEVELOPMENT/ANNOUNCEMENT 94
      1. \r\n
    118. PARTNERSHIPS/AGREEMENTS/CONTRACTS/COLLABORATIONS 95
      1. \r\n
    119. CUMMINS INC.: PRODUCTS/SOLUTIONS/SERVICES OFFERED 98
      1. \r\n
    120. CUMMINS INC.: KEY DEVELOPMENTS 98
      1. \r\n
    121. GRESHAM POWER ELECTRONICS LIMITED: PRODUCTS/SOLUTIONS/SERVICES OFFERED 100
      1. \r\n
    122. GRESHAM POWER ELECTRONICS LIMITED: KEY DEVELOPMENTS 100
      1. \r\n
    123. EAGLEPICHER TECHNOLOGIES: PRODUCTS/SOLUTIONS/SERVICES OFFERED 102
      1. \r\n
    124. EAGLEPICHER TECHNOLOGIES : KEY DEVELOPMENTS 103
      1. \r\n
    125. ENERSYS. : PRODUCTS/SOLUTIONS/SERVICES OFFERED 105
      1. \r\n
    126. ENERSYS. : KEY DEVELOPMENTS 105
      1. \r\n
    127. SAFT: PRODUCTS/SOLUTIONS/SERVICES OFFERED 108
      1. \r\n
    128. SAFT: KEY DEVELOPMENTS 108
      1. \r\n
    129. SCHAEFER,INC: PRODUCTS/SOLUTIONS/SERVICES OFFERED 110
      1. \r\n
    130. SCHAEFER,INC: KEY DEVELOPMENTS 111
      1. \r\n
    131. AROTECH CORPORATION: PRODUCTS/SOLUTIONS/SERVICES OFFERED 113
      1. \r\n
    132. SFC ENERGY AG: PRODUCTS/SOLUTIONS/SERVICES OFFERED 115
      1. \r\n
    133. SFC ENERGY AG: KEY DEVELOPMENTS 115
      1. \r\n
    134. RAYTHEON TECHNOLOGIES CORPORATION: PRODUCTS/SOLUTIONS/SERVICES OFFERED 119
      1. \r\n
    135. RAYTHEON TECHNOLOGIES CORPORATION: KEY DEVELOPMENTS 119
      1. \r\n
    136. GS YUASA CORPORATION: PRODUCTS/SOLUTIONS/SERVICES OFFERED 123
      1. \r\n
    137. GS YUASA CORPORATION: KEY DEVELOPMENTS 123
      1. \r\n
      2. \r\n
    138. LIST OF FIGURES
      1. \r\n
    139. MARKET SYNOPSIS 19
      1. \r\n
    140. MARKET ATTRACTIVENESS ANALYSIS: GLOBAL MILITARY POWER SOLUTIONS MARKET 20
      1. \r\n
    141. GLOBAL MILITARY POWER SOLUTIONS MARKET: STRUCTURE 21
      1. \r\n
    142. BOTTOM-UP AND TOP-DOWN APPROACHES 26
      1. \r\n
    143. NORTH AMERICA: MILITARY POWER SOLUTIONS MARKET SIZE & MARKET SHARE, BY COUNTRY(2021 VS 2030) 28
      1. \r\n
    144. EUROPE: MILITARY POWER SOLUTIONS MARKET SIZE & MARKET SHARE, BY COUNTRY(2021 VS 2030) 28
      1. \r\n
    145. ASIA-PACIFIC: MILITARY POWER SOLUTIONS MARKET SIZE & MARKET SHARE, BY COUNTRY(2021 VS 2030) 28
      1. \r\n
    146. REST OF THE WORLD MILITARY POWER SOLUTIONS MARKET SIZE & MARKET SHARE, BY COUNTRY(2021 VS 2030) 29
      1. \r\n
    147. GLOBAL MILITARY POWER SOLUTIONS MARKET: DRIVERS & RESTRAINT 30
      1. \r\n
    148. DRIVER IMPACT ANALYSIS 31
      1. \r\n
    149. RESTRAINT IMPACT ANALYSIS 32
      1. \r\n
    150. VALUE CHAIN ANALYSIS OF THE GLOBAL MILITARY POWER SOLUTIONS MARKET 36
      1. \r\n
    151. PORTER'S FIVE FORCES ANALYSIS OF THE GLOBAL MILITARY POWER SOLUTIONS MARKET 38
      1. \r\n
    152. GLOBAL MILITARY POWER SOLUTIONS MARKET, BY TYPE, 2021 (% SHARE) 41
      1. \r\n
    153. GLOBAL MILITARY POWER SOLUTIONS MARKET, BY TYPE, 2021 VS 2030 (USD MILLION) 41
      1. \r\n
    154. GLOBAL MILITARY POWER SOLUTIONS MARKET, BY SOURCE, 2021 (% SHARE) 43
      1. \r\n
    155. GLOBAL MILITARY POWER SOLUTIONS MARKET, BY SOURCE, 2021 VS 2030 (USD MILLION) 44
      1. \r\n
    156. GLOBAL MILITARY POWER SOLUTIONS MARKET, BY PLATFORM, 2021 (% SHARE) 46
      1. \r\n
    157. GLOBAL MILITARY POWER SOLUTIONS MARKET, BY PLATFORM, 2021 VS 2030 (USD MILLION) 46
      1. \r\n
    158. GLOBAL MILITARY POWER SOLUTIONS MARKET, BY WATTAGE, 2021 (% SHARE) 49
      1. \r\n
    159. GLOBAL MILITARY POWER SOLUTIONS MARKET, BY WATTAGE, 2021 VS 2030 (USD MILLION) 49
      1. \r\n
    160. GLOBAL MILITARY POWER SOLUTIONS MARKET, BY REGION, 2021 (% SHARE) 52
      1. \r\n
    161. GLOBAL MILITARY POWER SOLUTIONS MARKET, BY REGION, 2021 VS 2030 (USD MILLION) 52
      1. \r\n
    162. NORTH AMERICA MILITARY POWER SOLUTIONS MARKET, BY COUNTRY, 2021 (% SHARE) 55
      1. \r\n
    163. NORTH AMERICA MILITARY POWER SOLUTIONS MARKET, BY COUNTRY, 2021 VS 2030 (USD MILLION) 55
      1. \r\n
    164. NORTH AMERICA MILITARY POWER SOLUTIONS MARKET, BY TYPE, 2022-2030 (USD MILLION) 56
      1. \r\n
    165. NORTH AMERICA MILITARY POWER SOLUTIONS MARKET, BY SOURCE, 2022-2030 (USD MILLION) 56
      1. \r\n
    166. NORTH AMERICA MILITARY POWER SOLUTIONS MARKET, BY PLATFORM, 2022-2030 (USD MILLION) 57
      1. \r\n
    167. NORTH AMERICA MILITARY POWER SOLUTIONS MARKET, BY WATTAGE, 2022-2030 (USD MILLION) 58
      1. \r\n
    168. EUROPE MILITARY POWER SOLUTIONS MARKET, BY COUNTRY, 2021 (% SHARE) 61
      1. \r\n
    169. EUROPE MILITARY POWER SOLUTIONS MARKET, BY COUNTRY, 2021 VS 2030 (USD MILLION) 62
      1. \r\n
    170. EUROPE MILITARY POWER SOLUTIONS MARKET, BY TYPE, 2022-2030 (USD MILLION) 62
      1. \r\n
    171. EUROPE MILITARY POWER SOLUTIONS MARKET, BY SOURCE, 2022-2030 (USD MILLION) 63
      1. \r\n
    172. EUROPE MILITARY POWER SOLUTIONS MARKET, BY PLATFORM, 2022-2030 (USD MILLION) 64
      1. \r\n
    173. EUROPE MILITARY POWER SOLUTIONS MARKET, BY WATTAGE, 2022-2030 (USD MILLION) 64
      1. \r\n
    174. ASIA-PACIFIC MILITARY POWER SOLUTIONS MARKET, BY COUNTRY, 2021 (% SHARE) 78
      1. \r\n
    175. ASIA-PACIFIC MILITARY POWER SOLUTIONS MARKET, BY COUNTRY, 2021 VS 2030 (USD MILLION) 78
      1. \r\n
    176. ASIA-PACIFIC MILITARY POWER SOLUTIONS MARKET, BY TYPE, 2022-2030 (USD MILLION) 79
      1. \r\n
    177. ASIA-PACIFIC MILITARY POWER SOLUTIONS MARKET, BY SOURCE, 2022-2030 (USD MILLION) 79
      1. \r\n
    178. ASIA-PACIFIC MILITARY POWER SOLUTIONS MARKET, BY PLATFORM, 2022-2030 (USD MILLION) 80
      1. \r\n
    179. ASIA-PACIFIC MILITARY POWER SOLUTIONS MARKET, BY WATTAGE, 2022-2030 (USD MILLION) 81
      1. \r\n
    180. REST OF THE WORLD MILITARY POWER SOLUTIONS MARKET, BY COUNTRY, 2021 (% SHARE) 86
      1. \r\n
    181. REST OF THE WORLD MILITARY POWER SOLUTIONS MARKET, BY COUNTRY, 2021 VS 2030 (USD MILLION) 86
      1. \r\n
    182. REST OF THE WORLD MILITARY POWER SOLUTIONS MARKET, BY TYPE, 2022-2030 (USD MILLION) 87
      1. \r\n
    183. REST OF THE WORLD MILITARY POWER SOLUTIONS MARKET, BY SOURCE, 2022-2030 (USD MILLION) 87
      1. \r\n
    184. REST OF THE WORLD MILITARY POWER SOLUTIONS MARKET, BY PLATFORM, 2022-2030 (USD MILLION) 88
      1. \r\n
    185. REST OF THE WORLD MILITARY POWER SOLUTIONS MARKET, BY WATTAGE, 2022-2030 (USD MILLION) 89
      1. \r\n
    186. GLOBAL MILITARY POWER SOLUTIONS MARKET: COMPETITIVE BENCHMARKING 93
      1. \r\n
    187. GLOBAL MILITARY POWER SOLUTIONS MARKET: COMPETITIVE BENCHMARKING 94
      1. \r\n
    188. CUMMINS INC.: FINANCIAL OVERVIEW SNAPSHOT 97
      1. \r\n
    189. CUMMINS INC.: SWOT ANALYSIS 99
      1. \r\n
    190. GRESHAM POWER ELECTRONICS LIMITED: SWOT ANALYSIS 101
      1. \r\n
    191. EAGLEPICHER TECHNOLOGIES: SWOT ANALYSIS 103
      1. \r\n
    192. ENERSYS. : FINANCIAL OVERVIEW SNAPSHOT 104
      1. \r\n
    193. ENERSYS.: SWOT ANALYSIS 106
      1. \r\n
    194. SAFT.: FINANCIAL OVERVIEW SNAPSHOT 107
      1. \r\n
    195. SAFT.: SWOT ANALYSIS 109
      1. \r\n
    196. SCHAEFER,INC: SWOT ANALYSIS 111
      1. \r\n
    197. SFC ENERGY AG: FINANCIAL OVERVIEW SNAPSHOT 114
      1. \r\n
    198. SFC ENERGY AG: SWOT ANALYSIS 116
      1. \r\n
    199. RAYTHEON TECHNOLOGIES CORPORATION.: FINANCIAL OVERVIEW SNAPSHOT 118
      1. \r\n
    200. RAYTHEON TECHNOLOGIES CORPORATION.: SWOT ANALYSIS 120
      1. \r\n
    201. GS YUASA CORPORATION: FINANCIAL OVERVIEW SNAPSHOT 122
      1. \r\n
    202. GS YUASA CORPORATION.: SWOT ANALYSIS 124
      1. \r\n
      2. \r\n"

    Military Power Solutions Market Segmentation

    Market Segmentation Overview

    • Detailed segmentation data will be available in the full report
    • Comprehensive analysis by multiple parameters
    • Regional and country-level breakdowns
    • Market size forecasts by segment
    Infographic

    Free Sample Request

    Kindly complete the form below to receive a free sample of this Report

    Get Free Sample

    Customer Strories

    “I am very pleased with how market segments have been defined in a relevant way for my purposes (such as "Portable Freezers & refrigerators" and "last-mile"). In general the report is well structured. Thanks very much for your efforts.”

    Victoria Milne

    Founder
    Case Study
    Chemicals and Materials