Industrial Waste Management Market Summary
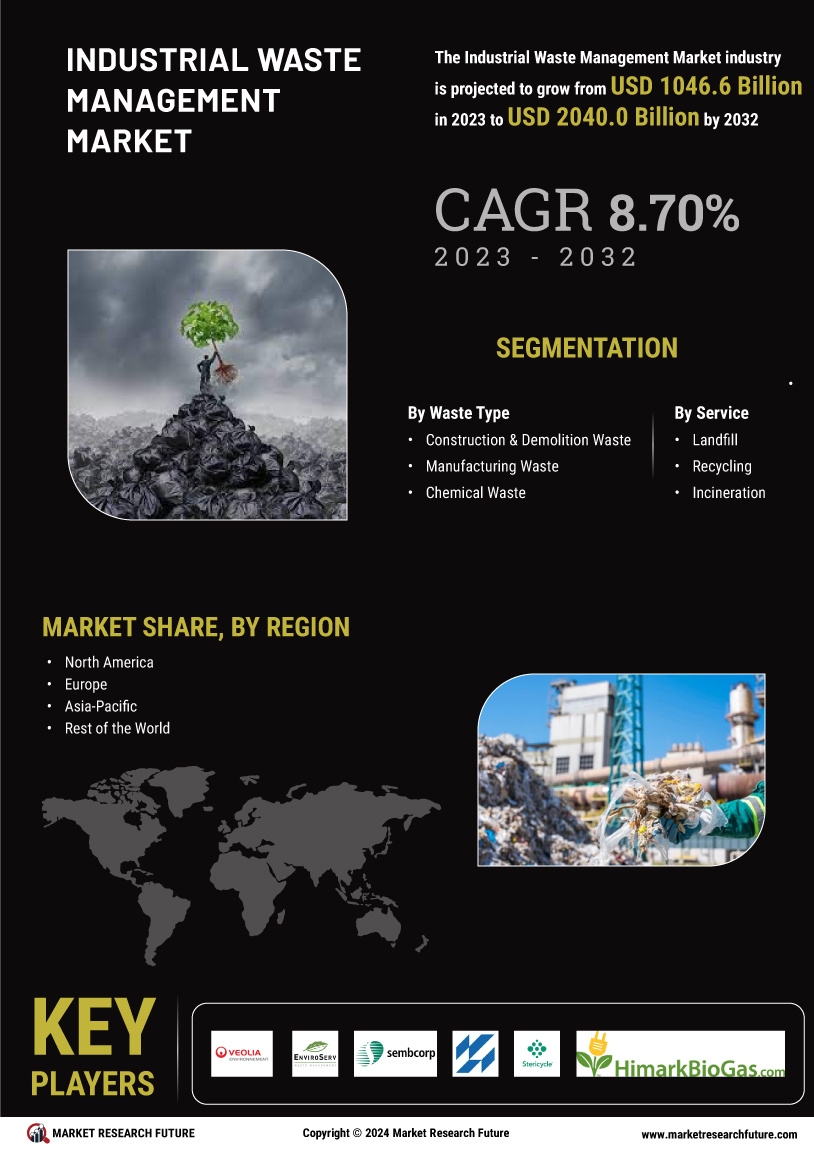
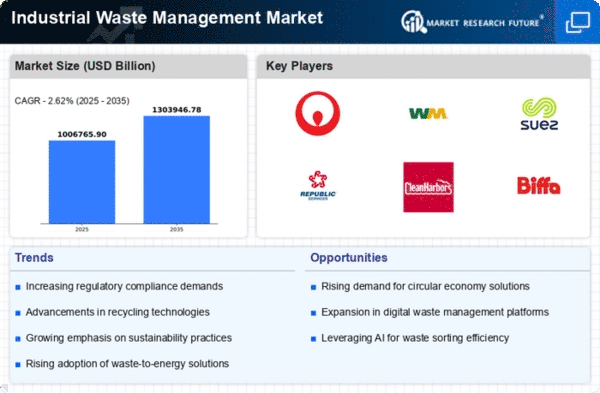
As per MRFR Analysis, the Global Industrial Waste Management Market was valued at USD 9,49,663.43 Billion in 2023 and is projected to reach USD 12,09,180.4 Billion by 2032, growing at a CAGR of 2.6% from 2024 to 2032. Key drivers include increasing public awareness of environmental impacts and advancements in waste management techniques. The market is influenced by rising industrial activities and government regulations promoting sustainable practices.
Key Market Trends & Highlights
The Industrial Waste Management Market is witnessing significant growth due to various factors.
- Market Size in 2023: USD 9,49,663.43 Billion
- Projected Market Size by 2032: USD 12,09,180.4 Billion
- CAGR from 2024 to 2032: 2.6%
- Construction and Demolition Waste is one of the fastest-growing segments.
Market Size & Forecast
2023 Market Size: USD 9,49,663.43 Billion
2024 Market Size: USD 9,81,062.07 Billion
2032 Market Size: USD 12,09,180.4 Billion
CAGR (2024-2032): 2.6%
Largest Regional Market Share in 2024: North America.
Major Players
Key players include Veolia Environmental, SembCorp, Reclay Group, Suez Environnement, Stericycle Inc., and Clean Harbor.
Increasing public awareness of the negative environmental effects of industrial waste and advancements in industrial waste management techniques are the key market drivers enhancing the market growth.

Source: Secondary Research, Primary Research, MRFR Database and Analyst Review
Industrial Waste Management Market Trends
Growing Number of Industries around the World to Boost Market Growth
Market CAGR for industrial waste management is being driven by the growing number of industries around the world. Globally, urbanization and industrialisation are on the rise. Waste management awareness is quickly growing in the sector, as are technological developments in recycling facilities. In India, roughly 60% of trash was treated in 2020, compared to 28.57% in 2018.
Aerospace and defence, automotive, electronics, oil and gas, food and beverage, biotechnology, and other industries are expanding their industrial verticals. Industrial waste creation is increasing worldwide as the number of industries expands. This growing waste is a major issue for people and governments globally. This creates a huge global requirement for appropriate waste management.
In addition, as consumers become more aware of the harmful effects of industrial waste on the environment and public health, industries are under increasing pressure to implement more sustainable waste management procedures. As a result, there is a growing need for waste management services that may assist businesses in reducing their environmental footprint and promoting responsible waste management practices.Â
As a result, waste management firms are investing in innovative technologies and procedures in order to address the growing demand for environmentally friendly waste management solutions. Furthermore, businesses that practice sustainable waste management can profit from improved brand recognition and increased consumer loyalty, which can help them acquire a competitive advantage in the market.
Government regulations are one of the key drivers of the industrial waste disposal market. Governments around the world are increasingly enacting legislation and policies targeted at decreasing industrial waste and supporting sustainable waste management techniques. For example, the European Union has established various directives targeted at minimizing trash output and boosting recycling and reuse. Similarly, in the United States, the Environmental Protection Agency (EPA) has adopted a number of rules aimed at minimizing hazardous waste and promoting appropriate waste management practices.
These rules have resulted in a large increase in demand for industrial waste management services such as garbage collection, transportation, treatment, and disposal. As a result, waste management firms are investing in innovative technologies and procedures in order to address the growing demand for environmentally friendly waste management solutions. Companies that embrace sustainable waste management techniques can benefit from cost savings and greater operational efficiency in addition to meeting regulatory obligations.
Overall, the growing emphasis on environmentally friendly waste management procedures is projected to fuel growth in the industrial waste services market.
Industrial Waste Management Market Segment Insights:
Industrial Waste Management Waste Type Insights
The Industrial Waste Management Market segmentation, based on Waste Type includes construction & demolition waste, manufacturing waste, chemical waste, mining waste, oil & gas waste, agriculture waste, nuclear waste and others. The construction and demolition waste segment is one of the fastest-growing categories in the industrial waste management market. This is due to a variety of reasons, including increased urbanization, construction activity, and policies aimed at minimizing trash output and promoting recycling and reuse.
As a result, waste management firms are investing in innovative technologies and procedures to address the growing need for sustainable waste management solutions in this area. Furthermore, the construction and demolition waste management industry has tremendous potential for recycling and recovery of valuable materials, which can help reduce waste and foster a circular economy.
Industrial Waste Management Service Insights
The construction waste management Market segmentation, based on Service, includes landfill, Recycling Equipment , incineration. In 2022, the landfill segment held a significant share. Environmental consciousness is increasing all throughout the world. A landfill is a pit filled with solid garbage. It is small in size and is maintained and covered for final disposal.
Landfills help to prevent groundwater pollution because they ultimately harm the environment and human life. The landfill, when properly managed, provides an efficient disposal option. In 2018, approximately 146.1 million tonnes of municipal solid waste scrap were landfilled. The world's need for landfills is soaring, which is driving growth during the forecast period.
Figure 1: Industrial Waste Management Market, by Service, 2024 & 2032 (USD Billion)

Source: Secondary Research, Primary Research, MRFR Database and Analyst Review
Industrial Waste Management Regional Insights
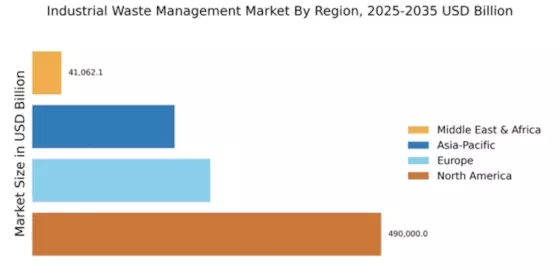
By region, the study provides the market insights into North America, Europe, Asia-Pacific and Rest of the World. The North American Industrial Waste Management Market area will dominate this market, due to increasing awareness of environmental issues and the necessity for sustainable waste management procedures.
Further, the major countries studied in the market report are The US, Canada, German, France, the UK, Italy, Spain, China, Japan, India, Australia, South Korea, and Brazil.
Figure 2: Industrial Waste Management Market Share By Region 2022 (USD Billion)

Source: Secondary Research, Primary Research, MRFR Database and Analyst Review
Europe Industrial Waste Management Market accounts for the second-largest market share because of stringent restrictions aimed at minimizing waste generation and supporting environmentally sound waste management techniques. Further, the German Industrial Waste Management Market held the largest market share, and the UK Industrial Waste Management Market was the fastest growing market in the European region
The Asia-Pacific Industrial Waste Management Market is expected to grow at the fastest CAGR from 2023 to 2032. This is due to increased economic activity, which eventually leads to an increase in rubbish output and a rise in demand for waste management. Moreover, China’s Waste Management Market held the largest market share, and the Indian Industrial Waste Management Market was the fastest growing market in the Asia-Pacific region.
Industrial Waste Management Key Market Players & Competitive Insights
Leading market players are investing heavily in research and development in order to expand their product lines, which will help the Industrial Waste Management Market, grow even more. Market participants are also undertaking a variety of strategic activities to expand their global footprint, with important market developments including new product launches, contractual agreements, mergers and acquisitions, higher investments, and collaboration with other organizations. To expand and survive in a more competitive and rising market climate, Industrial Waste Management industry must offer cost-effective items.
Manufacturing locally to minimize operational costs is one of the key business tactics used by manufacturers in the global Industrial Waste Management industry to benefit clients and increase the market sector. In recent years, the Industrial Waste Management industry has offered some of the most significant advantages to medicine. Major players in the hazardous waste disposal Market, including SembCorp, Reclay Group, SA Waste Holding Pvt Ltd., Suez Environnement, Stericycle Inc., Himark BioGas Inc., and Clean Harbor and others, are attempting to increase market demand by investing in research and development operations.
Suez SA is a utility business located in France that primarily engages in the water and waste management industries. The company's headquarters are in La Défense, Paris. All of the group's brands became SUEZ in 2015. Formerly an operating subsidiary of Suez, the company was split off as a separate organization on July 22, 2008, as part of the merger that formed GDF Suez (now Engie).Â
Engie retained its 35% interest as the company's major stakeholder. Suez Environnement's stock price increased by 40% on the first day of trading. September 2022, SUEZ, Royal Bafokeng Holdings (RBH), and African Infrastructure Investment Managers (AIM) completed the acquisition of EnviroServ Proprietary Holdings Limited and its subsidiaries. Suez will be able to consolidate its position as a leading international municipal and industrial waste management firm as a result of this acquisition. This will also allow Suze to improve its market position across the African continent.
Veolia Environnement S.A., also known as Veolia, is a French multinational corporation that operates in three major service and utility areas historically administered by public authorities: water management, waste management, and energy services. Until January 2019, it also controlled transportation services through its subsidiary Veolia Transport (after Transdev).
Veolia will employ 220,000 people in 58 countries by 2022. Its revenue for that year was €42,885 billion. It is traded on the Euronext Paris exchange. Its headquarters are located in Aubervilliers. June 2022, Veolia suggested the sale of Suez's UK waste business and continues to create the worldwide champion of ecological change. The initiative seeks to be an ecological transformation by bringing together Veolia and the majority of Suez's overseas businesses.
Key Companies in the Industrial Waste Management market include
- SA Waste Holding Pvt Ltd.
Industrial Waste Management Industry Developments
July 2023- A Singapore-based waste management and upcycling company, Blue Planet Environmental Solutions, has raised USD5 million in fresh funding, per the filings with the Accounting Corporate and Regulatory Authority (ACRA) accessed by DealStreetAsia's Data Vantage. The newest funding came from Exacta Asia Investment II LP, a USD 250-million private equity fund concentrated on small and medium-sized enterprises managed by Singapore-based Mizuho Asia Partners.
The filings pointed out that the private equity fund provided USD5 million in exchange for 667,126 ordinary shares in the organization with offices in India, Britain, Vietnam, and Malaysia. ACRA filings imply that the equity funding attained so far in a round and the general funding round could be bigger and have other components, such as debt. DealStreetAsia has reached out to Blue Planet for confirmation.Â
The newest funding followed the USD 1.9 million investment the waste management company gained from private equity firm Kaizenvest in June and another investor in February.July 2023- Aerofloat has played a crucial part in assisting the Australian plastic recycling industry clean and reuse its wastewater. The plastics recycling industry has flourished in Australia since the National Plastics Plan was enacted in 2021.
The General Manager of wastewater treatment of Aerofloat, Michael Anderson, stated that the plan's goal was to guarantee Australia becomes a foremost participant in the global network for recycling plastics into consumer products. Aerofloat has been operating in the plastics recycling industry for eight years, developing major wash water and wastewater solutions that fulfill the particular criteria of multiple companies and councils across the eastern board.Â
The firm has achieved awards for its innovative designs and is now the industry's go-to wastewater engineering firm in Australia. Following the National Plastics Plan proclamation, Coca-Cola Europacific Partners, Asahi Beverages, Cleanaway, and Pact Group formed a joint venture known as Circular Plastics Australia.Â
April 2022,Frank Solutions Limited has purchased Viridor's landfill and landfill gas operations. The agreement, which was signed in late March 2022, comprised the operation and management of 44 facilities across the United Kingdom. Viridor will be able to continue growing its core energy recovery and polymer processing businesses while progressing its objectives to achieve net zero by 2040 as a result of the sale.
November 2021,Waste Management Inc. announced plans to invest USD $200 million in recycling infrastructure in 2022, bringing the company's total investment in new and renovated recycling facilities to more than USD 700 million since 2018. With the demand for recycled content goods increasing, the investment will allow WM to capture more recycled materials and expand customer access to recycling.
October 2021,REMONDIS International GmbH acquired 100% of Veolia Recycling Solutions Nordic AB. REMONDIS is improving its market position in Northern Europe and significantly increasing its commercial activities in the Swedish market as a result of this acquisition. The purchase also signals the company's entry into the Swedish industrial cleaning market.
Report Attribute/Metric |
Details |
Market Size 2023 |
USD 9,49,663.43 Billion |
Market Size 2024 |
USD 9,81,062.07 Billion |
Market Size 2032 |
USD 12,09,180.4 Billion |
Compound Annual Growth Rate (CAGR) |
2.6% (2024-2032) |
Base Year |
2023 |
Market Forecast Period |
2024-2032 |
Historical Data |
2018- 2022 |
Market Forecast Units |
Value (USD Billion) |
Report Coverage |
Revenue Forecast, Market Competitive Landscape, Growth Factors, and Trends |
Segments Covered |
Waste Type, Service, and Region |
Geographies Covered |
North America, Europe, AsiaPacific, and the Rest of the World |
Countries Covered |
The US, Canada, German, France, UK, Italy, Spain, China, Japan, India, Australia, South Korea, and Brazil |
Key Companies Profiled |
Veolia Environmental, EnviroServ Waste, SembCorp, Reclay Group, SA Waste Holding Pvt Ltd., Suez Environnement, Stericycle Inc., Himark BioGas Inc., and Clean Harbor. |
Key Market Opportunities |
Government Regulations Are Strict. |
Key Market Dynamics |
Technological advancements in industrial waste management |
Industrial Waste Management Market Highlights:
Frequently Asked Questions (FAQ):
The Industrial Waste Management Market size was valued at USD 9,49,663.43 Billion in 2023.
The global market is projected to grow at a CAGR of 2.6% during the forecast period, 2024-2032.
North America had the largest share in the global market
The key players in the market are SembCorp, Reclay Group, SA Waste Holding Pvt Ltd., Suez Environnement, Stericycle Inc., Himark BioGas Inc., and Clean Harbor.
The landfill category dominated the market in 2022.
The construction & demolition waste had the largest share in the global market.
TABLE OF CONTENTS
1. EXECUTIVE SUMMARY
2. MARKET INTRODUCTION
2.1. Definition
2.2. Scope of the Study
2.3. Market Structure
2.4. Key Buying Criteria
2.5. Macro Factor Analysis
3. RESEARCH METHODOLOGY
3.1. Research Process
3.2. Primary Research
3.3. Secondary Research
3.4. Market Size Estimation
3.5. Forecast Model
3.6. List of Assumptions
4. Industrial Waste Management Market DYNAMICS
4.1. Introduction
4.2. Drivers
4.2.1. Stringent Regulations of Governments Worldwide for Better Management of Waste
4.2.2. Strong Focus of Several Governments to Conduct Awareness Programs Showcasing importance of waste Segregation and Waste Management
4.3. Restraints
4.3.1. High Waste Disposal Cost
4.4. Opportunities
4.4.1. Rising Demand for Waste Management Services from Emerging Economies due to Rapid Industrialization
4.4.2. Growing Adoption of Construction and Demolition (C&D) Materials in Urban Areas with Rising Number of Construction Projects
4.5. Covid 19 Impact Analysis
4.5.1. Impact on Overall Industry
4.5.1.1. Economic Impact
4.5.2. Impact on Market
4.5.3. Impact on Market Demand
4.5.3.1. Impact due to restrictions/lockdown
4.5.3.2. Consumer Sentiments
4.5.4. Impact on Pricing
5. Industrial Waste Management Market FACTOR ANALYSIS
5.1. Porter’s Five Forces Model
5.1.1. Bargaining Power of Suppliers
5.1.2. Bargaining Power of Buyers
5.1.3. Threat of New Entrants
5.1.4. Threat of Substitutes
5.1.5. Intensity of Rivalry
6. Industrial Waste Management Market ESTIMATES & FORECAST, BY TYPE
6.1. Introduction
6.2. Hazardous
6.3. Non-Hazardous
7. Industrial Waste Management Market ESTIMATES & FORECAST, BY WASTE TYPE
7.1. Introduction
7.2. Construction & Demolition Waste
7.3. Manufacturing Waste
7.4. Chemical Waste
7.5. Mining Waste
7.6. Oil & Gas Waste
7.7. Agriculture Waste
7.8. Nuclear Waste
7.9. Others
8. Industrial Waste Management Market ESTIMATES & FORECAST, BY SERVICE
8.1. Introduction
8.2. Landfill
8.3. Recycling
8.4. Incineration
9. Industrial Waste Management Market ESTIMATES & FORECAST, BY REGION
9.1. Introduction
9.2. North America
9.2.1. by Type (USD Billion, 2018 -2032)
9.2.2. by Service (USD Billion, 2018 -2032)
9.2.3. by Waste Type (USD Billion, 2018 -2032)
9.2.4. US
9.2.4.1. US Market by Type (USD Billion, 2018 -2032)
9.2.4.2. US Market by Service (USD Billion, 2018 -2032)
9.2.4.3. US Market by Waste Type (USD Billion, 2018 -2032)
9.2.5. Canada
9.2.5.1. Canada Market by Type (USD Billion, 2018 -2032)
9.2.5.2. Canada Market by Service (USD Billion, 2018 -2032)
9.2.5.3. Canada Market by Waste Type (USD Billion, 2018 -2032)
9.2.6. Mexico
9.2.6.1. Mexico Market by Type (USD Billion, 2018 -2032)
9.2.6.2. Mexico Market by Service (USD Billion, 2018 -2032)
9.2.6.3. Mexico Market by Waste Type (USD Billion, 2018 -2032)
9.3. Europe
9.3.1. Europe Market by Type (USD Billion, 2018 -2032)
9.3.2. Europe Market by Service (USD Billion, 2018 -2032)
9.3.3. Europe Market by Waste Type (USD Billion, 2018 -2032)
9.3.4. Germany
9.3.4.1. Germany Market by Type (USD Billion, 2018 -2032)
9.3.4.2. Germany Market by Service (USD Billion, 2018 -2032)
9.3.4.3. Germany Market by Waste Type (USD Billion, 2018 -2032)
9.3.5. France
9.3.5.1. France Market by Type (USD Billion, 2018 -2032)
9.3.5.2. France Market by Service (USD Billion, 2018 -2032)
9.3.5.3. France Market by Waste Type (USD Billion, 2018 -2032)
9.3.6. UK
9.3.6.1. UK Market by Type (USD Billion, 2018 -2032)
9.3.6.2. UK Market by Service (USD Billion, 2018 -2032)
9.3.6.3. UK Market by Waste Type (USD Billion, 2018 -2032)
9.3.7. Italy
9.3.7.1. Italy Market by Type (USD Billion, 2018 -2032)
9.3.7.2. Italy Market by Service (USD Billion, 2018 -2032)
9.3.7.3. Italy Market by Waste Type (USD Billion, 2018 -2032)
9.3.8. Spain
9.3.8.1. Spain Market by Type (USD Billion, 2018 -2032)
9.3.8.2. Spain Market by Service (USD Billion, 2018 -2032)
9.3.8.3. Spain Market by Waste Type (USD Billion, 2018 -2032)
9.3.9. Rest of Europe
9.3.9.1. Rest of Europe Market by Type (USD Billion, 2018 -2032)
9.3.9.2. Rest of Europe Market by Service (USD Billion, 2018 -2032)
9.3.9.3. Rest of Europe Market by Waste Type (USD Billion, 2018 -2032)
9.4. Asia-Pacific
9.4.1. Asia-Pacific Market by Type (USD Billion, 2018 -2032)
9.4.2. Asia-Pacific Market by Service (USD Billion, 2018 -2032)
9.4.3. Asia-Pacific Market by Waste Type (USD Billion, 2018 -2032)
9.4.4. China
9.4.4.1. China Market by Type (USD Billion, 2018 -2032)
9.4.4.2. China Market by Service (USD Billion, 2018 -2032)
9.4.4.3. China by Waste Type (USD Billion, 2018 -2032)
9.4.5. India
9.4.5.1. India Market by Type (USD Billion, 2018 -2032)
9.4.5.2. India Market by Service (USD Billion, 2018 -2032)
9.4.5.3. India Market by Waste Type (USD Billion, 2018 -2032)
9.4.6. Japan
9.4.6.1. Japan Market by Type (USD Billion, 2018 -2032)
9.4.6.2. Japan Market by Service (USD Billion, 2018 -2032)
9.4.6.3. Japan Market by Waste Type (USD Billion, 2018 -2032)
9.4.7. South Korea
9.4.7.1. South Korea Market by Type (USD Billion, 2018 -2032)
9.4.7.2. South Korea Market by Service (USD Billion, 2018 -2032)
9.4.7.3. South Korea Market by Waste Type (USD Billion, 2018 -2032)
9.4.8. Australia
9.4.8.1. Australia Market by Type (USD Billion, 2018 -2032)
9.4.8.2. Australia Market by Service (USD Billion, 2018 -2032)
9.4.8.3. Australia Market by Waste Type (USD Billion, 2018 -2032)
9.4.9. Rest of Asia-Pacific
9.4.9.1. Rest of Asia-Pacific Market by Type (USD Billion, 2018 -2032)
9.4.9.2. Rest of Asia-Pacific Market by Service (USD Billion, 2018 -2032)
9.4.9.3. Rest of Asia-Pacific Market by Waste Type (USD Billion, 2018 -2032)
9.5. Middle East and Africa
9.5.1. Middle East and Africa Market by Type (USD Billion, 2018 -2032)
9.5.2. Middle East and Africa Market by Service (USD Billion, 2018 -2032)
9.5.3. Middle East and Africa Market by Waste Type (USD Billion, 2018 -2032)
9.5.4. Saudi Arabia
9.5.4.1. Saudi Arabia Market by Type (USD Billion, 2018 -2032)
9.5.4.2. Saudi Arabia Market by Service (USD Billion, 2018 -2032)
9.5.4.3. Saudi Arabia Market by Waste Type (USD Billion, 2018 -2032)
9.5.5. South Africa
9.5.5.1. South Africa Market by Type (USD Billion, 2018 -2032)
9.5.5.2. South Africa Market by Service (USD Billion, 2018 -2032)
9.5.5.3. South Africa Market by Waste Type (USD Billion, 2018 -2032)
9.5.6. UAE
9.5.6.1. UAE Market by Type (USD Billion, 2018 -2032)
9.5.6.2. UAE Market by Service (USD Billion, 2018 -2032)
9.5.6.3. UAE Market by Waste Type (USD Billion, 2018 -2032)
9.5.7. Rest of MEA
9.5.7.1. Rest of MEA Market by Type (USD Billion, 2018 -2032)
9.5.7.2. Rest of MEA Market by Service (USD Billion, 2018 -2032)
9.5.7.3. Rest of MEA Market by Waste Type (USD Billion, 2018 -2032)
9.6. South America
9.6.1. South America Market by Type (USD Billion, 2018 -2032)
9.6.2. South America Market by Service (USD Billion, 2018 -2032)
9.6.3. South America Market by Waste Type (USD Billion, 2018 -2032)
9.6.4. Brazil
9.6.4.1. Brazil Market by Type (USD Billion, 2018 -2032)
9.6.4.2. Brazil Market by Service (USD Billion, 2018 -2032)
9.6.4.3. Brazil Market by Waste Type (USD Billion, 2018 -2032)
9.6.5. Argentina
9.6.5.1. Argentina Market by Type (USD Billion, 2018 -2032)
9.6.5.2. Argentina Market by Service (USD Billion, 2018 -2032)
9.6.5.3. Argentina Market by Waste Type (USD Billion, 2018 -2032)
9.6.6. Rest of South America
9.6.6.1. Rest of South America Market by Type (USD Billion, 2018 -2032)
9.6.6.2. Rest of South America Market by Service (USD Billion, 2018 -2032)
9.6.6.3. Rest of South America Market by Waste Type (USD Billion, 2018 -2032)
10. COMPETITIVE LANDSCAPE
10.1. Introduction
10.2. Key Players Market Share Analysis, 2022 (%)
10.3. Competitive Benchmarking
10.4. Competitor Dashboard
10.5. Major Growth Strategy in the Market
10.6. Key Developments & Growth Strategies
10.6.1. New Product Development
10.6.2. Mergers & Acquisitions
10.6.3. Contracts & Agreements
10.6.4. Expansions & Investments
11. COMPANY PROFILES
11.1. Daiseki Co., Ltd.
11.1.1. Company Overview
11.1.2. Financial Overview
11.1.3. Products Offered
11.1.4. Key Developments
11.1.5. SWOT Analysis
11.1.6. Key Strategies
11.2. Veolia Environmental Inc.
11.2.1. Company Overview
11.2.2. Financial Overview
11.2.3. Products Offered
11.2.4. Key Developments
11.2.5. SWOT Analysis
11.2.6. Key Strategies
11.3. EnviroServ Waste
11.3.1. Company Overview
11.3.2. Financial Overview
11.3.3. Products Offered
11.3.4. Key Developments
11.3.5. SWOT Analysis
11.3.6. Key Strategies
11.4. SembCorp
11.4.1. Company Overview
11.4.2. Financial Overview
11.4.3. Products Offered
11.4.4. Key Developments
11.4.5. SWOT Analysis
11.4.6. Key Strategies
11.5. Reclay Group
11.5.1. Company Overview
11.5.2. Financial Overview
11.5.3. Products Offered
11.5.4. Key Developments
11.5.5. SWOT Analysis
11.5.6. Key Strategies
11.6. SA Waste Holding Pvt Ltd.
11.6.1. Company Overview
11.6.2. Financial Overview
11.6.3. Products Offered
11.6.4. Key Developments
11.6.5. SWOT Analysis
11.6.6. Key Strategies
11.7. Suez Environnement
11.7.1. Company Overview
11.7.2. Financial Overview
11.7.3. Products Offered
11.7.4. Key Developments
11.7.5. SWOT Analysis
11.7.6. Key Strategies
11.8. Stericycle Inc.
11.8.1. Company Overview
11.8.2. Financial Overview
11.8.3. Products Offered
11.8.4. Key Developments
11.8.5. SWOT Analysis
11.8.6. Key Strategies
11.9. Himark BioGas Inc.
11.9.1. Company Overview
11.9.2. Financial Overview
11.9.3. Products Offered
11.9.4. Key Developments
11.9.5. SWOT Analysis
11.9.6. Key Strategies
11.10. Clean Harbor
11.10.1. Company Overview
11.10.2. Financial Overview
11.10.3. Products Offered
11.10.4. Key Developments
11.10.5. SWOT Analysis
11.10.6. Key Strategies
LIST OF TABLES
TABLE 1.MARKET, BY REGION, 2018 -2032
TABLE 2. NORTH AMERICA: MARKET, BY TYPE, 2018 -2032
TABLE 3. NORTH AMERICA: MARKET, BY WASTE TYPE, 2018 -2032
TABLE 4. NORTH AMERICA: MARKET, BY SERVICE, 2018 -2032
TABLE 5. EUROPE: MARKET, BY TYPE, 2018 -2032
TABLE 6. EUROPE: MARKET, BY WASTE TYPE, 2018 -2032
TABLE 7. EUROPE: MARKET, BY SERVICE, 2018 -2032
TABLE 8. ASIA PACIFIC: MARKET, BY TYPE, 2018 -2032
TABLE 9. ASIA PACIFIC: MARKET, BY WASTE TYPE, 2018 -2032
TABLE 10. ASIA PACIFIC: MARKET, BY SERVICE, 2018 -2032
TABLE 11. MIDDLE EAST AND AFRICA: MARKET, BY TYPE, 2018 -2032
TABLE 12. MIDDLE EAST AND AFRICA: MARKET, BY WASTE TYPE, 2018 -2032
TABLE 13. MIDDLE EAST AND AFRICA: MARKET, BY SERVICE, 2018 -2032
TABLE 14. SOUTH AMERICA: MARKET, BY TYPE, 2018 -2032
TABLE 15. SOUTH AMERICA: MARKET, BY WASTE TYPE, 2018 -2032
TABLE 16. SOUTH AMERICA: MARKET, BY SERVICE, 2018 -2032
LIST OF FIGURES
FIGURE 1. MARKET SYNOPSIS
FIGURE 2. MARKET ATTRACTIVENESS ANALYSIS: GLOBAL MARKET
FIGURE 3. GLOBAL MARKET ANALYSIS BY TYPE
FIGURE 4. GLOBAL MARKET ANALYSIS BY WASTE TYPE
FIGURE 5. GLOBAL MARKET ANALYSIS BY SERVICE
FIGURE 6. GLOBAL MARKET ANALYSIS BY REGION
FIGURE 7. MARKET: STRUCTURE
FIGURE 8. RESEARCH PROCESS OF MRFR
FIGURE 9. TOP-DOWN AND BOTTOM-UP APPROACHES
FIGURE 10. MARKET DYNAMICS: MARKET
FIGURE 11. DRIVERS: IMPACT ANALYSIS
FIGURE 12. RESTRAINT: IMPACT ANALYSIS
FIGURE 13. SUPPLY / VALUE CHAIN: GLOBAL MARKET
FIGURE 14. PORTER'S FIVE FORCES ANALYSIS: MARKET
FIGURE 15. MARKET, BY TYPE, 2022 (% SHARE)
FIGURE 16. MARKET, BY WASTE TYPE, 2022 (% SHARE)
FIGURE 17. MARKET, BY SERVICE, 2022 (% SHARE)
FIGURE 18. MARKET SHARE, BY REGION, 2022 (% SHARE)
FIGURE 19. NORTH AMERICA: MARKET SHARE, BY COUNTRY, 2022 (% SHARE)
FIGURE 20. EUROPE: MARKET SHARE, BY COUNTRY, 2022 (% SHARE)
FIGURE 21. ASIA PACIFIC: MARKET SHARE, BY COUNTRY, 2022 (% SHARE)
FIGURE 22. MIDDLE EAST AND AFRICA: MARKET SHARE, BY COUNTRY, 2022 (% SHARE)
FIGURE 23. SOUTH AMERICA: MARKET SHARE, BY COUNTRY, 2022 (% SHARE)
FIGURE 24. MAJOR MANUFACTURERS MARKET SHARE ANALYSIS, 2022
FIGURE 25. CONTRACTS & AGREEMENTS: THE MAJOR STRATEGY ADOPTED BY KEY PLAYERS IN THE MARKET
FIGURE 26. DAISEKI CO., LTD.: FINANCIAL OVERVIEW SNAPSHOT
FIGURE 27. DAISEKI CO., LTD.: SWOT ANALYSIS
FIGURE 28. VEOLIA ENVIRONMENTAL INC.: FINANCIAL OVERVIEW SNAPSHOT
FIGURE 29. VEOLIA ENVIRONMENTAL INC.: SWOT ANALYSIS
FIGURE 30. ENVIROSERV WASTE: FINANCIAL OVERVIEW SNAPSHOT
FIGURE 31. ENVIROSERV WASTE: SWOT ANALYSIS
FIGURE 32. SEMBCORP: FINANCIAL OVERVIEW SNAPSHOT
FIGURE 33. SEMBCORP: SWOT ANALYSIS
FIGURE 34. RECLAY GROUP: FINANCIAL OVERVIEW SNAPSHOT
FIGURE 35. RECLAY GROUP: SWOT ANALYSIS
FIGURE 36. SA WASTE HOLDING PVT LTD.: FINANCIAL OVERVIEW SNAPSHOT
FIGURE 37. SA WASTE HOLDING PVT LTD.: SWOT ANALYSIS
FIGURE 38. SUEZ ENVIRONNEMENT: FINANCIAL OVERVIEW SNAPSHOT
FIGURE 39. SUEZ ENVIRONNEMENT: SWOT ANALYSIS
FIGURE 40. STERICYCLE INC.: FINANCIAL OVERVIEW SNAPSHOT
FIGURE 41. STERICYCLE INC.: SWOT ANALYSIS
FIGURE 42. HIMARK BIOGAS INC.: FINANCIAL OVERVIEW SNAPSHOT
FIGURE 43. HIMARK BIOGAS INC.: SWOT ANALYSIS
FIGURE 44. CLEAN HARBOR: FINANCIAL OVERVIEW SNAPSHOT
FIGURE 45. CLEAN HARBOR: SWOT ANALYSIS