ID: MRFR/PNT/1732-HCR | February 2021 | Region: Global | 111 pages
Market Scenario
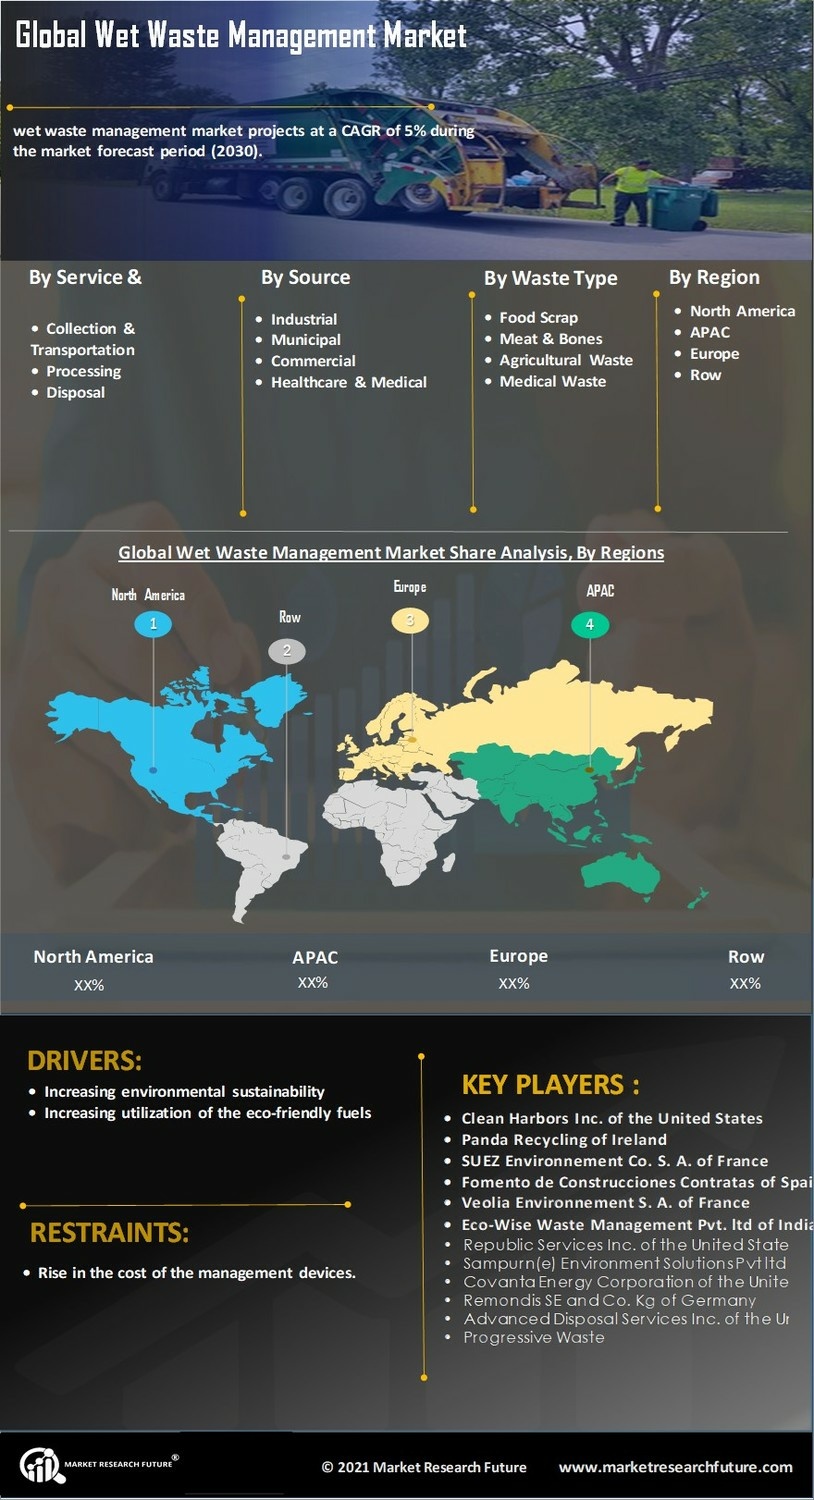
Wet waste is the organic waste, which is usually heavy in weight due to dampness and can be isolated on the basis of biodegradable and non-biodegradable waste. Wet waste primarily comprises of food scrap, meat &bones, agricultural waste, medical waste, shredded paper, and others. Wet waste management is a process of composting the waste for the production of manure, biogas, etc. Moreover, composting is a process of crushing down the organic matter in the presence of air. Compost is the end product of composting, usually rich in readily usable plant nutrients forming a part of the fertile soil. Additionally, removal of waste from public areas helps in reducing risks associated with health and hygiene, diminishing exposure to biohazards and also diminishes infestation of pests. Wet waste management also produces waste energy, which can be further utilized and deployed to generate electricity.
Growing awareness for the wet waste management is a vital factor propelling the global wet waste management market. Additionally, the introduction of new wet waste management technologies such as waste to energy solutions is further augmenting the overall growth of the wet waste management market. Increasing environmental sustainability and increasing utilization of the eco-friendly fuels are the prime elements driving the growth of the global wet waste management market. Growing government initiatives to spread wet waste management awareness among the population is further anticipated to boost the overall global wet waste management market over the forecast period.
Global wet waste management market is segmented based on service & equipment, source, waste type, and region. Based on the service & equipment, the market is segmented into collection & transportation, storage, sorting, processing, and disposal & landfill. The processing is projected to dominate the global wet waste management market and is likely to continue over the forecast period, 2017-2023 due to growing population, coupled with growing waste generation and management services. Based on the source, the market is segmented into household & municipal waste, commercial waste, industrial waste, healthcare & medical waste, and other waste. The household & municipal waste dominated the market in 2016 and is projected to be the fastest-growing source over the review period. The global increase in the urbanization with humongous population growth is creating a wide scope household & municipal waste generation. Based on the waste type, the market is segmented into food scrap, meat & bones, agricultural waste, medical waste, shredded paper, and others. The food wastage is considered as one of the major problems across the world, a huge amount of food is wasted across the world through the residential and commercial sector. Thus, making food scrap as a prominent segment as a waste type in global wet waste management market.
The wet waste management industry is expected to have a vast number of new participants over the forecast period owing to continuous expansions in packaging industry coupled with rising consumer preferences for high hygiene features. The market is also expected to have high development activities by multinationals and well-established companies. Mergers and acquisition activities are anticipated to be witnessed over the forecast period.
The global wet waste management market is expected to grow at a CAGR of ~ 5% during the forecast period.
Market Segmentation
Global Wet Waste Management Market
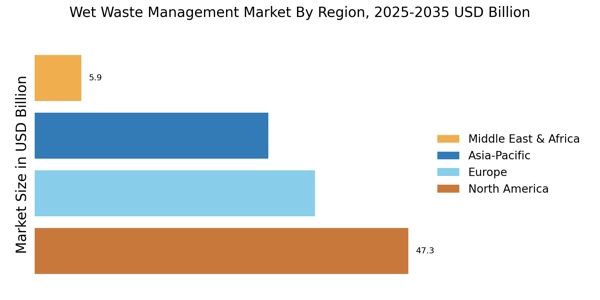
The global wet waste management is majorly fragmented into four regions namely North America, Europe, Asia Pacific, and Rest of the World. Among these, Asia Pacific is anticipated to grow at highest CAGR and hold the largest market share in the global wet waste management market. The growing awareness for wet waste management of the region with forthcoming advanced new technologies such as waste to energy solution, also the growing utilization of eco-friendly materials and increasing ecological sustainability concerns, improved economic conditions of major emerging nations. All these factors are majorly contributing towards the evolution of the wet waste management market in Asia Pacific region.
Europe held the second largest market share in 2016. The market for wet waste management is primarily driven due to the increasing government initiatives and support schemes to promote waste management. All the major countries in Europe have sponsored various private players in the waste management through their municipal commission at the city level to promote health and hygiene benefits across the population. North American countries are practicing wet waste management techniques from the last few decades and are expected to witness the same stagnant growth over the forecast period. The U.S. and Canada are the prominent countries, which are immensely concentrating on promoting wet waste management at an extensively level to obtain compost for farms and biofuels as transport fuels.
Key Players
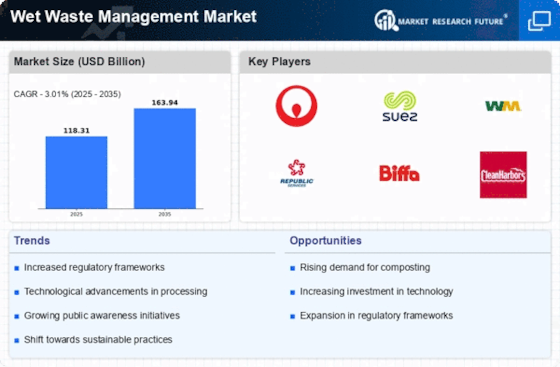
Some of the key players in the global wet waste management market are Clean Harbors Inc. (U.S.), SUEZ Environment Co. S.A. (France), Veolia Environment S.A. (France), Republic Services Inc. (U.S.), Waste Management Inc. (U.S.), Covanta Energy Corporation (U.S.), Advanced Disposal Services, Inc. (U.S.), Stericycle (U.S.), Progressive Waste Solution Ltd. (Canada), Remondis SE & Co. Kg (Germany), Sampurn(e)arth Environment Solutions Pvt. Ltd. (India), Eco Wise Waste Management Pvt. Ltd. (India), Waste Ventures India (India), Fomento de Construcciones y Contratas (Spain), and Panda Recycling (Ireland)
Frequently Asked Questions (FAQ) :
The global wet waste management market is expected to record a substantial market valuation by 2023.
The global wet waste management market is projected to register a moderate 5% CAGR in the forecast period.
The processing segment is slated to expand as the fastest-growing segment.
The industrial waste segment is slated to expand as the fastest-growing segment.
A few major market players operating in the global wet waste management market are SUEZ Environment Co. S.A. (France), Clean Harbors Inc. (U.S.), Veolia Environment S.A. (France), among others.
TABLE OF CONTENT
1 Executive Summary
2 Scope of the Report
2.1 Market Definition
2.2 Scope of the Study
2.2.1 Definition
2.2.2 Research Objective
2.2.3 Assumptions
2.2.4 Limitations
2.3 Research Process
2.3.1 Primary Research
2.3.2 Secondary Research
2.4 Market Size Estimation
2.5 Forecast Model
3 Market Landscape
3.1 Porter’s Five Forces Analysis
3.1.1 Threat of New Entrants
3.1.2 Bargaining Power of Buyers
3.1.3 Bargaining Power of Suppliers
3.1.4 Threat of Substitutes
3.1.5 Segment Rivalry
3.2 Value Chain/Supply Chain Analysis
4 Market Dynamics
4.1 Introduction
4.2 Market Drivers
4.3 Market Restraints
4.4 Market Opportunities
4.5 Market Trends
5 Global Wet Waste Management Market by Service & Equipment
5.1 Introduction
5.2 Collection & Transportation
5.2.1 Market Estimates & Forecast, 2017-2023
5.2.2 Market Estimates & Forecast by Region, 2017-2023
5.3 Storage
5.3.1 Market Estimates & Forecast, 2017-2023
5.3.2 Market Estimates & Forecast by Region, 2017-2023
5.4 Sorting
5.4.1 Market Estimates & Forecast, 2017-2023
5.4.2 Market Estimates & Forecast by Region, 2017-2023
5.5 Processing
5.5.1 Market Estimates & Forecast, 2017-2023
5.5.2 Market Estimates & Forecast by Region, 2017-2023
5.6 Disposal & Landfill
5.6.1 Market Estimates & Forecast, 2017-2023
5.6.2 Market Estimates & Forecast by Region, 2017-2023
6 Global Wet Waste Management Market, By Waste Type
6.1 Introduction
6.2 Food Scrap
6.2.1 Market Estimates & Forecast, 2017-2023
6.2.2 Market Estimates & Forecast by Region, 2017-2023
6.3 Meat & Bones
6.3.1 Market Estimates & Forecast, 2017-2023
6.3.2 Market Estimates & Forecast by Region, 2017-2023
6.4 Agricultural Waste
6.4.1 Market Estimates & Forecast, 2017-2023
6.4.2 Market Estimates & Forecast by Region, 2017-2023
6.5 Medical Waste
6.5.1 Market Estimates & Forecast, 2017-2023
6.5.2 Market Estimates & Forecast by Region, 2017-2023
6.6 Shredded Paper
6.6.1 Market Estimates & Forecast, 2017-2023
6.6.2 Market Estimates & Forecast by Region, 2017-2023
6.7 Others
6.7.1 Market Estimates & Forecast, 2017-2023
6.7.2 Market Estimates & Forecast by Region, 2017-2023
7 Global Wet Waste Management Market, By Source
7.1 Introduction
7.2 Household & Municipal Waste
7.2.1 Market Estimates & Forecast, 2017-2023
7.2.2 Market Estimates & Forecast by Region, 2017-2023
7.3 Commercial Waste
7.3.1 Market Estimates & Forecast, 2017-2023
7.3.2 Market Estimates & Forecast by Region, 2017-2023
7.4 Industrial Waste
7.4.1 Market Estimates & Forecast, 2017-2023
7.4.2 Market Estimates & Forecast by Region, 2017-2023
7.5 Healthcare & Medical Waste
7.5.1 Market Estimates & Forecast, 2017-2023
7.5.2 Market Estimates & Forecast by Region, 2017-2023
7.6 Other Waste
7.6.1 Market Estimates & Forecast, 2017-2023
7.6.2 Market Estimates & Forecast by Region, 2017-2023
8 Global Wet Waste Management Market, By Region
8.1 Introduction
8.2 North America
8.2.1 Market Estimates & Forecast, 2017-2023
8.2.2 Market Estimates & Forecast by Service & Equipment , 2017-2023
8.2.3 Market Estimates & Forecast by Waste Type, 2017-2023
8.2.4 Market Estimates & Forecast by Source, 2017-2023
8.2.5 The U.S
8.2.5.1 Market Estimates & Forecast, 2017-2023
8.2.5.2 Market Estimates & Forecast by Service & Equipment , 2017-2023
8.2.5.3 Market Estimates & Forecast by Waste Type, 2017-2023
8.2.5.4 Market Estimates & Forecast by Source, 2017-2023
8.2.6 Canada
8.2.6.1 Market Estimates & Forecast, 2017-2023
8.2.6.2 Market Estimates & Forecast by Service & Equipment , 2017-2023
8.2.6.3 Market Estimates & Forecast by Waste Type, 2017-2023
8.2.6.4 Market Estimates & Forecast by Source, 2017-2023
8.3 Europe
8.3.1 Market Estimates & Forecast, 2017-2023
8.3.2 Market Estimates & Forecast by Service & Equipment , 2017-2023
8.3.3 Market Estimates & Forecast by Waste Type, 2017-2023
8.3.4 Market Estimates & Forecast by Source, 2017-2023
8.3.5 U.K
8.3.5.1 Market Estimates & Forecast, 2017-2023
8.3.5.2 Market Estimates & Forecast by Service & Equipment , 2017-2023
8.3.5.3 Market Estimates & Forecast by Waste Type, 2017-2023
8.3.5.4 Market Estimates & Forecast by Source, 2017-2023
8.3.6 Germany
8.3.6.1 Market Estimates & Forecast, 2017-2023
8.3.6.2 Market Estimates & Forecast by Service & Equipment , 2017-2023
8.3.6.3 Market Estimates & Forecast by Waste Type, 2017-2023
8.3.6.4 Market Estimates & Forecast by Source, 2017-2023
8.3.7 France
8.3.7.1 Market Estimates & Forecast, 2017-2023
8.3.7.2 Market Estimates & Forecast by Service & Equipment , 2017-2023
8.3.7.3 Market Estimates & Forecast by Waste Type, 2017-2023
8.3.7.4 Market Estimates & Forecast by Source, 2017-2023
8.3.8 Italy
8.3.8.1 Market Estimates & Forecast, 2017-2023
8.3.8.2 Market Estimates & Forecast by Service & Equipment , 2017-2023
8.3.8.3 Market Estimates & Forecast by Waste Type, 2017-2023
8.3.8.4 Market Estimates & Forecast by Source, 2017-2023
8.3.9 Rest of Europe
8.3.9.1 Market Estimates & Forecast, 2017-2023
8.3.9.2 Market Estimates & Forecast by Service & Equipment , 2017-2023
8.3.9.3 Market Estimates & Forecast by Waste Type, 2017-2023
8.3.9.4 Market Estimates & Forecast by Source, 2017-2023
8.4 Asia Pacific
8.4.1 Market Estimates & Forecast, 2017-2023
8.4.2 Market Estimates & Forecast by Service & Equipment , 2017-2023
8.4.3 Market Estimates & Forecast by Waste Type, 2017-2023
8.4.4 Market Estimates & Forecast by Source, 2017-2023
8.4.5 China
8.4.5.1 Market Estimates & Forecast, 2017-2023
8.4.5.2 Market Estimates & Forecast by Service & Equipment , 2017-2023
8.4.5.3 Market Estimates & Forecast by Waste Type, 2017-2023
8.4.5.4 Market Estimates & Forecast by Source, 2017-2023
8.4.6 Japan
8.4.6.1 Market Estimates & Forecast, 2017-2023
8.4.6.2 Market Estimates & Forecast by Service & Equipment , 2017-2023
8.4.6.3 Market Estimates & Forecast by Waste Type, 2017-2023
8.4.6.4 Market Estimates & Forecast by Source, 2017-2023
8.4.7 India
8.4.7.1 Market Estimates & Forecast, 2017-2023
8.4.7.2 Market Estimates & Forecast by Service & Equipment , 2017-2023
8.4.7.3 Market Estimates & Forecast by Waste Type, 2017-2023
8.4.7.4 Market Estimates & Forecast by Source, 2017-2023
8.4.8 Rest of Asia Pacific
8.4.8.1 Market Estimates & Forecast, 2017-2023
8.4.8.2 Market Estimates & Forecast by Service & Equipment , 2017-2023
8.4.8.3 Market Estimates & Forecast by Waste Type, 2017-2023
8.4.8.4 Market Estimates & Forecast by Source, 2017-2023
8.5 Rest of the World
8.5.1 Market Estimates & Forecast, 2017-2023
8.5.2 Market Estimates & Forecast by Service & Equipment , 2017-2023
8.5.3 Market Estimates & Forecast by Waste Type, 2017-2023
8.5.4 Market Estimates & Forecast by Source, 2017-2023
9 Competitive Landscape
10 Company Profile
10.1 Clean Harbors Inc.
10.1.1 Company Overview
10.1.2 Waste Types/Services Offering
10.1.3 Financial Overview
10.1.4 Key Developments
10.1.5 Strategy
10.1.6 SWOT Analysis
10.2 SUEZ Environment Co. S.A.
10.2.1 Company Overview
10.2.2 Service & Equipment/Services Offering
10.2.3 Financial Overview
10.2.4 Key Developments
10.2.5 Strategy
10.2.6 SWOT Analysis
10.3 Veolia Environment S.A.
10.3.1 Company Overview
10.3.2 Waste Types /Services Offering
10.3.3 Financial Overview
10.3.4 Key Developments
10.3.5 Strategy
10.3.6 SWOT Analysis
10.4 Republic Services Inc.
10.4.1 Company Overview
10.4.2 Waste Types /Services Offering
10.4.3 Financial Overview
10.4.4 Key Developments
10.4.5 Strategy
10.4.6 SWOT Analysis
10.5 Waste Management Inc.
10.5.1 Company Overview
10.5.2 Waste Types /Services Offering
10.5.3 Financial Overview
10.5.4 Key Developments
10.5.5 Strategy
10.5.6 SWOT Analysis
10.6 Covanta Energy Corporation
10.6.1 Company Overview
10.6.2 Waste Types /Services Offering
10.6.3 Financial Overview
10.6.4 Key Developments
10.6.5 Strategy
10.6.6 SWOT Analysis
10.7 Advanced Disposal Services, Inc.
10.7.1 Company Overview
10.7.2 Waste Types /Services Offering
10.7.3 Financial Overview
10.7.4 Key Developments
10.7.5 Strategy
10.7.6 SWOT Analysis
10.8 Stericycle
10.8.1 Company Overview
10.8.2 Service & Equipment s/Services Offering
10.8.3 Financial Overview
10.8.4 Key Developments
10.8.5 Strategy
10.8.6 SWOT Analysis
10.9 Progressive Waste Solution Ltd.
10.9.1 Company Overview
10.9.2 Waste Types /Services Offering
10.9.3 Financial Overview
10.9.4 Key Developments
10.9.5 Strategy
10.9.6 SWOT Analysis
10.10 Remondis SE & Co. Kg
10.10.1 Company Overview
10.10.2 Waste Types /Services Offering
10.10.3 Financial Overview
10.10.4 Key Developments
10.10.5 Strategy
10.10.6 SWOT Analysis
10.11 Sampurn(e)arth Environment Solutions Pvt. Ltd.
10.11.1 Company Overview
10.11.2 Waste Types /Services Offering
10.11.3 Financial Overview
10.11.4 Key Developments
10.11.5 Strategy
10.11.6 SWOT Analysis
10.12 Eco Wise Waste Management Pvt. Ltd.
10.12.1 Company Overview
10.12.2 Service & Equipment s/Services Offering
10.12.3 Financial Overview
10.12.4 Key Developments
10.12.5 Strategy
10.12.6 SWOT Analysis
10.13 Waste Ventures India
10.13.1 Company Overview
10.13.2 Waste Types /Services Offering
10.13.3 Financial Overview
10.13.4 Key Developments
10.13.5 Strategy
10.13.6 SWOT Analysis
10.14 Fomento de Construcciones y Contratas
10.14.1 Company Overview
10.14.2 Waste Types /Services Offering
10.14.3 Financial Overview
10.14.4 Key Developments
10.14.5 Strategy
10.14.6 SWOT Analysis
10.15 Panda Recycling
10.15.1 Company Overview
10.15.2 Waste Types /Services Offering
10.15.3 Financial Overview
10.15.4 Key Developments
10.15.5 Strategy
10.15.6 SWOT Analysis
LIST OF TABLES
Table 1 Global Wet Waste Management Market: By Region, 2017-2023
Table 2 North America Wet Waste Management Market: By Country, 2017-2023
Table 3 Europe Wet Waste Management Market: By Country, 2017-2023
Table 4 Asia-Pacific Wet Waste Management Market: By Country, 2017-2023
Table 5 RoW Wet Waste Management Market: By Country, 2017-2023
Table 6 Global Wet Waste Management Market by Service & Equipment , By Regions, 2017-2023
Table 7 North America Wet Waste Management Market by Service & Equipment , By Country, 2017-2023
Table 8 Europe Wet Waste Management Market, by Service & Equipment , By Country, 2017-2023
Table 9 Asia-Pacific Wet Waste Management Market by Service & Equipment , By Country, 2017-2023
Table 10 RoW Wet Waste Management Market by Service & Equipment , By Country, 2017-2023
Table 11 Global Wet Waste Management by Waste Type: By Regions, 2017-2023
Table 12 North America Wet Waste Management Market by Waste Type: By Country, 2017-2023
Table 13 Europe Wet Waste Management Market by Waste Type: By Country, 2017-2023
Table 14 Asia Pacific Wet Waste Management Market by Waste Type: By Country, 2017-2023
Table 15 RoW Wet Waste Management Market by Waste Type: By Country, 2017-2023
Table 16 Global Wet Waste Management Market by Source, By Regions, 2017-2023
Table 17 North America Wet Waste Management Market by Source, By Country, 2017-2023
Table 18 Europe Wet Waste Management Market by Source, By Country, 2017-2023
Table 19 Asia Pacific Wet Waste Management Market by Source, By Country, 2017-2023
Table 20 RoW Wet Waste Management Market by Source, By Country, 2017-2023
Table 21 Global Service & Equipment Market: By Region, 2017-2023
Table 22 Global Waste Type Market: By Region, 2017-2023
Table 23 Global Source Market: By Region, 2017-2023
Table 24 North America Wet Waste Management Market By Country
Table 25 North America Wet Waste Management Market By Service & Equipment
Table 26 North America Wet Waste Management Market By Waste Type
Table 27 North America Wet Waste Management Market By Source
Table 28 Europe: Wet Waste Management Market By Country
Table 29 Europe: Wet Waste Management Market By Service & Equipment
Table 30 Europe: Wet Waste Management Market By Waste Type
Table 31 Europe: Wet Waste Management Market By Source
Table 32 Asia-Pacific: Wet Waste Management Market By Country
Table 33 Asia-Pacific: Wet Waste Management Market By Service & Equipment
Table 34 Asia-Pacific: Wet Waste Management Market By Waste Type
Table 35 Asia-Pacific: Wet Waste Management Market By Source
Table 36 RoW: Wet Waste Management Market By Region
Table 37 RoW Wet Waste Management Market By Service & Equipment
Table 38 RoW Wet Waste Management Market By Waste Type
Table 39 RoW Wet Waste Management Market by Source
LIST OF FIGURES
FIGURE 1 RESEARCH PROCESS OF MRFR
FIGURE 2 TOP DOWN & BOTTOM UP APPROACH
FIGURE 3 Market Dynamics
FIGURE 4 impact analysis: market drivers
FIGURE 5 impact analysis: market restraints
FIGURE 6 porter’s five forces analysis
FIGURE 7 Value chain analysis
FIGURE 8 GLOBAL Wet Waste Management MARKET SHARE, BY Raw Material, 2016 (%)
FIGURE 9 GLOBAL Wet Waste Management Market BY Service & Equipment , 2015-2023 (USD MILLION)
FIGURE 10 GLOBAL Wet Waste Management MARKET SHARE, BY Source, 2016 (%)
FIGURE 11 GLOBAL Wet Waste Management Market BY Source, 2015-2023 (USD MILLION)
FIGURE 12 GLOBAL Wet Waste Management MARKET SHARE (%), BY REGION, 2016
FIGURE 13 GLOBAL Wet Waste Management Market BY REGION, 2015-2023 (USD MILLION)
FIGURE 14 North America Wet Waste Management MARKET SHARE (%), 2016
FIGURE 15 North America Wet Waste Management MARKET BY Country, 2015-2023 (USD MILLION)
FIGURE 16 Europe Wet Waste Management MARKET SHARE (%), 2016
FIGURE 17 Europe Wet Waste Management MARKET BY Country, 2015-2023 (USD MILLION)
FIGURE 18 Asia-Pacific Wet Waste Management Market SHARE (%), 2016
FIGURE 19 Asia-Pacific Wet Waste Management Market BY Country, 2015-2023 (USD MILLION)
FIGURE 20 Rest of the World Wet Waste Management MARKET SHARE (%), 2016
FIGURE 21 Rest of the World Wet Waste Management MARKET BY Country, 2015-2023 (USD MILLION)