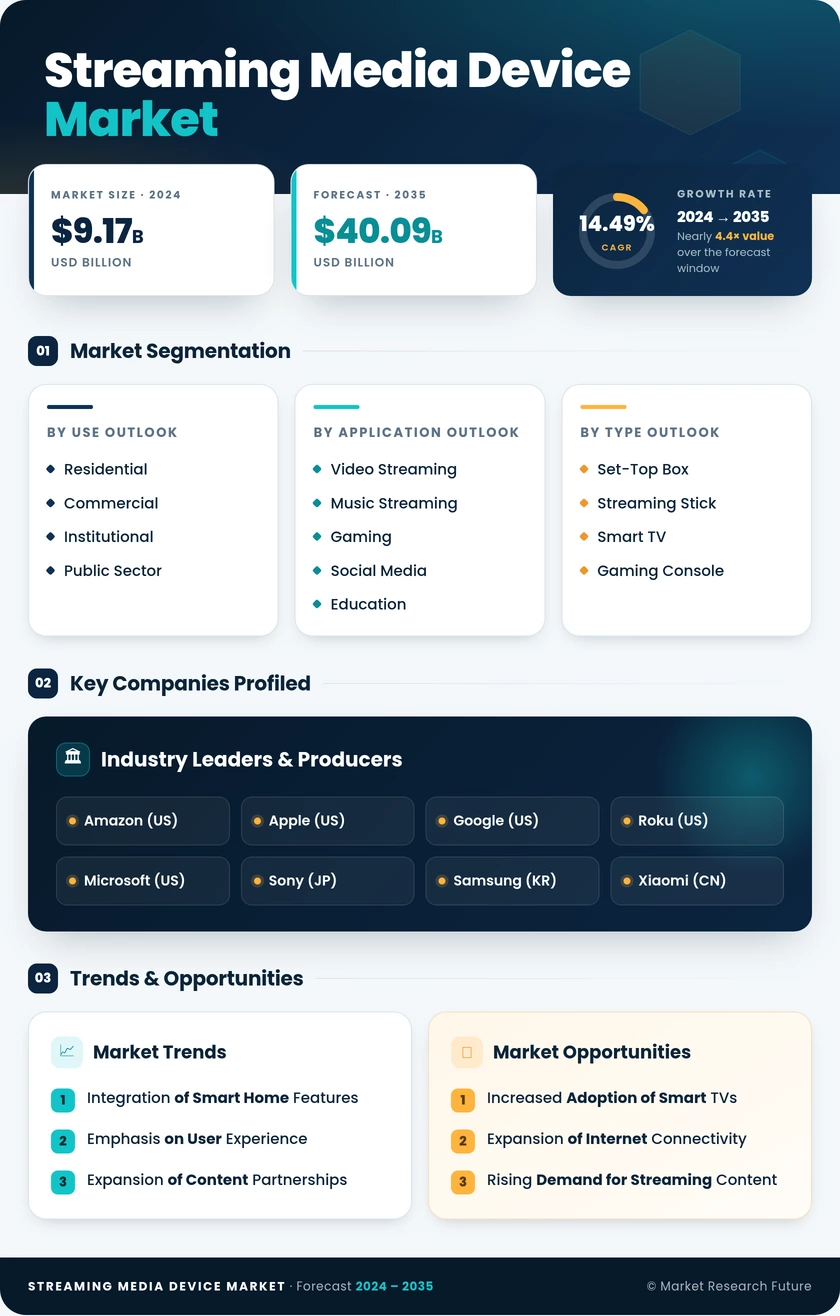
Streaming Media Device Market
- Integration of Smart Home Features
- Emphasis on User Experience
- Expansion of Content Partnerships
- Increased Adoption of Smart TVs
- Expansion of Internet Connectivity
- Rising Demand for Streaming Content
-
1 RESUMEN EJECUTIVO
-
1.1 Análisis del atractivo del mercado
- 1.1.1 Mercado global de dispositivos de streaming multimedia, por tipo de dispositivo
- 1.1.2 Mercado global de dispositivos de streaming multimedia, por resolución
- 1.1.3 Mercado global de dispositivos de streaming multimedia, por aplicación
- 1.1.4 Mercado global de dispositivos de streaming multimedia, por uso final
- 1.1.5 Mercado global de dispositivos de streaming multimedia, por región
-
1.1 Análisis del atractivo del mercado
-
2 INTRODUCCIÓN DEL MERCADO
- 2.1 Definición
- 2.2 Alcance del estudio
- 2.3 Estructura del mercado
-
3 METODOLOGÍA DE LA INVESTIGACIÓN
- 3.1 Proceso de investigación
- 3.2 Investigación primaria
- 3.3 Investigación secundaria
- 3.4 Estimación del tamaño del mercado
- 3.5 Modelo de pronóstico
- 3.6 Lista de supuestos
-
4 DINÁMICA DEL MERCADO
- 4.1 Introducción
-
4.2 Factores impulsores
- 4.2.1 Aumento de la demanda de servicios de streaming de vídeo y audio digital
- 4.2.2 Creciente penetración de internet
-
4.3 Restricciones
- 4.3.1 Regulaciones estrictas relacionadas con la piratería y el streaming ilegal
-
4.4 Oportunidades
- 4.4.1 Creciente demanda de servicios y soluciones en la nube
-
4.5 Desafíos
- 4.5.1 Creciente penetración de televisores inteligentes
-
5 ANÁLISIS DE FACTORES DE MERCADO
- 5.1 Análisis de la cadena de valor/análisis de la cadena de suministro
-
5.2 Las cinco fuerzas de Porter
- 5.2.1 Poder de negociación de los proveedores
- 5.2.2 Poder de negociación de los compradores
- 5.2.3 Amenaza de nuevos participantes
- 5.2.4 Amenaza de sustitutos
- 5.2.5 Intensidad de la rivalidad
-
6 MERCADO GLOBAL DE DISPOSITIVOS DE STREAMING MULTIMEDIA, POR TIPO DE DISPOSITIVO
- 6.1 Introducción
- 6.2 Consolas de videojuegos
-
6.3 Reproductores multimedia
- 6.3.1 Cajas de streaming
- 6.3.2 Dispositivos de streaming
-
7 MERCADO GLOBAL DE DISPOSITIVOS DE STREAMING MULTIMEDIA, POR RESOLUCIÓN
- 7.1 Introducción
- 7.2 720p
- 7.3 1080p
- 7.4 4K
-
8 MERCADO GLOBAL DE DISPOSITIVOS DE STREAMING MULTIMEDIA, POR APLICACIÓN
- 8.1 Introducción
- 8.2 Videojuegos
- 8.3 Entretenimiento de audio/vídeo
- 8.4 Aprendizaje electrónico
- 8.5 Otros (Navegación web, Redes sociales)
-
9 MERCADO GLOBAL DE DISPOSITIVOS DE TRANSMISIÓN MULTIMEDIA, POR USO FINAL
- 9.1 Introducción
- 9.2 Comercial
- 9.3 Residencial
-
10 MERCADO GLOBAL DE DISPOSITIVOS DE TRANSMISIÓN MULTIMEDIA, POR REGIÓN
- 10.1 Descripción general
-
10.2 Norteamérica
- 10.2.1 Tamaño del mercado y estimaciones, por país, 2020-2027
- 10.2.2 Tamaño del mercado y estimaciones, por tipo de dispositivo, 2020-2027
- 10.2.3 Tamaño del mercado y estimaciones, por resolución, 2020-2027
- 10.2.4 Tamaño del mercado y Estimaciones por aplicación, 2020-2027
- 10.2.5 Tamaño del mercado y estimaciones por uso final, 2020-2027
-
10.2.6 EE. UU.
- 10.2.6.1 Tamaño del mercado y estimaciones por tipo de dispositivo, 2020-2027
- 10.2.6.2 Tamaño del mercado y estimaciones por resolución, 2020-2027
- 10.2.6.3 Tamaño del mercado y estimaciones por aplicación, 2020-2027
- 10.2.6.4 Tamaño del mercado y estimaciones por uso final, 2020-2027
-
10.2.7 Canadá
- 10.2.7.1 Tamaño del mercado y Estimaciones, por tipo de dispositivo, 2020-2027
- 10.2.7.2 Tamaño del mercado y estimaciones, por resolución, 2020-2027
- 10.2.7.3 Tamaño del mercado y estimaciones, por aplicación, 2020-2027
- 10.2.7.4 Tamaño del mercado y estimaciones, por uso final, 2020-2027
-
10.2.8 México
- 10.2.8.1 Tamaño del mercado y estimaciones, por tipo de dispositivo, 2020-2027
- 10.2.8.2 Tamaño del mercado y estimaciones, por resolución, 2020-2027
- 10.2.8.3 Tamaño del mercado y estimaciones, por aplicación, 2020-2027
- 10.2.8.4 Tamaño del mercado y Estimaciones por uso final, 2020-2027
-
10.3 Europa
- 10.3.1 Tamaño del mercado y estimaciones por país, 2020-2027
- 10.3.2 Tamaño del mercado y estimaciones por tipo de dispositivo, 2020-2027
- 10.3.3 Tamaño del mercado y estimaciones por resolución, 2020-2027
- 10.3.4 Tamaño del mercado y estimaciones por aplicación, 2020-2027
- 10.3.5 Tamaño del mercado y estimaciones por uso final, 2020-2027
-
10.3.6 Alemania
- 10.3.6.1 Tamaño del mercado y estimaciones por tipo de dispositivo, 2020-2027
- 10.3.6.2 Tamaño del mercado y estimaciones, por resolución, 2020-2027
- 10.3.6.3 Tamaño del mercado y estimaciones, por aplicación, 2020-2027
- 10.3.6.4 Tamaño del mercado y estimaciones, por uso final, 2020-2027
-
10.3.7 Reino Unido
- 10.3.7.1 Tamaño del mercado y estimaciones, por tipo de dispositivo, 2020-2027
- 10.3.7.2 Tamaño del mercado y estimaciones, por resolución, 2020-2027
- 10.3.7.3 Tamaño del mercado y estimaciones, por aplicación, 2020-2027
- 10.3.7.4 Tamaño del mercado y estimaciones, por uso final, 2020-2027
-
10.3.8 Francia
- 10.3.8.1 Tamaño del mercado y estimaciones, por tipo de dispositivo, 2020-2027
- 10.3.8.2 Tamaño del mercado y estimaciones, por resolución, 2020-2027
- 10.3.8.3 Tamaño del mercado y estimaciones, por aplicación, 2020-2027
- 10.3.8.4 Tamaño del mercado y estimaciones, por uso final, 2020-2027
-
10.3.9 Italia
- 10.3.9.1 Tamaño del mercado y estimaciones, por tipo de dispositivo, 2020-2027
- 10.3.9.2 Tamaño del mercado y estimaciones, por resolución, 2020-2027
- 10.3.9.3 Tamaño del mercado y Estimaciones por aplicación, 2020-2027
- 10.3.9.4 Tamaño del mercado y estimaciones por uso final, 2020-2027
-
10.3.10 Resto de Europa
- 10.3.10.1 Tamaño del mercado y estimaciones por tipo de dispositivo, 2020-2027
- 10.3.10.2 Tamaño del mercado y estimaciones por resolución, 2020-2027
- 10.3.10.3 Tamaño del mercado y estimaciones por aplicación, 2020-2027
- 10.3.10.4 Tamaño del mercado y estimaciones por uso final, 2020-2027
-
10.4 Asia Pacífico
- 10.4.1 Tamaño del mercado y Estimaciones por país, 2020-2027
- 10.4.2 Tamaño del mercado y estimaciones por tipo de dispositivo, 2020-2027
- 10.4.3 Tamaño del mercado y estimaciones por resolución, 2020-2027
- 10.4.4 Tamaño del mercado y estimaciones por aplicación, 2020-2027
- 10.4.5 Tamaño del mercado y estimaciones por uso final, 2020-2027
-
10.4.6 China
- 10.4.6.1 Tamaño del mercado y estimaciones por tipo de dispositivo, 2020-2027
- 10.4.6.2 Tamaño del mercado y estimaciones por resolución, 2020-2027
- 10.4.6.3 Tamaño del mercado y Estimaciones por aplicación, 2020-2027
- 10.4.6.4 Tamaño del mercado y estimaciones por uso final, 2020-2027
-
10.4.7 Japón
- 10.4.7.1 Tamaño del mercado y estimaciones por tipo de dispositivo, 2020-2027
- 10.4.7.2 Tamaño del mercado y estimaciones por resolución, 2020-2027
- 10.4.7.3 Tamaño del mercado y estimaciones por aplicación, 2020-2027
- 10.4.7.4 Tamaño del mercado y estimaciones por uso final, 2020-2027
-
10.4.8 India
- 10.4.8.1 Tamaño del mercado y Estimaciones por tipo de dispositivo, 2020-2027
- 10.4.8.2 Tamaño del mercado y estimaciones por resolución, 2020-2027
- 10.4.8.3 Tamaño del mercado y estimaciones por aplicación, 2020-2027
- 10.4.8.4 Tamaño del mercado y estimaciones por uso final, 2020-2027
-
10.4.9 Corea del Sur
- 10.4.9.1 Tamaño del mercado y estimaciones por tipo de dispositivo, 2020-2027
- 10.4.9.2 Tamaño del mercado y estimaciones por resolución, 2020-2027
- 10.4.9.3 Tamaño del mercado y estimaciones por aplicación, 2020-2027
- 10.4.9.4 Tamaño del mercado y estimaciones, por uso final, 2020-2027
-
10.4.10 Resto de Asia-Pacífico
- 10.4.10.1 Tamaño del mercado y estimaciones, por tipo de dispositivo, 2020-2027
- 10.4.10.2 Tamaño del mercado y estimaciones, por resolución, 2020-2027
- 10.4.10.3 Tamaño del mercado y estimaciones, por aplicación, 2020-2027
- 10.4.10.4 Tamaño del mercado y estimaciones, por uso final, 2020-2027
-
10.5 Oriente Medio y África
- 10.5.1 Tamaño del mercado y estimaciones, por país, 2020-2027
- 10.5.2 Tamaño del mercado y Estimaciones, por tipo de dispositivo, 2020-2027
- 10.5.3 Tamaño del mercado y estimaciones, por resolución, 2020-2027
- 10.5.4 Tamaño del mercado y estimaciones, por aplicación, 2020-2027
- 10.5.5 Tamaño del mercado y estimaciones, por uso final, 2020-2027
-
10.5.6 Arabia Saudita
- 10.5.6.1 Tamaño del mercado y estimaciones, por tipo de dispositivo, 2020-2027
- 10.5.6.2 Tamaño del mercado y estimaciones, por resolución, 2020-2027
- 10.5.6.3 Tamaño del mercado y estimaciones, por aplicación, 2020-2027
- 10.5.6.4 Tamaño del mercado y Estimaciones por uso final, 2020-2027
-
10.5.7 EAU
- 10.5.7.1 Tamaño del mercado y estimaciones por tipo de dispositivo, 2020-2027
- 10.5.7.2 Tamaño del mercado y estimaciones por resolución, 2020-2027
- 10.5.7.3 Tamaño del mercado y estimaciones por aplicación, 2020-2027
- 10.5.7.4 Tamaño del mercado y estimaciones por uso final, 2020-2027
-
10.5.8 Sudáfrica
- 10.5.8.1 Tamaño del mercado y estimaciones por tipo de dispositivo, 2020-2027
- 10.5.8.2 Tamaño del mercado y Estimaciones, por Resolución, 2020-2027
- 10.5.8.3 Tamaño del mercado y estimaciones, por aplicación, 2020-2027
- 10.5.8.4 Tamaño del mercado y estimaciones, por uso final, 2020-2027
-
10.5.9 Resto de Oriente Medio y África
- 10.5.9.1 Tamaño del mercado y estimaciones, por tipo de dispositivo, 2020-2027
- 10.5.9.2 Tamaño del mercado y estimaciones, por Resolución, 2020-2027
- 10.5.9.3 Tamaño del mercado y estimaciones, por aplicación, 2020-2027
- 10.5.9.4 Tamaño del mercado y estimaciones, por uso final, 2020-2027
-
10.6 Sudamérica
- 10.6.1 Tamaño del mercado y estimaciones, por país, 2020-2027
- 10.6.2 Tamaño del mercado y estimaciones, por tipo de dispositivo, 2020-2027
- 10.6.3 Tamaño del mercado y estimaciones, por resolución, 2020-2027
- 10.6.4 Tamaño del mercado y estimaciones, por aplicación, 2020-2027
- 10.6.5 Tamaño del mercado y estimaciones, por uso final, 2020-2027
-
10.6.6 Brasil
- 10.6.6.1 Tamaño del mercado y estimaciones, por tipo de dispositivo, 2020-2027
- 10.6.6.2 Tamaño del mercado y Estimaciones, por Resolución, 2020-2027
- 10.6.6.3 Tamaño del Mercado y Estimaciones, por Aplicación, 2020-2027
- 10.6.6.4 Tamaño del Mercado y Estimaciones, por Uso Final, 2020-2027
-
10.6.7 Argentina
- 10.6.7.1 Tamaño del Mercado y Estimaciones, por Tipo de Dispositivo, 2020-2027
- 10.6.7.2 Tamaño del Mercado y Estimaciones, por Resolución, 2020-2027
- 10.6.7.3 Tamaño del Mercado y Estimaciones, por Aplicación, 2020-2027
- 10.6.7.4 Tamaño del Mercado y Estimaciones, por Uso Final, 2020-2027
-
10.6.8 Colombia
- 10.6.8.1 Tamaño del mercado y estimaciones, por tipo de dispositivo, 2020-2027
- 10.6.8.2 Tamaño del mercado y estimaciones, por resolución, 2020-2027
- 10.6.8.3 Tamaño del mercado y estimaciones, por aplicación, 2020-2027
- 10.6.8.4 Tamaño del mercado y estimaciones, por uso final, 2020-2027
-
10.6.9 Resto de Sudamérica
- 10.6.9.1 Tamaño del mercado y estimaciones, por tipo de dispositivo, 2020-2027
- 10.6.9.2 Tamaño del mercado y estimaciones, por resolución, 2020-2027
- 10.6.9.3 Tamaño del mercado y Estimaciones por aplicación, 2020-2027
- 10.6.9.4 Tamaño del mercado y estimaciones por uso final, 2020-2027
-
11 PANORAMA COMPETITIVO
- 11.1 Introducción
- 11.2 Análisis de la cuota de mercado de los actores clave (%)
- 11.3 Análisis comparativo de la competencia
- 11.4 Principal estrategia de crecimiento en el mercado
-
11.5 Desarrollos clave y estrategias de crecimiento
- 11.5.1 Desarrollo de nuevos productos
- 11.5.2 Fusiones y adquisiciones
- 11.5.3 Contratos y acuerdos
- 11.5.4 Expansiones e inversiones
-
12 PERFILES DE EMPRESAS
-
12.1 Amazon.com, Inc.
- 12.1.1 Descripción general de la empresa
- 12.1.2 Descripción financiera
- 12.1.3 Productos/soluciones/servicios ofrecidos
- 12.1.4 Desarrollos clave
- 12.1.5 Análisis FODA
- 12.1.6 Estrategias clave
-
12.2 Apple Inc.
- 12.2.1 Descripción general de la empresa
- 12.2.2 Descripción financiera
- 12.2.3 Productos/soluciones/servicios ofrecidos
- 12.2.4 Desarrollos clave
- 12.2.5 Análisis FODA
- 12.2.6 Estrategias clave
-
12.3 Google LLC
- 12.3.1 Descripción general de la empresa
- 12.3.2 Descripción financiera
- 12.3.3 Productos/soluciones/servicios ofrecidos
- 12.3.4 Desarrollos Clave
- 12.3.5 Análisis FODA
- 12.3.6 Estrategias Clave
-
12.4 HUMAX
- 12.4.1 Descripción General de la Empresa
- 12.4.2 Panorama Financiero
- 12.4.3 Productos/Soluciones/Servicios Ofrecidos
- 12.4.4 Desarrollos Clave
- 12.4.5 Análisis FODA
- 12.4.6 Estrategias Clave
-
12.5 Philips Electronics
- 12.5.1 Descripción General de la Empresa
- 12.5.2 Panorama Financiero
- 12.5.3 Productos/Ofertas Ofrecidas
- 12.5.4 Desarrollos Clave
- 12.5.5 Análisis FODA
- 12.5.6 Estrategias Clave
-
12.6 Nvidia Corporation
- 12.6.1 Descripción general de la empresa
- 12.6.2 Descripción financiera
- 12.6.3 Productos/Ofertas ofrecidos
- 12.6.4 Desarrollos clave
- 12.6.5 Análisis FODA
- 12.6.6 Estrategias clave
-
12.7 Sony Corporation
- 12.7.1 Descripción general de la empresa
- 12.7.2 Descripción financiera
- 12.7.3 Productos/Ofertas ofrecidos
- 12.7.4 Desarrollos clave
- 12.7.5 Análisis FODA
- 12.7.6 Estrategias clave
-
12.8 Samsung Electronics
- 12.8.1 Descripción general de la empresa
- 12.8.2 Descripción financiera
- 12.8.3 Productos/Ofertas Ofrecidas
- 12.8.4 Desarrollos Clave
- 12.8.5 Análisis FODA
- 12.8.6 Estrategias Clave
-
12.9 Azulle
- 12.9.1 Descripción General de la Empresa
- 12.9.2 Descripción Financiera
- 12.9.3 Productos/Ofertas Ofrecidas
- 12.9.4 Desarrollos Clave
- 12.9.5 Análisis FODA
- 12.9.6 Estrategias Clave
-
12.10 Roku, Inc.
- 12.10.1 Descripción General de la Empresa
- 12.10.2 Descripción Financiera
- 12.10.3 Productos/Ofertas Ofrecidas
- 12.10.4 Desarrollos Clave
- 12.10.5 Análisis FODA
- 12.10.6 Estrategias clave
-
12.11 Xiaomi Inc.
- 12.11.1 Descripción general de la empresa
- 12.11.2 Descripción financiera
- 12.11.3 Productos/Ofertas ofrecidos
- 12.11.4 Desarrollos clave
- 12.11.5 Análisis FODA
- 12.11.6 Estrategias clave
-
12.12 WeTek
- 12.12.1 Descripción general de la empresa
- 12.12.2 Descripción financiera
- 12.12.3 Productos/Ofertas ofrecidos
- 12.12.4 Desarrollos clave
- 12.12.5 Análisis FODA
- 12.12.6 Estrategias clave
-
12.13 TiVo
- 12.13.1 Descripción general de la empresa
- 12.13.2 Descripción financiera
- 12.13.3 Productos/Ofertas ofrecidos
- 12.13.4 Desarrollos clave
- 12.13.5 Análisis FODA
- 12.13.6 Estrategias clave
-
12.14 SkyStream Technologies
- 12.14.1 Descripción general de la empresa
- 12.14.2 Descripción financiera
- 12.14.3 Productos/Ofertas ofrecidos
- 12.14.4 Desarrollos clave
- 12.14.5 Análisis FODA
- 12.14.6 Estrategias clave
-
12.15 Matricom
- 12.15.1 Descripción general de la empresa
- 12.15.2 Descripción financiera
- 12.15.3 Productos/Ofertas ofrecidos
- 12.15.4 Desarrollos Clave
- 12.15.5 Análisis FODA
- 12.15.6 Estrategias Clave
-
12.16 ASUSTeK Computer Inc.
- 12.16.1 Descripción General de la Empresa
- 12.16.2 Descripción Financiera
- 12.16.3 Productos/Ofertas Ofrecidas
- 12.16.4 Desarrollos Clave
- 12.16.5 Análisis FODA
- 12.16.6 Estrategias Clave
- 12.17.1 Descripción General de la Empresa
- 12.17.2 Descripción Financiera
- 12.17.3 Productos/Ofertas Ofrecidas
- 12.17.4 Desarrollos Clave
- 12.17.5 Análisis FODA
- 12.17.6 Estrategias clave
- ?
- LISTA DE TABLAS
- TABLA 1 LISTA DE SUPUESTOS
- TABLA 2 MERCADO MUNDIAL DE DISPOSITIVOS DE TRANSMISIÓN DE MEDIOS, POR TIPO DE DISPOSITIVO, 2020-2027 (MILLONES DE USD)
- TABLA 4 MERCADO MUNDIAL DE DISPOSITIVOS DE TRANSMISIÓN DE MEDIOS, POR RESOLUCIÓN, 2020-2027 (MILLONES DE USD)
- TABLA 5 MERCADO MUNDIAL DE DISPOSITIVOS DE TRANSMISIÓN DE MEDIOS, POR APLICACIÓN, 2020-2027 (MILLONES DE USD)
- TABLA 6 MERCADO MUNDIAL DE DISPOSITIVOS DE TRANSMISIÓN DE MEDIOS, POR USO FINAL, 2020-2027 (MILLONES DE USD)
- TABLA 7 MERCADO MUNDIAL DE DISPOSITIVOS DE TRANSMISIÓN DE MEDIOS, POR REGIÓN, 2020-2027 (MILLONES DE USD) MILLONES)
- TABLA 8 AMÉRICA DEL NORTE: MERCADO DE DISPOSITIVOS DE STREAMING MULTIMEDIA, POR PAÍS, 2020-2027 (MILLONES DE USD)
- TABLA 9 AMÉRICA DEL NORTE: MERCADO DE DISPOSITIVOS DE STREAMING MULTIMEDIA, POR TIPO DE DISPOSITIVO, 2020-2027 (MILLONES DE USD)
- TABLA 10 AMÉRICA DEL NORTE: MERCADO DE DISPOSITIVOS DE STREAMING MULTIMEDIA, POR RESOLUCIÓN, 2020-2027 (MILLONES DE USD)
- TABLA 11 AMÉRICA DEL NORTE: MERCADO DE DISPOSITIVOS DE STREAMING MULTIMEDIA, POR APLICACIÓN, 2020-2027 (MILLONES DE USD)
- TABLA 12 AMÉRICA DEL NORTE: MERCADO DE DISPOSITIVOS DE STREAMING MULTIMEDIA, POR USO FINAL, 2020-2027 (MILLONES DE USD)
- TABLA 13 EE. UU.: MERCADO DE DISPOSITIVOS DE STREAMING MULTIMEDIA, POR TIPO DE DISPOSITIVO, 2020-2027 (MILLONES DE USD)
- TABLA 14 EE. UU.: MERCADO DE DISPOSITIVOS DE STREAMING MULTIMEDIA, POR RESOLUCIÓN, 2020-2027 (MILLONES DE USD)
- TABLA 15 EE. UU.: MERCADO DE DISPOSITIVOS DE STREAMING MULTIMEDIA, POR APLICACIÓN, 2020-2027 (MILLONES DE USD)
- TABLA 16 EE. UU.: MERCADO DE DISPOSITIVOS DE STREAMING MULTIMEDIA, POR USO FINAL, 2020-2027 (MILLONES DE USD)
- TABLA 17 CANADÁ: MERCADO DE DISPOSITIVOS DE STREAMING MULTIMEDIA, POR TIPO DE DISPOSITIVO, 2020-2027 (MILLONES DE USD)
- TABLA 18 CANADÁ: MERCADO DE DISPOSITIVOS DE STREAMING MULTIMEDIA, POR RESOLUCIÓN, 2020-2027 (USD MILLONES)
- TABLA 19 CANADÁ: MERCADO DE DISPOSITIVOS DE STREAMING MULTIMEDIA, POR APLICACIÓN, 2020-2027 (USD MILLONES)
- TABLA 20 CANADÁ: MERCADO DE DISPOSITIVOS DE STREAMING MULTIMEDIA, POR USO FINAL, 2020-2027 (USD MILLONES)
- TABLA 21 MÉXICO: MERCADO DE DISPOSITIVOS DE STREAMING MULTIMEDIA, POR TIPO DE DISPOSITIVO, 2020-2027 (USD MILLONES)
- TABLA 22 MÉXICO: MERCADO DE DISPOSITIVOS DE STREAMING MULTIMEDIA, POR RESOLUCIÓN, 2020-2027 (USD MILLONES)
- TABLA 23 MÉXICO: MERCADO DE DISPOSITIVOS DE STREAMING MULTIMEDIA, POR APLICACIÓN, 2020-2027 (USD MILLONES)
- TABLA 24 MÉXICO: MERCADO DE DISPOSITIVOS DE STREAMING MULTIMEDIA, POR USO FINAL, 2020-2027 (MILLONES DE USD)
- TABLA 25 EUROPA: MERCADO DE DISPOSITIVOS DE STREAMING MULTIMEDIA, POR PAÍS, 2020-2027 (MILLONES DE USD)
- TABLA 26 EUROPA: MERCADO DE DISPOSITIVOS DE STREAMING MULTIMEDIA, POR TIPO DE DISPOSITIVO, 2020-2027 (MILLONES DE USD)
- TABLA 27 EUROPA: MERCADO DE DISPOSITIVOS DE STREAMING MULTIMEDIA, POR RESOLUCIÓN, 2020-2027 (MILLONES DE USD)
- TABLA 28 EUROPA: MERCADO DE DISPOSITIVOS DE STREAMING MULTIMEDIA, POR APLICACIÓN, 2020-2027 (MILLONES DE USD)
- TABLA 29 EUROPA: MERCADO DE DISPOSITIVOS DE STREAMING MULTIMEDIA, POR USO FINAL, 2020–2027 (USD MILLONES)
- TABLA 30 REINO UNIDO: MERCADO DE DISPOSITIVOS DE STREAMING MEDIA, POR TIPO DE DISPOSITIVO, 2020–2027 (USD MILLONES)
- TABLA 31 REINO UNIDO: MERCADO DE DISPOSITIVOS DE STREAMING MEDIA, POR RESOLUCIÓN, 2020–2027 (USD MILLONES)
- TABLA 32 REINO UNIDO: MERCADO DE DISPOSITIVOS DE STREAMING MEDIA, POR APLICACIÓN, 2020–2027 (USD MILLONES)
- TABLA 32 REINO UNIDO: MERCADO DE DISPOSITIVOS DE STREAMING MEDIA, POR USO FINAL, 2020–2027 (USD MILLONES)
- TABLA 34 ALEMANIA: MERCADO DE DISPOSITIVOS DE STREAMING MEDIA, POR TIPO DE DISPOSITIVO, 2020–2027 (USD MILLONES)
- TABLA 35 ALEMANIA: MERCADO DE DISPOSITIVOS DE STREAMING MULTIMEDIA, POR RESOLUCIÓN, 2020-2027 (MILLONES DE USD)
- TABLA 36 ALEMANIA: MERCADO DE DISPOSITIVOS DE STREAMING MULTIMEDIA, POR APLICACIÓN, 2020-2027 (MILLONES DE USD)
- TABLA 37 ALEMANIA: MERCADO DE DISPOSITIVOS DE STREAMING MULTIMEDIA, POR USO FINAL, 2020-2027 (MILLONES DE USD)
- TABLA 38 FRANCIA: MERCADO DE DISPOSITIVOS DE STREAMING MULTIMEDIA, POR TIPO DE DISPOSITIVO, 2020-2027 (MILLONES DE USD)
- TABLA 39 FRANCIA: MERCADO DE DISPOSITIVOS DE STREAMING MULTIMEDIA, POR RESOLUCIÓN, 2020-2027 (MILLONES DE USD)
- TABLA 40 FRANCIA: MERCADO DE DISPOSITIVOS DE STREAMING MULTIMEDIA, POR APLICACIÓN, 2020–2027 (USD MILLONES)
- TABLA 41 FRANCIA: MERCADO DE DISPOSITIVOS DE STREAMING MULTIMEDIA, POR USO FINAL, 2020–2027 (USD MILLONES)
- TABLA 42 ITALIA: MERCADO DE DISPOSITIVOS DE STREAMING MULTIMEDIA, POR TIPO DE DISPOSITIVO, 2020–2027 (USD MILLONES)
- TABLA 43 ITALIA: MERCADO DE DISPOSITIVOS DE STREAMING MULTIMEDIA, POR RESOLUCIÓN, 2020–2027 (USD MILLONES)
- TABLA 44 ITALIA: MERCADO DE DISPOSITIVOS DE STREAMING MULTIMEDIA, POR APLICACIÓN, 2020–2027 (USD MILLONES)
- TABLA 45 ITALIA: MERCADO DE DISPOSITIVOS DE STREAMING MULTIMEDIA, POR USO FINAL, 2020–2027 (USD MILLONES)
- TABLA 46 RESTO DE EUROPA: MERCADO DE DISPOSITIVOS DE STREAMING MULTIMEDIA, POR TIPO DE DISPOSITIVO, 2020-2027 (MILLONES DE USD)
- TABLA 47 RESTO DE EUROPA: MERCADO DE DISPOSITIVOS DE STREAMING MULTIMEDIA, POR RESOLUCIÓN, 2020-2027 (MILLONES DE USD)
- TABLA 48 RESTO DE EUROPA: MERCADO DE DISPOSITIVOS DE STREAMING MULTIMEDIA, POR APLICACIÓN, 2020-2027 (MILLONES DE USD)
- TABLA 49 RESTO DE EUROPA: MERCADO DE DISPOSITIVOS DE STREAMING MULTIMEDIA, POR USO FINAL, 2020-2027 (MILLONES DE USD)
- TABLA 50 ASIA-PACÍFICO: MERCADO DE DISPOSITIVOS DE STREAMING MULTIMEDIA, POR PAÍS, 2020-2027 (MILLONES DE USD)
- TABLA 51 ASIA-PACÍFICO: MERCADO DE DISPOSITIVOS DE TRANSMISIÓN DE MEDIOS, POR TIPO DE DISPOSITIVO, 2020-2027 (MILLONES DE USD)
- TABLA 52 ASIA-PACÍFICO: MERCADO DE DISPOSITIVOS DE TRANSMISIÓN DE MEDIOS, POR RESOLUCIÓN, 2020-2027 (MILLONES DE USD)
- TABLA 53 ASIA-PACÍFICO: MERCADO DE DISPOSITIVOS DE TRANSMISIÓN DE MEDIOS, POR APLICACIÓN, 2020-2027 (MILLONES DE USD)
- TABLA 54 ASIA-PACÍFICO: MERCADO DE DISPOSITIVOS DE TRANSMISIÓN DE MEDIOS, POR USO FINAL, 2020-2027 (MILLONES DE USD)
- TABLA 55 CHINA: MERCADO DE DISPOSITIVOS DE TRANSMISIÓN DE MEDIOS, POR TIPO DE DISPOSITIVO, 2020-2027 (MILLONES DE USD)
- TABLA 56 CHINA: MERCADO DE DISPOSITIVOS DE TRANSMISIÓN DE MEDIOS, POR RESOLUCIÓN, 2020-2027 (USD MILLONES)
- TABLA 57 CHINA: MERCADO DE DISPOSITIVOS DE STREAMING MULTIMEDIA, POR APLICACIÓN, 2020-2027 (USD MILLONES)
- TABLA 58 CHINA: MERCADO DE DISPOSITIVOS DE STREAMING MULTIMEDIA, POR USO FINAL, 2020-2027 (USD MILLONES)
- TABLA 59 JAPÓN: MERCADO DE DISPOSITIVOS DE STREAMING MULTIMEDIA, POR TIPO DE DISPOSITIVO, 2020-2027 (USD MILLONES)
- TABLA 60 JAPÓN: MERCADO DE DISPOSITIVOS DE STREAMING MULTIMEDIA, POR RESOLUCIÓN, 2020-2027 (USD MILLONES)
- TABLA 61 JAPÓN: MERCADO DE DISPOSITIVOS DE STREAMING MULTIMEDIA, POR APLICACIÓN, 2020-2027 (USD MILLONES)
- TABLA 62 JAPÓN: MERCADO DE DISPOSITIVOS DE STREAMING MULTIMEDIA, POR USO FINAL, 2020-2027 (MILLONES DE USD)
- TABLA 63 INDIA: MERCADO DE DISPOSITIVOS DE STREAMING MULTIMEDIA, POR TIPO DE DISPOSITIVO, 2020-2027 (MILLONES DE USD)
- TABLA 64 INDIA: MERCADO DE DISPOSITIVOS DE STREAMING MULTIMEDIA, POR RESOLUCIÓN, 2020-2027 (MILLONES DE USD)
- TABLA 65 INDIA: MERCADO DE DISPOSITIVOS DE STREAMING MULTIMEDIA, POR APLICACIÓN, 2020-2027 (MILLONES DE USD)
- TABLA 66 INDIA: MERCADO DE DISPOSITIVOS DE STREAMING MULTIMEDIA, POR USO FINAL, 2020-2027 (MILLONES DE USD)
- TABLA 67 COREA DEL SUR: MERCADO DE DISPOSITIVOS DE STREAMING MULTIMEDIA, POR DISPOSITIVO TIPO, 2020-2027 (USD MILLONES)
- TABLA 68 COREA DEL SUR: MERCADO DE DISPOSITIVOS DE STREAMING MEDIA, POR RESOLUCIÓN, 2020-2027 (USD MILLONES)
- TABLA 69 COREA DEL SUR: MERCADO DE DISPOSITIVOS DE STREAMING MEDIA, POR APLICACIÓN, 2020-2027 (USD MILLONES)
- TABLA 70 COREA DEL SUR: MERCADO DE DISPOSITIVOS DE STREAMING MEDIA, POR USO FINAL, 2020-2027 (USD MILLONES)
- TABLA 71 RESTO DE ASIA-PACÍFICO: MERCADO DE DISPOSITIVOS DE STREAMING MEDIA, POR TIPO DE DISPOSITIVO, 2020-2027 (USD MILLONES)
- TABLA 72 RESTO DE ASIA-PACÍFICO: MERCADO DE DISPOSITIVOS DE STREAMING MEDIA, POR RESOLUCIÓN, 2020-2027 (MILLONES DE USD)
- TABLA 73 RESTO DE ASIA-PACÍFICO: MERCADO DE DISPOSITIVOS DE STREAMING MULTIMEDIA, POR APLICACIÓN, 2020-2027 (MILLONES DE USD)
- TABLA 74 RESTO DE ASIA-PACÍFICO: MERCADO DE DISPOSITIVOS DE STREAMING MULTIMEDIA, POR USO FINAL, 2020-2027 (MILLONES DE USD)
- TABLA 75 ORIENTE MEDIO Y ÁFRICA: MERCADO DE DISPOSITIVOS DE STREAMING MULTIMEDIA, POR TIPO DE DISPOSITIVO, 2020-2027 (MILLONES DE USD)
- TABLA 76 ORIENTE MEDIO Y ÁFRICA: MERCADO DE DISPOSITIVOS DE STREAMING MULTIMEDIA, POR RESOLUCIÓN, 2020-2027 (MILLONES DE USD)
- TABLA 77 ORIENTE MEDIO Y ÁFRICA: DISPOSITIVOS DE STREAMING MULTIMEDIA MERCADO, POR APLICACIÓN, 2020-2027 (MILLONES DE USD)
- TABLA 78 ORIENTE MEDIO Y ÁFRICA: MERCADO DE DISPOSITIVOS DE STREAMING MULTIMEDIA, POR USO FINAL, 2020-2027 (MILLONES DE USD)
- TABLA 79 ARABIA SAUDÍ: MERCADO DE DISPOSITIVOS DE STREAMING MULTIMEDIA, POR TIPO DE DISPOSITIVO, 2020-2027 (MILLONES DE USD)
- TABLA 80 ARABIA SAUDÍ: MERCADO DE DISPOSITIVOS DE STREAMING MULTIMEDIA, POR RESOLUCIÓN, 2020-2027 (MILLONES DE USD)
- TABLA 81 ARABIA SAUDÍ: MERCADO DE DISPOSITIVOS DE STREAMING MULTIMEDIA, POR APLICACIÓN, 2020-2027 (MILLONES DE USD)
- TABLA 82 ARABIA SAUDÍ: MERCADO DE DISPOSITIVOS DE STREAMING MULTIMEDIA, POR USO FINAL, 2020-2027 (MILLONES DE USD)
- TABLA 83 EMIRATOS ÁRABES UNIDOS: MERCADO DE DISPOSITIVOS DE TRANSMISIÓN DE MEDIOS, POR TIPO DE DISPOSITIVO, 2020-2027 (MILLONES DE USD)
- TABLA 84 EMIRATOS ÁRABES UNIDOS: MERCADO DE DISPOSITIVOS DE TRANSMISIÓN DE MEDIOS, POR RESOLUCIÓN, 2020-2027 (MILLONES DE USD)
- TABLA 85 EMIRATOS ÁRABES UNIDOS: MERCADO DE DISPOSITIVOS DE TRANSMISIÓN DE MEDIOS, POR APLICACIÓN, 2020-2027 (MILLONES DE USD)
- TABLA 86 EMIRATOS ÁRABES UNIDOS: MERCADO DE DISPOSITIVOS DE TRANSMISIÓN DE MEDIOS, POR USO FINAL, 2020-2027 (MILLONES DE USD)
- TABLA 867 SUDÁFRICA: MERCADO DE INTERFACES DE COMUNICACIONES, POR TIPO DE DISPOSITIVO, 2020-2027 (MILLONES DE USD) MILLONES)
- TABLA 88 SUDÁFRICA: MERCADO DE INTERFACES DE COMUNICACIONES, POR RESOLUCIÓN, 2020-2027 (MILLONES DE USD)
- TABLA 89 SUDÁFRICA: MERCADO DE INTERFACES DE COMUNICACIONES, POR APLICACIÓN, 2020-2027 (MILLONES DE USD)
- TABLA 90 SUDÁFRICA: MERCADO DE INTERFACES DE COMUNICACIONES, POR USO FINAL, 2020-2027 (MILLONES DE USD)
- TABLA 91 RESTO DE ORIENTE MEDIO Y ÁFRICA: MERCADO DE INTERFACES DE COMUNICACIONES, POR TIPO DE DISPOSITIVO, 2020-2027 (MILLONES DE USD)
- TABLA 92 RESTO DE ORIENTE MEDIO Y ÁFRICA: MERCADO DE INTERFACES DE COMUNICACIONES, POR RESOLUCIÓN, 2020-2027 (MILLONES DE USD)
- TABLA 93 RESTO DE ORIENTE MEDIO Y ÁFRICA: MERCADO DE INTERFACES DE COMUNICACIONES, POR APLICACIÓN, 2020-2027 (MILLONES DE USD)
- TABLA 94 RESTO DE ORIENTE MEDIO Y ÁFRICA: MERCADO DE INTERFACES DE COMUNICACIONES, POR USO FINAL, 2020-2027 (MILLONES DE USD)
- TABLA 95 ORIENTE MEDIO Y ÁFRICA: MERCADO DE INTERFACES DE COMUNICACIONES, POR TIPO DE DISPOSITIVO, 2020-2027 (MILLONES DE USD)
- TABLA 96 ORIENTE MEDIO Y ÁFRICA: MERCADO DE INTERFACES DE COMUNICACIONES, POR RESOLUCIÓN, 2020-2027 (MILLONES DE USD)
- TABLA 97 ORIENTE MEDIO Y ÁFRICA: MERCADO DE INTERFACES DE COMUNICACIONES, POR APLICACIÓN, 2020-2027 (MILLONES DE USD)
- TABLA 98 ORIENTE MEDIO Y ÁFRICA: MERCADO DE INTERFACES DE COMUNICACIONES, POR USO FINAL, 2020-2027 (MILLONES DE USD)
- TABLA 99 BRASIL: MERCADO DE INTERFACES DE COMUNICACIONES, POR TIPO DE DISPOSITIVO, 2020-2027 (MILLONES DE USD)
- TABLA 100 BRASIL: MERCADO DE INTERFACES DE COMUNICACIONES, POR RESOLUCIÓN, 2020-2027 (MILLONES DE USD)
- TABLA 101 BRASIL: MERCADO DE INTERFACES DE COMUNICACIONES, POR APLICACIÓN, 2020-2027 (MILLONES DE USD)
- TABLA 102 BRASIL: MERCADO DE INTERFACES DE COMUNICACIONES, POR USO FINAL, 2020-2027 (MILLONES DE USD)
- TABLA 103 ARGENTINA: MERCADO DE INTERFACES DE COMUNICACIONES, POR DISPOSITIVO TIPO, 2020-2027 (USD MILLONES)
- TABLA 104 ARGENTINA: MERCADO DE INTERFACES DE COMUNICACIONES, POR RESOLUCIÓN, 2020-2027 (USD MILLONES)
- TABLA 105 ARGENTINA: MERCADO DE INTERFACES DE COMUNICACIONES, POR APLICACIÓN, 2020-2027 (USD MILLONES)
- TABLA 106 ARGENTINA: MERCADO DE INTERFACES DE COMUNICACIONES, POR USO FINAL, 2020-2027 (USD MILLONES)
- TABLA 107 COLOMBIA: MERCADO DE INTERFACES DE COMUNICACIONES, POR TIPO DE DISPOSITIVO, 2020-2027 (USD MILLONES)
- TABLA 108 COLOMBIA: MERCADO DE INTERFACES DE COMUNICACIONES, POR RESOLUCIÓN, 2020-2027 (USD MILLONES)
- TABLA 109 COLOMBIA: MERCADO DE INTERFACES DE COMUNICACIONES, POR APLICACIÓN, 2020-2027 (USD MILLONES)
- TABLA 110 COLOMBIA: MERCADO DE INTERFACES DE COMUNICACIONES, POR USO FINAL, 2020-2027 (USD MILLONES)
- TABLA 111 RESTO DE SUDAMÉRICA: MERCADO DE INTERFACES DE COMUNICACIONES, POR TIPO DE DISPOSITIVO, 2020-2027 (USD MILLONES)
- TABLA 112 RESTO DE SUDAMÉRICA: MERCADO DE INTERFACES DE COMUNICACIONES, POR RESOLUCIÓN, 2020-2027 (MILLONES DE USD)
- TABLA 113 RESTO DE SUDAMÉRICA: MERCADO DE INTERFACES DE COMUNICACIONES, POR APLICACIÓN, 2020-2027 (MILLONES DE USD)
- TABLA 114 RESTO DE SUDAMÉRICA: MERCADO DE INTERFACES DE COMUNICACIONES, POR USO FINAL, 2020-2027 (MILLONES DE USD)
- ?
- LISTA DE FIGURAS
- FIGURA 1 SINOPSIS DEL MERCADO
- FIGURA 2 PROCESO DE INVESTIGACIÓN DE MRFR
- FIGURA 3 DE ARRIBA HACIA ABAJO Y ENFOQUE DE ABAJO HACIA ARRIBA
- FIGURA 4 MERCADO MUNDIAL DE DISPOSITIVOS DE STREAMING MULTIMEDIA, POR TIPO DE DISPOSITIVO, 2020-2027 (MILLONES DE USD)
- FIGURA 5 MERCADO MUNDIAL DE DISPOSITIVOS DE STREAMING MULTIMEDIA, POR RESOLUCIÓN, 2020-2027 (MILLONES DE USD)
- FIGURA 6 MERCADO MUNDIAL DE DISPOSITIVOS DE STREAMING MULTIMEDIA, POR APLICACIÓN, 2020-2027 (MILLONES DE USD)
- FIGURA 7 MERCADO MUNDIAL DE DISPOSITIVOS DE STREAMING MULTIMEDIA, POR USO FINAL, 2020-2027 (MILLONES DE USD)
- FIGURA 9 MERCADO MUNDIAL DE DISPOSITIVOS DE STREAMING MULTIMEDIA, POR REGIÓN, 2020-2027 (MILLONES DE USD)
- FIGURA 11 NORTE AMÉRICA: MERCADO DE DISPOSITIVOS DE STREAMING MULTIMEDIA, POR PAÍS, 2020-2027 (MILLONES DE USD)
- FIGURA 12 AMÉRICA DEL NORTE: MERCADO DE DISPOSITIVOS DE STREAMING MULTIMEDIA, POR TIPO DE DISPOSITIVO, 2020-2027 (MILLONES DE USD)
- FIGURA 13 AMÉRICA DEL NORTE: MERCADO DE DISPOSITIVOS DE STREAMING MULTIMEDIA, POR RESOLUCIÓN, 2020-2027 (MILLONES DE USD)
- FIGURA 14 AMÉRICA DEL NORTE: MERCADO DE DISPOSITIVOS DE STREAMING MULTIMEDIA, POR APLICACIÓN, 2020-2027 (MILLONES DE USD)
- FIGURA 15 AMÉRICA DEL NORTE: MERCADO DE DISPOSITIVOS DE STREAMING MULTIMEDIA, POR USO FINAL, 2020-2027 (MILLONES DE USD)
- FIGURA 16 EUROPA: MERCADO DE DISPOSITIVOS DE STREAMING MULTIMEDIA, POR PAÍS, 2020-2027 (MILLONES DE USD)
- FIGURA 17 EUROPA: MERCADO DE DISPOSITIVOS DE STREAMING MULTIMEDIA, POR TIPO DE DISPOSITIVO, 2020-2027 (MILLONES DE USD)
- FIGURA 18 EUROPA: MERCADO DE DISPOSITIVOS DE STREAMING MULTIMEDIA, POR RESOLUCIÓN, 2020-2027 (MILLONES DE USD)
- FIGURA 19 EUROPA: MERCADO DE DISPOSITIVOS DE STREAMING MULTIMEDIA, POR APLICACIÓN, 2020-2027 (MILLONES DE USD)
- FIGURA 20 EUROPA: MERCADO DE DISPOSITIVOS DE STREAMING MULTIMEDIA, POR USO FINAL, 2020-2027 (MILLONES DE USD)
- FIGURA 21 ASIA-PACÍFICO: DISPOSITIVOS DE STREAMING MULTIMEDIA MERCADO, POR PAÍS, 2020-2027 (MILLONES DE USD)
- FIGURA 22 ASIA-PACÍFICO: MERCADO DE DISPOSITIVOS DE STREAMING MEDIA, POR TIPO DE DISPOSITIVO, 2020-2027 (MILLONES DE USD)
- FIGURA 23 ASIA-PACÍFICO: MERCADO DE DISPOSITIVOS DE STREAMING MEDIA, POR RESOLUCIÓN, 2020-2027 (MILLONES DE USD)
- FIGURA 24 ASIA-PACÍFICO: MERCADO DE DISPOSITIVOS DE STREAMING MEDIA, POR APLICACIÓN, 2020-2027 (MILLONES DE USD)
- FIGURA 24 ASIA-PACÍFICO: MERCADO DE DISPOSITIVOS DE STREAMING MEDIA, POR USO FINAL, 2020-2027 (MILLONES DE USD)
- FIGURA 26 ORIENTE MEDIO Y ÁFRICA: MERCADO DE DISPOSITIVOS DE TRANSMISIÓN DE MEDIOS, POR TIPO DE DISPOSITIVO, 2020-2027 (MILLONES DE USD)
- FIGURA 27 ORIENTE MEDIO Y ÁFRICA: MERCADO DE DISPOSITIVOS DE TRANSMISIÓN DE MEDIOS, POR RESOLUCIÓN, 2020-2027 (MILLONES DE USD)
- FIGURA 28 ORIENTE MEDIO Y ÁFRICA: MERCADO DE DISPOSITIVOS DE TRANSMISIÓN DE MEDIOS, POR APLICACIÓN, 2020-2027 (MILLONES DE USD)
- FIGURA 29 ORIENTE MEDIO Y ÁFRICA: MERCADO DE DISPOSITIVOS DE STREAMING MULTIMEDIA, POR USO FINAL, 2020-2027 (MILLONES DE USD)
- FIGURA 30 SUDAMÉRICA: MERCADO DE DISPOSITIVOS DE STREAMING MULTIMEDIA, POR TIPO DE DISPOSITIVO, 2020-2027 (MILLONES DE USD)
- FIGURA 31 SUDAMÉRICA: MERCADO DE DISPOSITIVOS DE STREAMING MULTIMEDIA, POR RESOLUCIÓN, 2020-2027 (MILLONES DE USD)
- FIGURA 32 SUDAMÉRICA: MERCADO DE DISPOSITIVOS DE STREAMING MULTIMEDIA, POR APLICACIÓN, 2020-2027 (MILLONES DE USD)
- FIGURA 32 SUDAMÉRICA: MERCADO DE DISPOSITIVOS DE STREAMING MULTIMEDIA, POR USO FINAL, 2020-2027 (MILLONES DE USD)
-
12.1 Amazon.com, Inc.
Informes relacionados

Customer Stories

“This is really good guys. Excellent work on a tight deadline. I will continue to use you going forward and recommend you to others. Nice job”
 Noah Malgeri
Co-Founder

“Thanks for sending the report it gives us a good global view of the Betaïne market.”
 Peter Groot koerkamp
Account and Business Manager

“We found the report very insightful! we found your research firm very helpful. I'm sending this email to secure our future business.”
 Younghwan Choi
Senior Retail Manager

“I am very pleased with how market segments have been defined in a relevant way for my purposes (such as "Portable Freezers & refrigerators" and "last-mile"). In general the report is well structured. Thanks very much for your efforts.”
 Mark Irwin
Management Consultant

“We got the report in time, we really thank you for your support in this process. I also thank to all of your team as they did a great job.”
 Akif Moroglu
Strategy & Business Development Director

“The Automotive 48V ECU Components Procurement Intelligence Study” was a complex project, but the Market Research Future (MRFR) team handled it with quality, agility, and customer-centricity. They delivered all requested data on time and within the agreed scope. The team, including Shubhendra Anand and Rahul Gotadki, was always readily available to clarify questions and swiftly implement necessary adjustments, driving the project to a successful conclusion within a very demanding timeframe.
I would also like to specifically commend Akshay Agarwal for his responsiveness and support at every stage—from our initial inquiry on May 6th through to final delivery on June 18th. His dedication made the entire process seamless.”
 Guilherme Gomes Martins
Product Management Director

“Thanks. It’s been a pleasure working with you, please use me as reference with any other Intel employees.”
 Joseph Aguayo
Sales Operations & Pricing Manager

“Thank you, this will be very helpful for OQS.”
 La Terria Dodd
Program Support Specialist

“I have been reading the first document or the study, ,the Global HVAC and FP market report 2021 till 2026. Must say, good info! I have not gone in depth at all parts, but got a good indication of the data inside!”
 Rob Kooiker
Group Product Manager HVAC & Fire Protection GMA