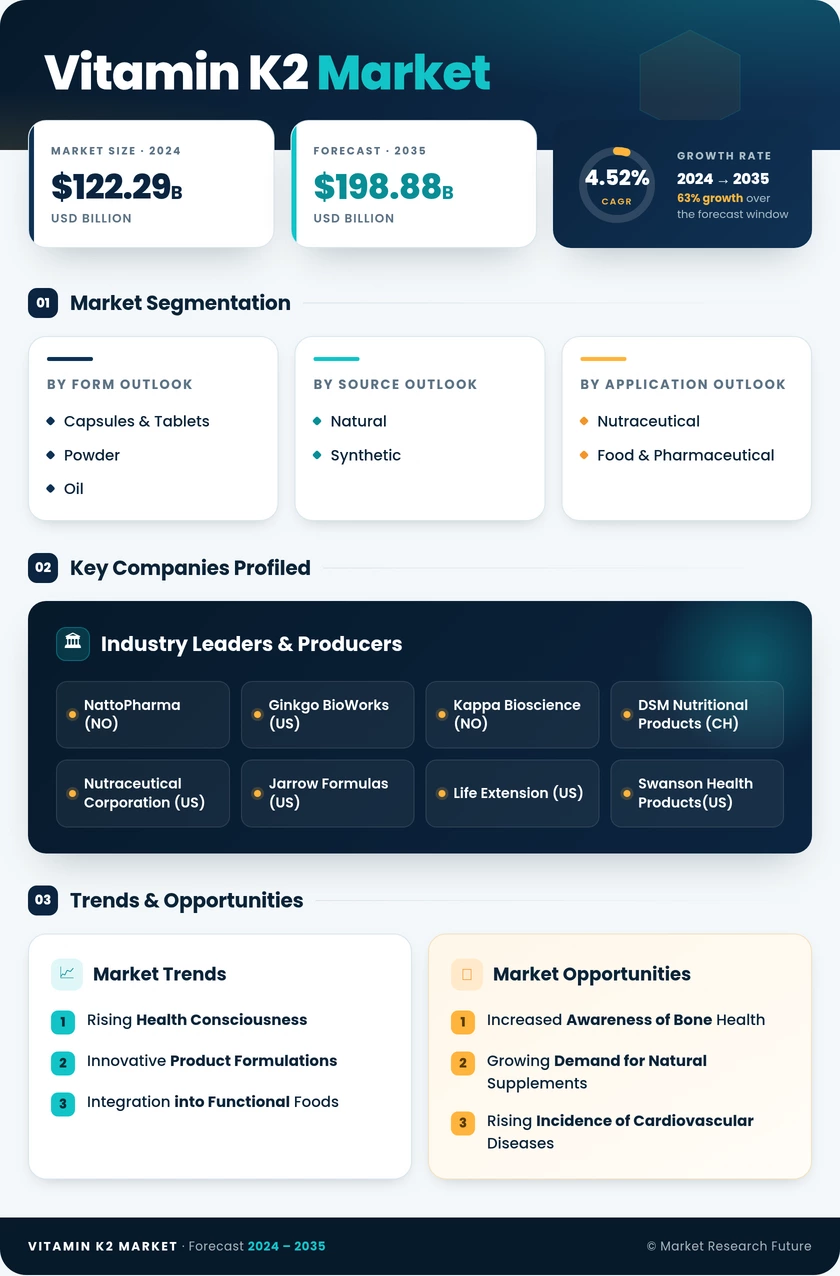
Vitamin K2 Market (2026 - 2035)

ID: MRFR/HC/6026-CR 117 Pages Vikita Thakur Last Updated: October 31, 2026
Vitamin K2 market Research Report Information By Product Type (MK-7 and MK-4 & Combination Drugs), By Source (Natural and Synthetic), By Form (Capsules & Tablets, Powder, and Oil), By Application (Nutraceutical and Food & Pharmaceutical), And By Region (North America, Europe, Asia-Pacific, And Rest Of The World) - Growth & Industry Forecast 2025 To 2035
Vitamin K2 Market
Market Size
Forecast Period2026-2035
CAGR (2026-2035)10.3%
2025 Market SizeUSD 134.2 Million
2035 Market SizeUSD 358.7 Million
Key Players
Gnosis by Lesaffre
Balchem Corporation
J-Oil Mills, Inc.
Kyowa Hakko Bio Co., Ltd.
Viridis BioPharma Pvt. Ltd.
Novonesis A/S
Opportunities
  • Fortification of Everyday Foods and Beverages
  • Emerging-Market Expansion in India and Brazil
  • Biomarker-Linked and Subscription Business Models
  1. 1 Market Summary | |
  2. 2 Key Report Takeaways | |
    1. 2.1 By Product Type | |
    2. 2.2 By Source | |
    3. 2.3 By Form2.4 By Application | |
    4. 2.5 By Region | |
  3. 3 Market Size and Forecast (2021–2035) | |
    1. 3.1 Historical Market Size (2021–2025) | |
    2. 3.2 Forecast Market Size (2026–2035) | |
    3. 3.3 Year-over-Year Growth Analysis | |
  4. 4 Driver Impact Analysis | |
    1. 4.1 Ageing Global Population | |
    2. 4.2 Osteoporosis and Fracture Burden | |
    3. 4.3 Cardiovascular Research Momentum | |
    4. 4.4 High Supplement Usage Rates | |
    5. 4.5 Vitamin D3 and K2 Co-Formulation | |
    6. 4.6 Clear Regulatory Pathways | |
    7. 4.7 Consolidation and Synthetic Scale-Up | |
  5. 5 Restraints Impact Analysis | |
    1. 5.1 Mixed Outcomes in Clinical Trials | |
    2. 5.2 No Separate Intake Reference for K2 | |
    3. 5.3 Anticoagulant Interaction Concerns | |
    4. 5.4 Stability Losses in Mineral Formulas | |
    5. 5.5 Tighter Ingredient Compliance Scrutiny | |
  6. 6 Opportunities | |
    1. 6.1 Fortification of Everyday Foods and Beverages | |
    2. 6.2 Emerging-Market Expansion in India and Brazil | |
    3. 6.3 Biomarker-Linked and Subscription Business Models | |
    4. 6.4 Sports and Women's Health Positioning | |
  7. 7 Regional Market Share and Country-Level Analysis | |
    1. 7.1 North America | | |
      1. 7.1.1 United States | | |
      2. 7.1.2 Canada | | |
      3. 7.1.3 Rest of North America | |
    2. 7.2 Europe | | |
      1. 7.2.1 Germany | | |
      2. 7.2.2 United Kingdom | | |
      3. 7.2.3 France | | |
      4. 7.2.4 Italy | | |
      5. 7.2.5 Spain | | |
      6. 7.2.6 Rest of Europe | |
    3. 7.3 Asia-Pacific | | |
      1. 7.3.1 China | | |
      2. 7.3.2 Japan | | |
      3. 7.3.3 India | | |
      4. 7.3.4 South Korea | | |
      5. 7.3.5 Rest of Asia-Pacific | |
    4. 7.4 South America | | |
      1. 7.4.1 Brazil | | |
      2. 7.4.2 Argentina | | |
      3. 7.4.3 Rest of South America | |
    5. 7.5 Middle-East and Africa | | |
      1. 7.5.1 Saudi Arabia | | |
      2. 7.5.2 UAE | | |
      3. 7.5.3 South Africa | | |
      4. 7.5.4 Rest of Middle-East and Africa | |
  8. 8 Future Outlook (2026–2035) | |
    1. 8.1 Precision Fermentation and Synthesis | |
    2. 8.2 Biomarker-Guided Nutrition | |
    3. 8.3 The Healthy Ageing Economy | |
    4. 8.4 Clean Label and Supply Traceability | |
  9. 9 Segmentation Analysis | |
    1. 9.1 By Product Type | | |
      1. 9.1.1 Menaquinone-7 (MK-7) | | |
      2. 9.1.2 Menaquinone-4 (MK-4) | | |
      3. 9.1.3 Others | |
    2. 9.2 By Source | | |
      1. 9.2.1 Natural | | |
      2. 9.2.2 Synthetic | |
    3. 9.3 By Form | | |
      1. 9.3.1 Powder | | |
      2. 9.3.2 Oil | |
    4. 9.4 By Application | | |
      1. 9.4.1 Functional Food and Beverage | | |
      2. 9.4.2 Health Supplements | | |
      3. 9.4.3 Animal Nutrition | | |
      4. 9.4.4 Pharmaceutical | | |
      5. 9.4.5 Others | |
  10. 10 Competitive Landscape | |
    1. 10.1 Market Concentration Analysis | |
    2. 10.2 Competitive Benchmarking Matrix | |
    3. 10.3 Company Profiles | | |
      1. 10.3.1 Gnosis by Lesaffre | | |
      2. 10.3.2 Balchem Corporation (Kappa Bioscience) | | |
      3. 10.3.3 J-Oil Mills, Inc. | | |
      4. 10.3.4 Kyowa Hakko Bio Co., Ltd. | | |
      5. 10.3.5 Viridis BioPharma Pvt. Ltd. | | |
      6. 10.3.6 Novonesis A/S | | |
      7. 10.3.7 dsm-firmenich | | |
      8. 10.3.8 GeneFerm Biotechnology Co., Ltd. | | |
      9. 10.3.9 Vesta Nutra | | |
      10. 10.3.10 Seebio Biotech | | |
      11. 10.3.11 GF Fermentech | |
  11. 11 Recent News and Developments | |
  12. 12 Report Scope and Methodology | |
  13. 13 Detailed Sources and Citations | |
  14. 14 Frequently Asked Questions (FAQs) | | LIST OF TABLES | |
  15. TABLE 1 Global Market Size and Forecast, by Revenue (USD Million), 2021–2035 | |
  16. TABLE 2 Year-over-Year Growth Analysis, 2021–2035 | |
  17. TABLE 3 Driver Impact Analysis | |
  18. TABLE 4 Restraints Impact Analysis | |
  19. TABLE 5 Global Market Size, by Region, 2025 (USD Million) | |
  20. TABLE 6 North America Market Size, by Country, 2021–2035 (USD Million) | |
  21. TABLE 7 Europe Market Size, by Country, 2021–2035 (USD Million) | |
  22. TABLE 8 Asia-Pacific Market Size, by Country, 2021–2035 (USD Million) | |
  23. TABLE 9 South America Market Size, by Country, 2021–2035 (USD Million) | |
  24. TABLE 10 Middle-East and Africa Market Size, by Country, 2021–2035 (USD Million) | |
  25. TABLE 11 Global Market Size, by Product Type, 2021–2035 (USD Million) | |
  26. TABLE 12 Global Market Size, by Source, 2021–2035 (USD Million) | |
  27. TABLE 13 Global Market Size, by Form, 2021–2035 (USD Million) | |
  28. TABLE 14 Competitive Benchmarking Matrix, 2025 | |
  29. TABLE 15 Report Scope and Methodology | |
  30. TABLE 16 Detailed Sources and Citations | | LIST OF FIGURES | |
  31. FIGURE 1 Market Dynamics Overview (Drivers, Restraints, Opportunities) | |
  32. FIGURE 2 Industry Value Chain Analysis | |
  33. FIGURE 3 Porter's Five Forces Analysis | |
  34. FIGURE 4 Global Market Size Trend, 2021–2035 (USD Million) | |
  35. FIGURE 5 Market Share, by Product Type, 2025 (%) | |
  36. FIGURE 6 Market Share, by Source, 2025 (%) | |
  37. FIGURE 7 Market Share, by Form, 2025 (%) | |
  38. FIGURE 8 Market Share, by Region, 2025 (%) | |
  39. FIGURE 9 Regional Growth Comparison, 2026–2035 (CAGR %) | |
  40. FIGURE 10 Competitive Landscape and Revenue Share Ranges, 2025

Segmentation Quick Reference

DimensionSub-SegmentsDominant SegmentFastest Growing Segment
By Product TypeMenaquinone-7 (MK-7), Menaquinone-4 (MK-4), OthersMenaquinone-7 (MK-7) (64.5% share)Menaquinone-7 (MK-7) (64.5% share)
By SourceNatural, SyntheticNatural (62.6% share)Synthetic (12.0% CAGR)
By FormPowder, OilPowder (50.9% share)Oil (11.9% CAGR)
By RegionNorth America, Europe, Asia-Pacific, South America, Middle-East and AfricaNorth America (38.6% share)Asia-Pacific (11.8% CAGR)

Market Segmentation Overview

By Product Type

Sub-SegmentKey Trend
Menaquinone-7 (MK-7)Default choice for D3 and K2 combination supplements
Menaquinone-4 (MK-4)Prescription osteoporosis therapy in Japan
OthersFull-spectrum MK-6, MK-7 and MK-9 blends for premium shelves

Menaquinone-7 (MK-7) both leads and grows fastest because its multi-day half-life supports microgram-level, once-daily dosing that fits consumer supplements. Menaquinone-4 (MK-4) holds a stable pharmaceutical niche, but its rapid clearance confines it to milligram-dose medical regimens. Others remain a small differentiation play for brands targeting informed premium buyers.

By Source

Sub-SegmentKey Trend
NaturalFermentation-derived, clean-label positioning
SyntheticHigh all-trans purity and batch consistency

Natural material leads on consumer preference for fermentation-derived ingredients linked to traditional foods such as natto. Synthetic material grows fastest as pharmaceutical buyers and multinational brands demand predictable potency and secure supply. Improved synthesis economics are narrowing the price gap between the two sources.

By Form

Sub-SegmentKey Trend
PowderEncapsulated grades for tablets, capsules and fortified foods
OilSoftgels and liquid drops paired with vitamin D3

Powder leads because it suits the widest range of dosage formats, and encapsulated powder protects MK-7 from mineral-driven degradation. Oil grows fastest on the back of softgels and liquid drops, which blend easily with oil-soluble vitamin D3 and appeal to consumers who avoid tablets.


Download PDF ×

We do not share your information with anyone. However, we may send you emails based on your report interest from time to time. You may contact us at any time to opt-out.