Vitamin C Market Segmentation
Vitamin C Market By Type (USD Billion, 2025-2035)
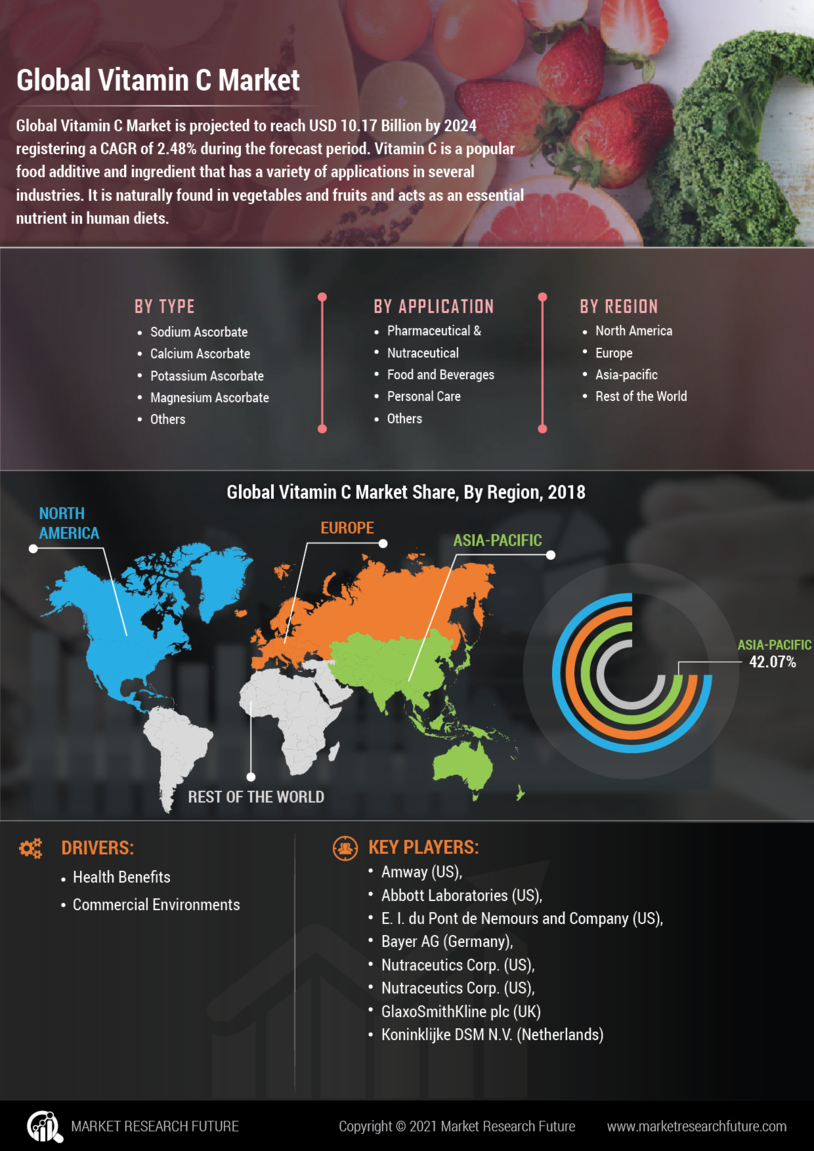
- Sodium Ascorbate
- Calcium Ascorbate
- Potassium Ascorbate
- Magnesium Ascorbate
- Others
Vitamin C Market By Application (USD Billion, 2025-2035)
- Pharmaceutical & Nutraceutical
- Food and Beverages
- Personal Care
- Others