ID: MRFR/F-B & N/0735-HCR | August 2022 | Region: Global | 90 Pages
Table of Contents
1. 1 EXECUTIVE SUMMARY
1.1. Market Attractiveness Analysis
1.1.1. Global Low-Intensity Sweeteners Market, by Category
1.1.2. Global Low-Intensity Sweeteners Market, by Type
1.1.3. Global Low-Intensity Sweeteners Market, by Application
1.1.4. Global Low-Intensity Sweeteners Market, by Region
2. MARKET INTRODUCTION
2.1. Definition
2.2. Scope of the Study
2.3. Market Structure
2.4. Key Buying Criteria
2.5. Macro Factor Indicator Analysis
3. RESEARCH METHODOLOGY
3.1. Research Process
3.2. Primary Research
3.3. Secondary Research
3.4. Market Size Estimation
3.5. Forecast Model
3.6. List of Assumptions
4. MARKET DYNAMICS
4.1. Introduction
4.2. Drivers
4.2.1. Driver 1
4.2.2. Driver 2
4.3. Restraints
4.3.1. Restraint 1
4.3.2. Restraint 2
4.4. Opportunities
4.4.1. Opportunity 1
4.4.2. Opportunity 2
4.5. Challenges
4.5.1. Challenge 1
4.5.2. Challenge 2
5. MARKET FACTOR ANALYSIS
5.1. Value Chain Analysis
5.2. Supply Chain Analysis
5.3. Porterβs Five Forces Model
5.3.1. Bargaining Power of Suppliers
5.3.2. Bargaining Power of Buyers
5.3.3. Threat of New Entrants
5.3.4. Threat of Substitutes
5.3.5. Intensity of Rivalry
6. GLOBAL LOW-INTENSITY SWEETENERS MARKET, BY CATEGORY
6.1. Introduction
6.2. Natural
6.2.1. Natural: Market Estimates & Forecast, by Region/Country, 2020β2027
6.3. Synthetic
6.3.1. Synthetic: Market Estimates & Forecast, by Region/Country, 2020β2027
7. GLOBAL LOW-INTENSITY SWEETENERS MARKET, BY TYPE
7.1. Introduction
7.2. Sorbitol
7.2.1. Sorbitol: Market Estimates & Forecast, by Region/Country, 2020β2027
7.3. Xylitol
7.3.1. Xylitol: Market Estimates & Forecast, by Region/Country, 2020β2027
7.4. Lactitol
7.4.1. Lactitol: Market Estimates & Forecast, by Region/Country, 2020β2027
7.5. Allulose
7.5.1. Allulose: Market Estimates & Forecast, by Region/Country, 2020β2027
7.6. Others
7.6.1. Others: Market Estimates & Forecast, by Region/Country, 2020β2027
8. GLOBAL LOW-INTENSITY SWEETENERS MARKET, BY APPLICATION
8.1. Introduction
8.2. Bakery & Confectionary
8.2.1. Bakery & Confectionary: Market Estimates & Forecast, by Region/Country, 2020β2027
8.3. Beverages
8.3.1. Beverages: Market Estimates & Forecast, by Region/Country, 2020β2027
8.4. Dairy & Frozen Dessert
8.4.1. Dairy & Frozen Dessert: Market Estimates & Forecast, by Region/Country, 2020β2027
8.5. Sweet & Savory Snacks
8.5.1. Sweet & Savory Snacks: Market Estimates & Forecast, by Region/Country, 2020β2027
8.6. Others
8.6.1. Others: Market Estimates & Forecast, by Region/Country, 2020β2027
9. GLOBAL LOW-INTENSITY SWEETENERS MARKET MARKET, BY REGION
9.1. Introduction
9.2. North America
9.2.1. Market Estimates & Forecast, by Category, 2020β2027
9.2.2. Market Estimates & Forecast, by Type, 2020β2027
9.2.3. Market Estimates & Forecast, by Application, 2020β2027
9.2.4. Market Estimates & Forecast, by Country, 2020β2027
9.2.5. US
9.2.5.1. Market Estimates & Forecast, by Category, 2020β2027
9.2.5.2. Market Estimates & Forecast, by Type, 2020β2027
9.2.5.3. Market Estimates & Forecast, by Application, 2020β2027
9.2.6. Canada
9.2.6.1. Market Estimates & Forecast, by Category, 2020β2027
9.2.6.2. Market Estimates & Forecast, by Type, 2020β2027
9.2.6.3. Market Estimates & Forecast, by Application, 2020β2027
9.2.7. Mexico
9.2.7.1. Market Estimates & Forecast, by Category, 2020β2027
9.2.7.2. Market Estimates & Forecast, by Type, 2020β2027
9.2.7.3. Market Estimates & Forecast, by Application, 2020β2027
9.3. Europe
9.3.1. Market Estimates & Forecast, by Category, 2020β2027
9.3.2. Market Estimates & Forecast, by Type, 2020β2027
9.3.3. Market Estimates & Forecast, by Application, 2020β2027
9.3.4. Market Estimates & Forecast, by Country, 2020β2027
9.3.5. Germany
9.3.5.1. Market Estimates & Forecast, by Category, 2020β2027
9.3.5.2. Market Estimates & Forecast, by Type, 2020β2027
9.3.5.3. Market Estimates & Forecast, by Application, 2020β2027
9.3.6. UK
9.3.6.1. Market Estimates & Forecast, by Category, 2020β2027
9.3.6.2. Market Estimates & Forecast, by Type, 2020β2027
9.3.6.3. Market Estimates & Forecast, by Application, 2020β2027
9.3.7. France
9.3.7.1. Market Estimates & Forecast, by Category, 2020β2027
9.3.7.2. Market Estimates & Forecast, by Type, 2020β2027
9.3.7.3. Market Estimates & Forecast, by Application, 2020β2027
9.3.8. Spain
9.3.8.1. Market Estimates & Forecast, by Category, 2020β2027
9.3.8.2. Market Estimates & Forecast, by Type, 2020β2027
9.3.8.3. Market Estimates & Forecast, by Application, 2020β2027
9.3.9. Italy
9.3.9.1. Market Estimates & Forecast, by Category, 2020β2027
9.3.9.2. Market Estimates & Forecast, by Type, 2020β2027
9.3.9.3. Market Estimates & Forecast, by Application, 2020β2027
9.3.10. Rest of Europe
9.3.10.1. Market Estimates & Forecast, by Category, 2020β2027
9.3.10.2. Market Estimates & Forecast, by Type, 2020β2027
9.3.10.3. Market Estimates & Forecast, by Application, 2020β2027
9.4. Asia-Pacific
9.4.1. Market Estimates & Forecast, by Category, 2020β2027
9.4.2. Market Estimates & Forecast, by Type, 2020β2027
9.4.3. Market Estimates & Forecast, by Application, 2020β2027
9.4.4. Market Estimates & Forecast, by Country, 2020β2027
9.4.5. China
9.4.5.1. Market Estimates & Forecast, by Category, 2020β2027
9.4.5.2. Market Estimates & Forecast, by Type, 2020β2027
9.4.5.3. Market Estimates & Forecast, by Application, 2020β2027
9.4.6. Japan
9.4.6.1. Market Estimates & Forecast, by Category, 2020β2027
9.4.6.2. Market Estimates & Forecast, by Type, 2020β2027
9.4.6.3. Market Estimates & Forecast, by Application, 2020β2027
9.4.7. India
9.4.7.1. Market Estimates & Forecast, by Category, 2020β2027
9.4.7.2. Market Estimates & Forecast, by Type, 2020β2027
9.4.7.3. Market Estimates & Forecast, by Application, 2020β2027
9.4.8. Australia & New Zealand
9.4.8.1. Market Estimates & Forecast, by Category, 2020β2027
9.4.8.2. Market Estimates & Forecast, by Type, 2020β2027
9.4.8.3. Market Estimates & Forecast, by Application, 2020β2027
9.4.9. Rest of Asia-Pacific
9.4.9.1. Market Estimates & Forecast, by Category, 2020β2027
9.4.9.2. Market Estimates & Forecast, by Type, 2020β2027
9.4.9.3. Market Estimates & Forecast, by Application, 2020β2027
9.5. Rest of the World
9.5.1. Market Estimates & Forecast, by Category, 2020β2027
9.5.2. Market Estimates & Forecast, by Type, 2020β2027
9.5.3. Market Estimates & Forecast, by Application, 2020β2027
9.5.4. Market Estimates & Forecast, by Region, 2020β2027
9.5.5. South America
9.5.5.1. Market Estimates & Forecast, by Category, 2020β2027
9.5.5.2. Market Estimates & Forecast, by Type, 2020β2027
9.5.5.3. Market Estimates & Forecast, by Application, 2020β2027
9.5.6. Middle East
9.5.6.1. Market Estimates & Forecast, by Category, 2020β2027
9.5.6.2. Market Estimates & Forecast, by Type, 2020β2027
9.5.6.3. Market Estimates & Forecast, by Application, 2020β2027
9.5.7. Africa
9.5.7.1. Market Estimates & Forecast, by Category, 2020β2027
9.5.7.2. Market Estimates & Forecast, by Type, 2020β2027
9.5.7.3. Market Estimates & Forecast, by Application, 2020β2027
10. COMPETITIVE LANDSCAPE
10.1. Introduction
10.2. Competitive Benchmarking
10.3. Development Share Analysis
10.4. Key Developments & Growth Strategies
11. COMPANY PROFILES
11.1. Roquette Freres SA
11.1.1. Company Overview
11.1.2. Financial Overview
11.1.3. Products Offered
11.1.4. Key Developments
11.1.5. SWOT Analysis
11.1.6. Key Strategies
11.2. Cargill Inc.
11.2.1. Company Overview
11.2.2. Financial Overview
11.2.3. Products Offered
11.2.4. Key Developments
11.2.5. SWOT Analysis
11.2.6. Key Strategies
11.3. I. du Pont de Nemours and Company
11.3.1. Company Overview
11.3.2. Financial Overview
11.3.3. Products Offered
11.3.4. Key Developments
11.3.5. SWOT Analysis
11.3.6. Key Strategies
11.4. MITSUI & CO., LTD.
11.4.1. Company Overview
11.4.2. Financial Overview
11.4.3. Products Offered
11.4.4. Key Developments
11.4.5. SWOT Analysis
11.4.6. Key Strategies
11.5. Matsutani Chemical Industry Co., Ltd.
11.5.1. Company Overview
11.5.2. Financial Overview
11.5.3. Products Offered
11.5.4. Key Developments
11.5.5. SWOT Analysis
11.5.6. Key Strategies
11.6. Tate & Lyle
11.6.1. Company Overview
11.6.2. Financial Overview
11.6.3. Products Offered
11.6.4. Key Developments
11.6.5. SWOT Analysis
11.6.6. Key Strategies
11.7. Ingredion Inc.
11.7.1. Company Overview
11.7.2. Financial Overview
11.7.3. Products Offered
11.7.4. Key Developments
11.7.5. SWOT Analysis
11.7.6. Key Strategies
11.8. NutraSweet Company
11.8.1. Company Overview
11.8.2. Financial Overview
11.8.3. Products Offered
11.8.4. Key Developments
11.8.5. SWOT Analysis
11.8.6. Key Strategies
11.9. SΓΌdzucker AG
11.9.1. Company Overview
11.9.2. Financial Overview
11.9.3. Products Offered
11.9.4. Key Developments
11.9.5. SWOT Analysis
11.9.6. Key Strategies
11.10. Purecircle
11.10.1. Company Overview
11.10.2. Financial Overview
11.10.3. Products Offered
11.10.4. Key Developments
11.10.5. SWOT Analysis
11.10.6. Key Strategies
11.11. ZuChem Inc.
11.11.1. Company Overview
11.11.2. Financial Overview
11.11.3. Products Offered
11.11.4. Key Developments
11.11.5. SWOT Analysis
11.11.6. Key Strategies
11.12. Food Chem International Corporation
11.12.1. Company Overview
11.12.2. Financial Overview
11.12.3. Products Offered
11.12.4. Key Developments
11.12.5. SWOT Analysis
11.12.6. Key Strategies
11.13. Gulshan Polyols Limited
11.13.1. Company Overview
11.13.2. Financial Overview
11.13.3. Products Offered
11.13.4. Key Developments
11.13.5. SWOT Analysis
11.13.6. Key Strategies
11.14. JK Sucralose Inc.
11.14.1. Company Overview
11.14.2. Financial Overview
11.14.3. Products Offered
11.14.4. Key Developments
11.14.5. SWOT Analysis
11.14.6. Key Strategies
11.15. EcogreenOleochemical
11.15.1. Company Overview
11.15.2. Financial Overview
11.15.3. Products Offered
11.15.4. Key Developments
11.15.5. SWOT Analysis
11.15.6. Key Strategies
12. APPENDIX
12.1. General Sources & References
12.2. List of Abbreviation
β
LIST OF TABLES
Table 1 Global Low-Intensity Sweeteners Market, by Region, 2020β2027 (USD Million)
Table 2 Global Low-Intensity Sweeteners Market, by Category, 2020β2027 (USD Million)
Table 3 Global Low-Intensity Sweeteners Market, by Type, 2020β2027 (USD Million)
Table 4 Global Low-Intensity Sweeteners Market, by Application, 2020β2027 (USD Million)
Table 5 North America: Low-Intensity Sweeteners Market, by Country, 2020β2027 (USD Million)
Table 6 North America: Low-Intensity Sweeteners Market, by Category, 2020β2027 (USD Million)
Table 7 North America: Low-Intensity Sweeteners Market, by Type, 2020β2027 (USD Million)
Table 8 North America: Low-Intensity Sweeteners Market, by Application, 2020β2027 (USD Million)
Table 9 US: Low-Intensity Sweeteners Market, by Category, 2020β2027 (USD Million)
Table 10 US: Low-Intensity Sweeteners Market, by Type, 2020β2027 (USD Million)
Table 11 US: Low-Intensity Sweeteners Market, by Application, 2020β2027 (USD Million)
Table 12 Canada: Low-Intensity Sweeteners Market, by Category, 2020β2027 (USD Million)
Table 13 Canada: Low-Intensity Sweeteners Market, by Type, 2020β2027 (USD Million)
Table 14 Canada: Low-Intensity Sweeteners Market, by Application, 2020β2027 (USD Million)
Table 15 Mexico: Low-Intensity Sweeteners Market, by Category, 2020β2027 (USD Million)
Table 16 Mexico: Low-Intensity Sweeteners Market, by Type, 2020β2027 (USD Million)
Table 17 Mexico: Low-Intensity Sweeteners Market, by Application, 2020β2027 (USD Million)
Table 18 Europe: Low-Intensity Sweeteners Market, by Country, 2020β2027 (USD Million)
Table 19 Europe: Low-Intensity Sweeteners Market, by Category, 2020β2027 (USD Million)
Table 20 Europe: Low-Intensity Sweeteners Market, by Type, 2020β2027 (USD Million)
Table 21 Europe: Low-Intensity Sweeteners Market, by Application, 2020β2027 (USD Million)
Table 22 Germany: Low-Intensity Sweeteners Market, by Category, 2020β2027 (USD Million)
Table 23 Germany: Low-Intensity Sweeteners Market, by Type, 2020β2027 (USD Million)
Table 24 Germany: Low-Intensity Sweeteners Market, by Application, 2020β2027 (USD Million)
Table 25 France: Low-Intensity Sweeteners Market, by Category, 2020β2027 (USD Million)
Table 26 France: Low-Intensity Sweeteners Market, by Type, 2020β2027 (USD Million)
Table 27 France: Low-Intensity Sweeteners Market, by Application, 2020β2027 (USD Million)
Table 28 Italy: Low-Intensity Sweeteners Market, by Category, 2020β2027 (USD Million)
Table 29 Italy: Low-Intensity Sweeteners Market, by Type, 2020β2027 (USD Million)
Table 30 Italy: Low-Intensity Sweeteners Market, by Application, 2020β2027 (USD Million)
Table 31 Spain: Low-Intensity Sweeteners Market, by Category, 2020β2027 (USD Million)
Table 32 Spain: Low-Intensity Sweeteners Market, by Type, 2020β2027 (USD Million)
Table 33 Spain: Low-Intensity Sweeteners Market, by Application, 2020β2027 (USD Million)
Table 34 UK: Low-Intensity Sweeteners Market, by Category, 2020β2027 (USD Million)
Table 35 UK: Low-Intensity Sweeteners Market, by Type, 2020β2027 (USD Million)
Table 36 UK: Low-Intensity Sweeteners Market, by Application, 2020β2027 (USD Million)
Table 37 Rest of Europe: Low-Intensity Sweeteners Market, by Category, 2020β2027 (USD Million)
Table 38 Rest of Europe: Low-Intensity Sweeteners Market, by Type, 2020β2027 (USD Million)
Table 39 Rest of Europe: Low-Intensity Sweeteners Market, by Application, 2020β2027 (USD Million)
Table 40 Asia-Pacific: Low-Intensity Sweeteners Market, by Country, 2020β2027 (USD Million)
Table 41 Asia-Pacific: Low-Intensity Sweeteners Market, by Category, 2020β2027 (USD Million)
Table 42 Asia-Pacific: Low-Intensity Sweeteners Market, by Type, 2020β2027 (USD Million)
Table 43 Asia-Pacific: Low-Intensity Sweeteners Market, by Application, 2020β2027 (USD Million)
Table 44 China: Low-Intensity Sweeteners Market, by Category, 2020β2027 (USD Million)
Table 45 China: Low-Intensity Sweeteners Market, by Type, 2020β2027 (USD Million)
Table 46 China: Low-Intensity Sweeteners Market, by Application, 2020β2027 (USD Million)
Table 47 India: Low-Intensity Sweeteners Market, by Category, 2020β2027 (USD Million)
Table 48 India: Low-Intensity Sweeteners Market, by Type, 2020β2027 (USD Million)
Table 49 India: Low-Intensity Sweeteners Market, by Application, 2020β2027 (USD Million)
Table 50 Japan: Low-Intensity Sweeteners Market, by Category, 2020β2027 (USD Million)
Table 51 Japan: Low-Intensity Sweeteners Market, by Type, 2020β2027 (USD Million)
Table 52 Japan: Low-Intensity Sweeteners Market, by Application, 2020β2027 (USD Million)
Table 53 Australia & New Zealand: Low-Intensity Sweeteners Market, by Category, 2020β2027 (USD Million)
Table 54 Australia & New Zealand: Low-Intensity Sweeteners Market, by Type, 2020β2027 (USD Million)
Table 55 Australia & New Zealand: Low-Intensity Sweeteners Market, by Application, 2020β2027 (USD Million)
Table 56 Rest of Asia-Pacific: Low-Intensity Sweeteners Market, by Category, 2020β2027 (USD Million)
Table 57 Rest of Asia-Pacific: Low-Intensity Sweeteners Market, by Type, 2020β2027 (USD Million)
Table 58 Rest of Asia-Pacific: Low-Intensity Sweeteners Market, by Application, 2020β2027 (USD Million)
Table 59 Rest of the World (RoW): Low-Intensity Sweeteners Market, by Country, 2020β2027 (USD Million)
Table 60 Rest of the World (RoW): Low-Intensity Sweeteners Market, by Category, 2020β2027 (USD Million)
Table 61 Rest of the World (RoW): Low-Intensity Sweeteners Market, by Type, 2020β2027 (USD Million)
Table 62 Rest of the World (RoW): Low-Intensity Sweeteners Market, by Application, 2020β2027 (USD Million)
Table 63 South America: Low-Intensity Sweeteners Market, by Category, 2020β2027 (USD Million)
Table 64 South America: Low-Intensity Sweeteners Market, by Type, 2020β2027 (USD Million)
Table 65 South America: Low-Intensity Sweeteners Market, by Application, 2020β2027 (USD Million)
Table 66 Middle East: Low-Intensity Sweeteners Market, by Category, 2020β2027 (USD Million)
Table 67 Middle East: Low-Intensity Sweeteners Market, by Type, 2020β2027 (USD Million)
Table 68 Middle East: Low-Intensity Sweeteners Market, by Application, 2020β2027 (USD Million)
Table 69 Africa: Low-Intensity Sweeteners Market, by Category, 2020β2027 (USD Million)
Table 70 Africa: Low-Intensity Sweeteners Market, by Type, 2020β2027 (USD Million)
Table 71 Africa: Low-Intensity Sweeteners Market, by Application, 2020β2027 (USD Million)
β
LIST OF FIGURES
FIGURE 1 Global Low-Intensity Sweeteners Market Segmentation
FIGURE 2 Forecast Research Methodology
FIGURE 3 Five Forces Analysis of the Global Low-Intensity Sweeteners Market
FIGURE 4 Value Chain of the Global Low-Intensity Sweeteners Market
FIGURE 5 Share of the Global Low-Intensity Sweeteners Market in 2020, by Country (%)
FIGURE 6 Global Low-Intensity Sweeteners Market, by Region, 2020β2027,
FIGURE 7 Global Low-Intensity Sweeteners Market Size, by Category, 2020
FIGURE 8 Share of the Global Low-Intensity Sweeteners Market, by Category, 2020β2027 (%)
FIGURE 9 Global Low-Intensity Sweeteners Market Size, by Type, 2020
FIGURE 10 Share of the Global Low-Intensity Sweeteners Market, by Type, 2020β2027 (%)
FIGURE 11 Global Low-Intensity Sweeteners Market Size, by Application, 2020
FIGURE 12 Share of the Global Low-Intensity Sweeteners Market, by Application, 2020β2027 (%)
$3.45 billion
7.40%
North America
2020-2027
Market Scenario
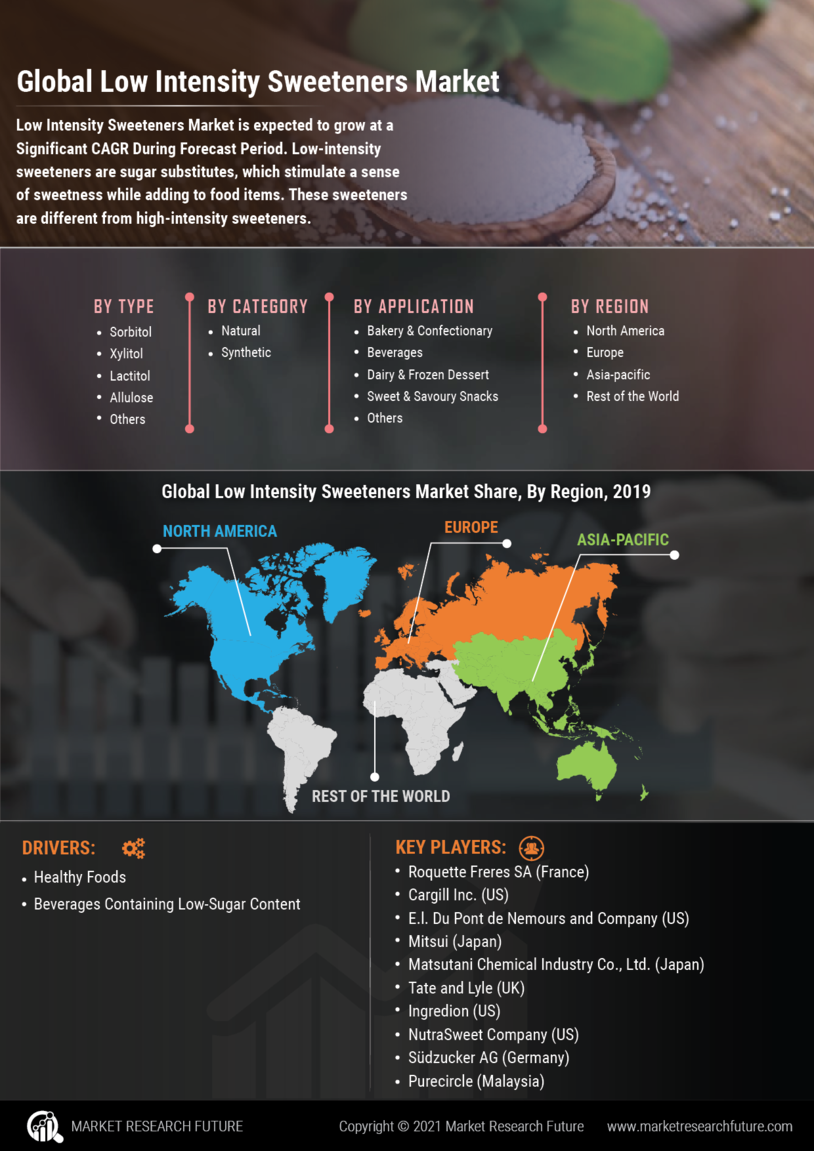
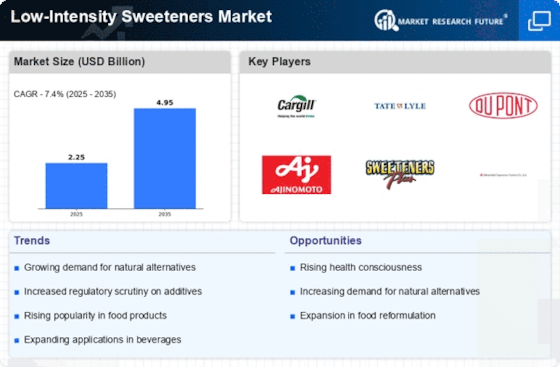
The Global Low Intensity Sweeteners Market is projected to grow at a significant rate of 5.45% from 2019 to 2024 to reach a market value of USD 1.85 billion by the end of 2024. There is a growing demand for healthy food products and beverages containing low-sugar content, among the consumers globally, which is expected to anticipate a significant growth of low-intensity sweeteners market during the assessment period. Low-intensity sweeteners are extracted from both natural and synthetic sources, but sweeteners from natural sources are more preferable by most of the consumers. Looking into the market scenario and consumer demand food processing industries are offering processed food items with various low-intensity sweeteners. These factors are likely to accelerate the growth of low-intensity sweeteners market during the assessment period.
Segmentation
The global low intensity sweeteners market has been segmented based on category, type, application, and region.
The global low intensity sweeteners market has been divided, based on category, into natural and synthetic.
By type global intensity sweeteners market has been segmented into sorbitol, xylitol, lactitol, allulose, and others.
The global low intensity sweeteners market has been classified, based on application into bakery & confectionery, beverages, dairy & frozen dessert, sweet & savory snacks, and others.
The global low intensity sweeteners market has been analyzed for four key regions—North America, Europe, Asia-Pacific, and the rest of the world.
The North American intensity sweeteners market has further been segmented into the US, Canada, and Mexico. The European low intensity sweeteners market has been classified as the UK, Germany, France, Italy, Spain, and the rest of Europe. The low-intensity sweeteners market in Asia-Pacific has been segmented into China, India, Japan, Australia & New Zealand, and the rest of Asia-Pacific. The low intensity sweeteners market in the rest of the world has been segmented into South America, the Middle East, and Africa.
Key Players
Regional Market Summary
Global Low-Intensity Sweeteners Market Share (%), by Region, 2018
Source: Secondary Sources and MRFR Analysis
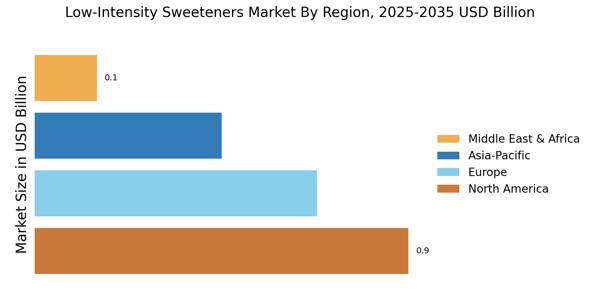
Globally, North America is projected to dominate the low-intensity sweeteners market during the forecast period. There is an increasing number of obese and diabetic people in North America. The consumers in the region are more interested in food items which contain low calorie and fewer sweeteners. These factors are influencing the market growth of low-intensity sweeteners in the region. The changing dietary habits of consumers in the region is creating huge demand for low-intensity sweeteners and likely to boost the market for low-intensity sweeteners during the forecast period.
Asia-Pacific is expected to register the highest CAGR in the low-intensity sweeteners market during the forecast period. The number of health-conscious consumers is increasing in the region, who prefer to include low-intensity sugars or sweeteners in their diet rather than regular sugars. As per the consumer's interest, most of the food processing industries are also using low-intensity sweeteners in their products to fulfill their requirements in the region. And there is wide application of low-intensity sweeteners in baked products and confectionery items as well as in beverage making. These factors are expected to catalyze the growth of the market for low-intensity sweeteners during the assessment period.
Global Low-Intensity Sweeteners Market, by Category
Global Low-Intensity Sweeteners Market, by Type
Global Low-Intensity Sweeteners Market, by Application
Global Low-Intensity Sweeteners Market, by Region
Intended Audience
Frequently Asked Questions (FAQ) :
Low intensity sweeteners market is expected to touch a value of USD 1.85 billion by 2024.
Low intensity sweeteners market can showcase a CAGR of 5.45% from 2019 to 2024.
Low intensity sweeteners market is driven by increasing consumption of healthy foods.
North America can dominate in the global low intensity sweeteners market till 2024 due to consumption of low calorie foods.
NutraSweet Company, EcogreenOleochemicals, Tate and Lyle, Cargill Inc., Purecircle, Ingredion, SΓΌdzucker AG, Roquette Freres SA, ZuChem Inc., Gulshan Polyols Limited, Food Chem International Corporation, Matsutani Chemical Industry Co., Ltd., E.l. Du Pont de Nemours and Company, Mitsui, and JK Sucralose Inc. are notable players of the global low intensity sweeteners market.