


Low Intensity Sweeteners Size
Market Size Snapshot
| Year | Value |
|---|---|
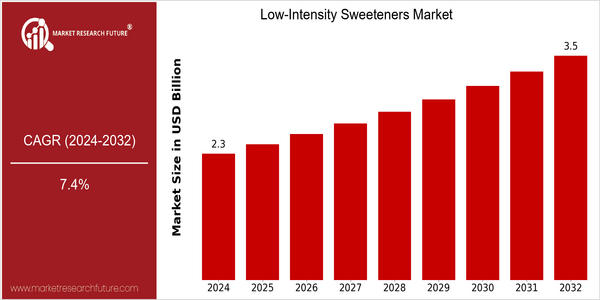
| 2024 | USD 2.2554 Billion |
| 2032 | USD 3.46137 Billion |
| CAGR (2024-2032) | 7.4 % |
Note – Market size depicts the revenue generated over the financial year
The market for low-intensity sweeteners is growing at a rapid pace, with the current market expected to reach $2.25 billion by 2024 and $3.46 billion by 2032. This equates to a CAGR of 7.4 per cent. The demand for healthier food and drink is increasing, as is the awareness of the harmful effects of sugar. Sweeteners with low calorific value are therefore finding increasing favour in a variety of applications, such as soft drinks, dairy products and baked goods. In addition, technological progress in the formulation and manufacture of sweeteners is driving growth. Extraction processes are being refined, and new sweeteners are being developed. The major players in the market, such as Tate & Lyle, Cargill and DuPont, are investing heavily in research and development in order to improve the performance of their sweeteners and expand their product ranges. Strategic initiatives, such as the establishment of joint ventures and the forming of strategic alliances, are also enabling these companies to exploit their strengths and capture a larger share of the market. The growing demand for low-intensity sweeteners is a result of both technological innovation and the desire to eat a healthier diet.
Regional Market Size
Regional Deep Dive
The low-calorie sweeteners market is growing rapidly in various regions, mainly driven by the rising awareness of health among consumers and the growing demand for low-calorie, natural and low-carbohydrate alternatives. North America is characterized by a strong demand for sugar substitutes in food and beverage applications, while Europe is characterized by a growing trend towards clean label products. Asia-Pacific is characterized by a rapid urbanization and changing eating habits, which has led to a strong growth in the use of low-calorie sweeteners. Middle East and Africa are experiencing a slow but steady acceptance of low-calorie sweeteners, mainly influenced by the growing health consciousness and the support of the government. Latin America, with its diverse culinary traditions, is also looking to integrate low-calorie sweeteners into its local products, which also reflects the global trend towards a healthier diet.
Europe
- The European Food Safety Authority (EFSA) has implemented stricter regulations on the labeling of sweeteners, pushing manufacturers to be more transparent about their ingredients, which is reshaping consumer trust and product formulation.
- There is a notable trend towards plant-based sweeteners, with companies like Stevia First Corporation leading the charge in developing stevia-derived products that appeal to health-conscious consumers.
Asia Pacific
- The rise of health issues such as diabetes and obesity in countries like India and China is driving the demand for low-intensity sweeteners, prompting local manufacturers to innovate and adapt their product offerings.
- Government initiatives promoting healthier food options, such as the 'Eat Right India' movement, are encouraging food producers to incorporate low-calorie sweeteners into their products.
Latin America
- Brazil is witnessing a surge in the use of low-intensity sweeteners in traditional beverages, such as mate and tereré, as consumers seek healthier alternatives without sacrificing taste.
- The region's diverse agricultural landscape is fostering the development of local sweetener sources, with companies like PureCircle investing in stevia cultivation to meet rising demand.
North America
- The FDA has recently approved several new low-intensity sweeteners, including allulose, which is gaining popularity among manufacturers for its low-calorie content and minimal impact on blood sugar levels.
- Major companies like Tate & Lyle and Cargill are investing in research and development to create innovative sweetener blends that cater to the growing demand for natural and organic products.
Middle East And Africa
- In the UAE, the government has launched campaigns to reduce sugar consumption, which has led to increased interest in low-intensity sweeteners among food manufacturers and consumers alike.
- Local companies are beginning to explore the use of natural sweeteners like monk fruit and stevia, influenced by cultural preferences for natural ingredients.
Did You Know?
“Did you know that the global market for low-intensity sweeteners is expected to see a significant shift towards natural sources, with stevia and monk fruit projected to dominate the market by 2025?” — Market Research Future
Segmental Market Size
During the last few years the market for low-intensity sweeteners has been growing steadily, driven by increasing demand for healthier alternatives to sugar. A number of factors have contributed to the growth of this market, including the growing health consciousness of consumers, the regulatory support for low-calorie products and technological developments that have improved the taste without compromising health benefits. Companies such as Stevia First and PureCircle have been at the forefront of this development, focusing on the health-conscious consumer. The current use of low-intensity sweeteners is now at a very advanced stage. They are used in a wide range of food and beverage products, especially soft drinks, dairy products and bakery products. Some well-known examples are the use of stevia in Coca-Cola soft drinks and the use of low-calorie sweeteners in Nestlé products. Combined with the worldwide trend towards reduced sugar consumption and the sustainable development of the food industry, the market is growing rapidly, as consumers are looking for products that are in line with their health and environmental values. This is also a growth area for fermentation and enzymatic technology, which can develop new sweeteners.
Future Outlook
From 2024 to 2032, the market for low-intensity sweeteners will increase from $ 2,267,000 to $ 3,461,000, at a robust CAGR of 7.4 percent. This growth is driven by the rising demand for healthier food and beverage products and the increasing awareness of the dangers of high sugar consumption. As consumers seek to reduce their calorie intake without compromising on sweetness, low-intensity sweeteners will enter the mass market, and they will eventually occupy about 30 percent of the total sweetener market in 2032, up from 20 percent in 2024. Also, the development of new extraction methods and the development of new sweeteners will increase the number of products and the scope of use in various industries, such as food, beverage and pharmaceuticals. In addition, supportive regulations and health initiatives to combat obesity and diabetes will also help the market to grow. Also, the increasing popularity of plant-based and natural sweeteners will lead to new developments in the market, increasing competition and innovation. The low-intensity sweetener market will grow rapidly, driven by a combination of technological development, increasing consumer awareness and supportive regulations.


Leave a Comment