Global Cassava Market Overview
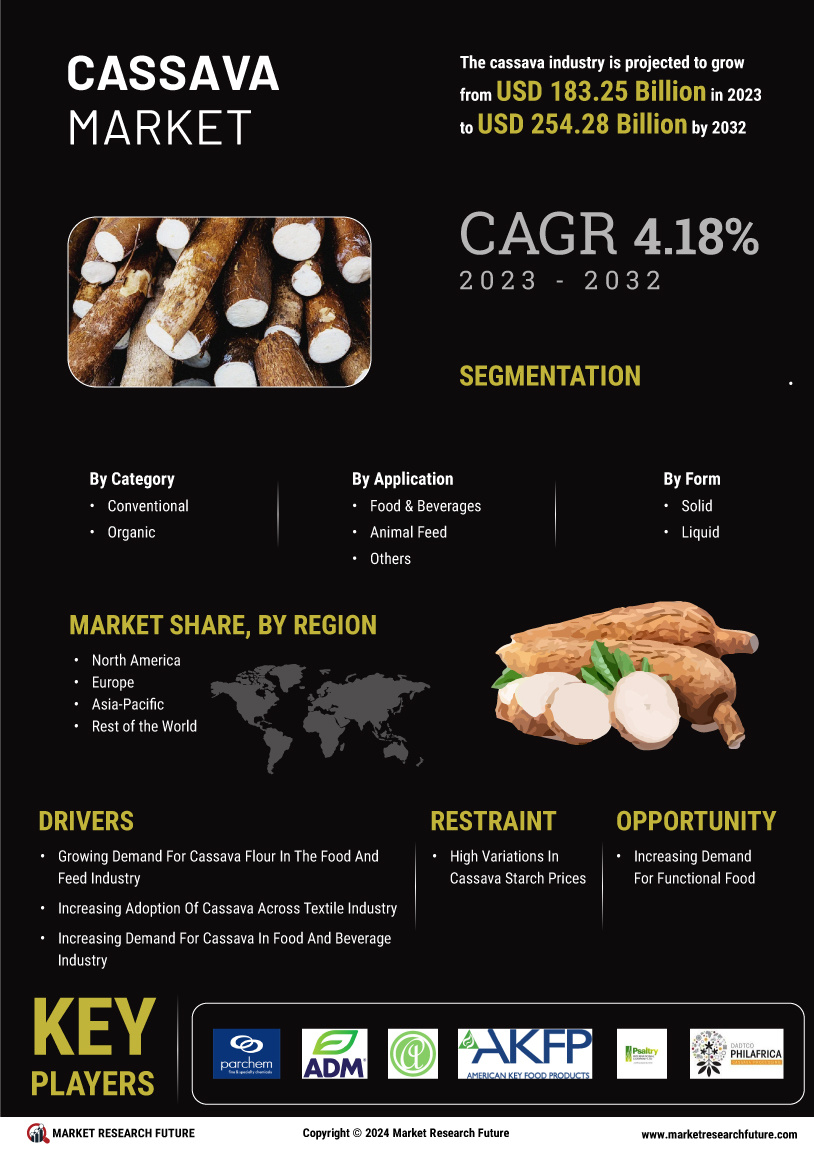
The cassava market size was valued at USD 175.9 Billion in 2022. The cassava industry is projected to grow from USD 183.25 Billion in 2024 to USD 254.28 Billion by 2032, exhibiting a compound annual growth rate (CAGR) of 4.18% during the forecast period (2024 - 2032). Increasing demand for cassava starch in the food and beverage industry, surging usage of cassava for the production of sweeteners, and high usage of cassava in snacks and cereals are the key market drivers enhancing the market growth.
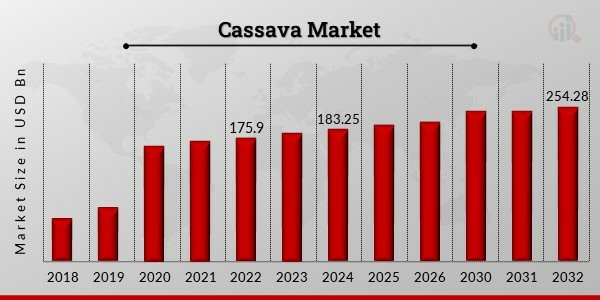
Source: Secondary Research, Primary Research, MRFR Database and Analyst Review
Cassava Market Trends
- The rising consumption of functional foods is driving market growth
The market CAGR for cassava is driven by the rising consumption of functional foods. Consumers are becoming more aware and health-conscious globally, which is driving its demand to promote better health, improved longevity, and prevent the onset of chronic diseases. Foods fortified with nutritional and disease-eluding properties are stimulating the world's nutritional food sector. The changing consumer food eating patterns and their evolving taste preference has necessitated the manufacturers to introduce and innovate new functional food and beverages in the market.
Additionally, growing demand for manioc starch in various cereals and snacks. Manioc starch is one of the vital ingredients added to food products by manufacturers. Dairy, bakery, and snack products are one of the prominent categories that use manioc starch. Among which the prominent food products consumed by people are snacks and cereals. In order to expand the quality of the food product, manufacturers are incorporating the utilization of manioc starch in it. Starch assists in attaining the desired viscosity in snack products compared to the other starch products. It is a natural binding agent and a texturizer in food products. The viscosity, high water-holding, and binding effects make it more convenient for the manufacturing of snack products. Since the market for extruded snacks, ready-to-eat cereals, and pretzels is growing, the demand for manioc starch is also expected to grow. Freeze-thaw stability measures the total effect of temperature changes on an emulsion.
Moreover, growth in the consumption of functional foods escalates the demand for cassava. Functional foods contain the perfect nutritional balance of health-beneficial properties. Consumers are opting for functional foods to maintain a healthy lifestyle. Functional foods are believed to positively impact health and reduce the risk of certain diseases. Cassava starch contains a sufficient amount of dietary fiber and even has a low glycemic index. A large percentage of the population is suffering from health issues such as obesity and high blood sugar, due to which consumers are adopting functional foods. High fat and sugar consumption are responsible for obesity and related health problems. As cassava starch contains high fiber content, consumers prefer it, thus, driving the growth of the cassava market revenue.
The surging usage of cassava for sweeteners drives the market growth over the forecast period. Sweetener produced from cassava starch is anticipated to have the most substantial market share owing to their high usage as a natural sweetener in food and beverage products. Consumer demand for raw food and clean-label ingredients has increased the need for sweeteners in numerous food and beverage industries, such as bakeries, convenience meals, health drinks, and fizzy drinks. The benefits of natural sweeteners, such as a rich source of energy, low calorie, sugar-free intake, and others, are becoming more well-known among consumers.
Cassava Market Segment Insights
Cassava Category Insights
The cassava market segmentation, based on category, includes conventional and organic. The organic segment dominated the market, accounting for 35% of market revenue (64.14 Billion). In developing economies, category growth is driven by rising demand and consumption of gluten-free bakery goods among consumers suffering from celiac disease, caused primarily by gluten intake. However, conventional is the fastest-growing category due to growing consumer demand for raw food for sweeteners in numerous food and beverage industries.
Cassava Application Insights
The cassava market segmentation, based on application, includes food & beverages, animal feed, and others. The food & beverages category generated the most income (70.4%) owing to the explanation of the busy lifestyle. The growing consumer awareness and rising concerns over their health are the major factors driving the demand for healthy additives & ingredients in food and beverage products. However, animal feed is the fastest-growing category due to the growing demand for cassava among animals.
Cassava Form Insights
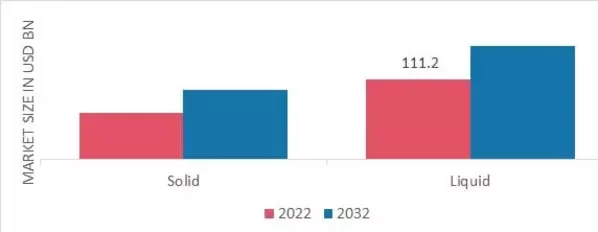
The cassava market segmentation, based on form, includes solid and liquid. The liquid category generated the most income owing to the continuously increasing demand for cassava liquid across continuously expanding applications across the beverage industry. However, solid is the fastest-growing category due to the wide use of powdered cassava in bakery & confectionery, functional food products, and nutritional food.
Figure 1: Cassava Market, by Form, 2022 & 2032 (USD Billion)
Source: Secondary Research, Primary Research, MRFR Database and Analyst Review
Cassava Regional Insights
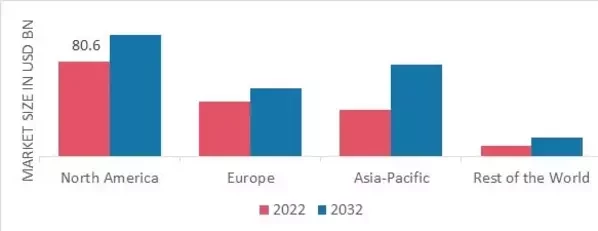
By region, the study provides market insights into North America, Europe, Asia-Pacific and the Rest of the World. The North American cassava market will dominate owing to an immense potential for the utility and consumption of cassava starch in several applications, such as functional food, dietary supplements, nutritional drinks, medicinal applications, and others. The improving economic conditions of several countries with increasing awareness of healthy diets among consumers have positively influenced their buying behavior in this region. Further, the US cassava market held the largest market share, and the Canadian cassava market was the fastest-growing market in the European region.
Further, the major countries studied in the market report are the US, Canada, German, France, the UK, Italy, Spain, China, Japan, India, Australia, South Korea, and Brazil.
Figure 2: CASSAVA MARKET SHARE BY REGION 2022 (USD Billion)
Source: Secondary Research, Primary Research, MRFR Database and Analyst Review
Europe's cassava market accounts for the second-largest market share due to the expansion of this region's food and beverage sector. Further, the German cassava market held the largest market share, and the UK cassava market was the fastest-growing market in the European region.
The Asia-Pacific cassava Market is expected to grow at the fastest CAGR from 2023 to 2032. This is due to the growing demand for cassava starch across various end-use sectors. These sectors include food and beverage, personal care and cosmetics, and medicine formulation, among others. Moreover, China’s cassava market held the largest market share, and the Indian cassava market was the fastest-growing market in the Asia-Pacific region.
Cassava Key Market Players & Competitive Insights
Leading market players are investing heavily in research and development to expand their product lines, which will help the cassava market grow even more. Market participants are also undertaking various strategic activities to expand their footprint, with important market developments including new product launches, contractual agreements, mergers and acquisitions, higher investments, and collaboration with other organizations. To expand and survive in a more competitive and rising market climate, the cassava industry must offer cost-effective items.
Manufacturing locally to minimize operational costs is one of the key business tactics manufacturers use in the cassava industry to benefit clients and increase the market sector. Major players in the cassava market, including Archer Daniels Midland Company (US), Agrideco Vietnam Co., Ltd. (Vietnam), American Key Food Products Inc. (US), Psaltry International Limited (Nigeria), and others, are attempting to increase market demand by investing in research and development operations.
Cargill Inc (Cargill) is an agribusiness company providing products and services in the food, financial products, agricultural, industrial and risk management fields. It carries out the marketing, processing, and distribution of grains, oilseeds, sugar, meat, other food products, and cotton. It also manufactures natural ingredients for the personal care industry, pet food, animal feed and bio-industrial products. The company provides technical support, data asset solutions, transportation and logistics, risk management, and marketing services. In addition, the company produces and distributes starch and starch sweeteners, fuel ethanol and biodiesel. Cargill markets its feed and pet food products under several brands, including Nutrena, Provimi, Cargill, EWOS, Diamond V and Purina. In February 2019, Cargill, Incorporated invested US$ 22.5 Mn in its starch production plant in the Netherlands. This investment was done for the expansion of its instant starch capacity. This will also support the increased customer demand for convenience food.
Lemonilo Indonesia Sehat provides packaged food products. The Company offers various healthy products, such as instant noodles, snacks, and other essential ingredients. Lemonilo Indonesia Sehat serves customers in Indonesia. In April 2023, Lemonilo launched Cassamo healthy cassava chips in Indonesia. Cassamo comprises two flavors Smoky BBQ and Spicy BBQ. The new cassava chips are high in fiber and are free from preservatives and flavor enhancers.
Key Companies in the Cassava market include
- Parchem fine & specialty chemicals (US)
- Archer Daniels Midland Company. (US)
- Agrideco Vietnam Co., Ltd. (Vietnam)
- American Key Food Products Inc. (US)
- Psaltry International Limited (Nigeria)
- Dadtco Philafrica B.V. (Netherlands)
- Roquette Frères (France)
- Woodland Foods (US)
- Mhogo Foods Ltd. (Kenya)
- Otto's Naturals (New Jersey)
- Venus Starch Suppliers (India)
- Grain Millers, Inc. (US)
Cassava Industry Developments
In 2023: Roquette Frères, known for its innovation in starches and bio-ingredients, might have launched new cassava-based products and it have announced advancements in sustainable cassava processing methods or introduced eco-friendly cassava derivatives.
July 2019: Ingredion Incorporated launched its tapioca-based clean-label starch, a dry powder, high-water mix. It is a co-texturizer in several food products, such as hot drinks, soups, and desserts. This product will complete the natural ingredient criteria in Ireland, the U.K., France, and the EU legislation. This will help the manufacturers to tap into the natural and lucrative clean-label trends.
Cassava Market Segmentation
Cassava Category Outlook
Cassava Application Outlook
- Food & Beverages
- Animal Feed
- Others
Cassava Form Outlook
Cassava Regional Outlook
- North America
- Europe
- Germany
- France
- UK
- Italy
- Spain
- Rest of Europe
- Asia-Pacific
- China
- Japan
- India
- Australia
- South Korea
- Australia
- Rest of Asia-Pacific
- Rest of the World
- Middle East
- Africa
- Latin America
| Report Attribute/Metric |
Details |
| Market Size 2022 |
USD 175.9 Billion |
| Market Size 2024 |
USD 183.25 Billion |
| Market Size 2032 |
USD 254.28 Billion |
| Compound Annual Growth Rate (CAGR) |
4.18% (2024-2032) |
| Base Year |
2022 |
| Market Forecast Period |
2024-2032 |
| Historical Data |
2018- 2022 |
| Market Forecast Units |
Value (USD Billion) |
| Report Coverage |
Revenue Forecast, Market Competitive Landscape, Growth Factors, and Trends |
| Segments Covered |
Category, Application, Form and Region |
| Geographies Covered |
North America, Europe, Asia Pacific, and the Rest of the World |
| Countries Covered |
The US, Canada, German, France, UK, Italy, Spain, China, Japan, India, Australia, South Korea, and Brazil |
| Key Companies Profiled |
Archer Daniels Midland Company (US), Agrideco Vietnam Co., Ltd. (Vietnam), American Key Food Products Inc. (US), Psaltry International Limited (Nigeria), Dadtco Philafrica B.V. (Netherlands), Roquette Frères (France), Woodland Foods (US), Mhogo Foods Ltd. (Kenya), and Otto's Naturals (New Jersey) |
| Key Market Opportunities |
Surging usage of cassava for the production of sweeteners |
| Key Market Dynamics |
Increasing demand for cassava starch food and beverage industry |
Cassava Market Highlights:
Frequently Asked Questions (FAQ) :
The cassava market size was valued at USD 175.9 Billion in 2022.
The market is projected to grow at a CAGR of 4.18% during the forecast period, 2024-2032.
North America had the largest share of the market.
The key players in the market are Archer Daniels Midland Company (US), Agrideco Vietnam Co., Ltd. (Vietnam), American Key Food Products Inc. (US), Psaltry International Limited (Nigeria), Dadtco Philafrica B.V. (Netherlands), Roquette Frères (France), Woodland Foods (US), Mhogo Foods Ltd. (Kenya), and Otto's Naturals (New Jersey)
The organic category dominated the market in 2022.
Food & beverages had the largest share of the market.
The liquid had the largest share in the market.