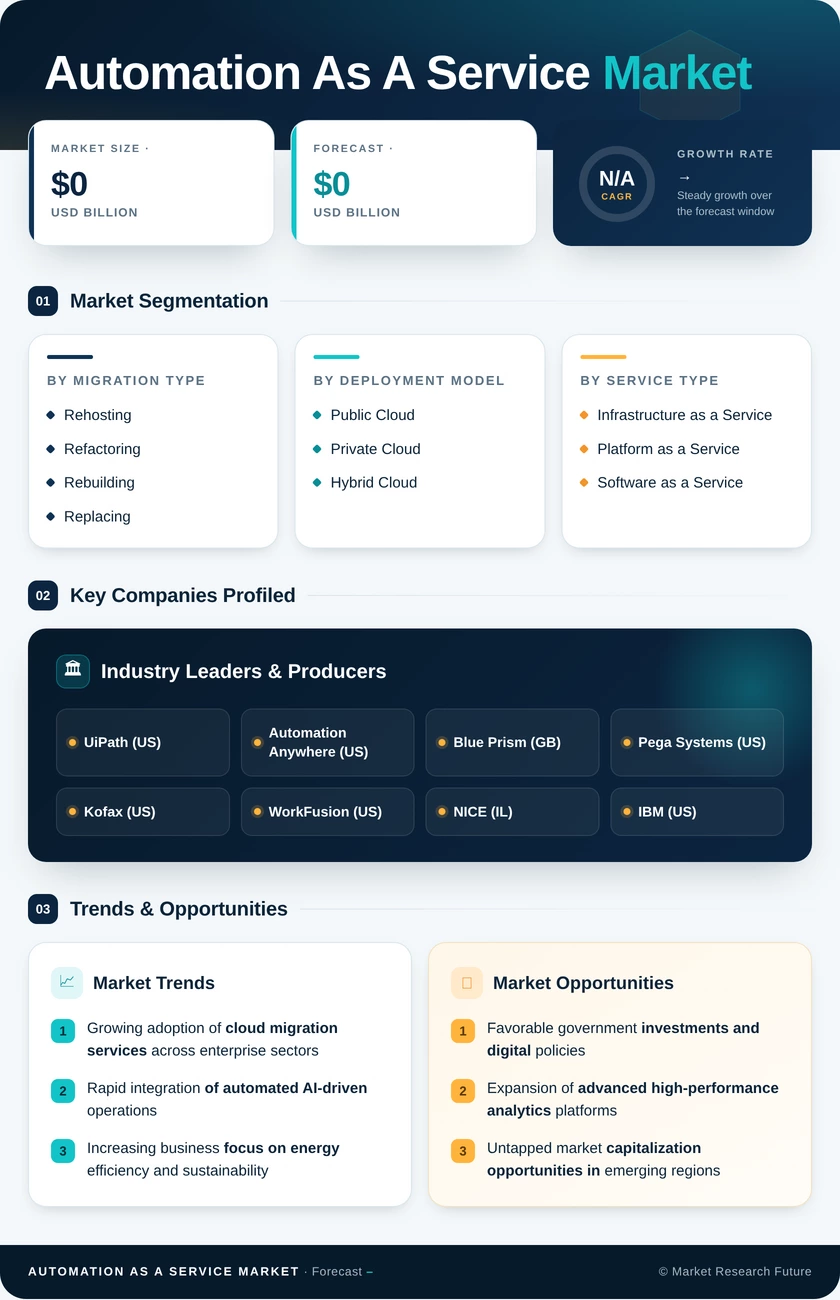
Automation as a Service Market (2026 – 2035)

ID: MRFR/ICT/4103-HCR 100 Pages Apoorva Priyadarshi Last Updated: September 15, 2026
Automation as a Service Market Size, Share and Research Report By Service Type (Professional Services, Managed Services), By Deployment Mode (Public Cloud, Private Cloud, Hybrid Cloud), By Organization Size (Small and Medium Enterprises, Large Enterprises), By Business Function (IT Operations, Finance, Human Resources, Sales and Marketing, Customer Support), By End User (BFSI, Healthcare, Manufacturing, Retail, IT and Telecommunications, Government, Others) and By Regional (North America, Europe, South America, Asia Pacific, Middle East and Africa) - Industry Forecast to 2035.
Automation as a Service Market
Market Size
Forecast Period2026-2035
CAGR (2026-2035)23.8%
Key Players
UiPath
Automation Anywhere
Microsoft
IBM
ServiceNow
Pegasystems
Opportunities
  • Autonomous Agent Ecosystems
  • Embedded Automation in Vertical SaaS
  • Emerging Market Expansion via Mobile-First Delivery
  1. 1 Market Overview |
    1. 1.1 Study Assumptions & Market Definition |
    2. 1.2 Scope of the Study |
    3. 1.3 Research Methodology
  2. 2 Market Summary & Key Takeaways
  3. 3 Market Dynamics |
    1. 3.1 Market Drivers Analysis | |
      1. 3.1.1 Generative AI Embedding in Automation Platforms | |
      2. 3.1.2 Cloud-Native Infrastructure Proliferation | |
      3. 3.1.3 Low-Code and No-Code Democratization | |
      4. 3.1.4 Process Mining and Orchestration Convergence | |
      5. 3.1.5 SME Adoption via Usage-Based Billing | |
      6. 3.1.6 Regulatory Compliance Automation Mandates | |
      7. 3.1.7 Domain-Specific Bot Marketplaces |
    2. 3.2 Market Restraints Analysis | |
      1. 3.2.1 Data Privacy and Sovereignty Constraints | |
      2. 3.2.2 Legacy System Integration Complexity | |
      3. 3.2.3 Skilled Talent Scarcity | |
      4. 3.2.4 Vendor Lock-In Concerns | |
      5. 3.2.5 Security Vulnerabilities in Bot Credentials |
    3. 3.3 Market Opportunity Analysis | |
      1. 3.3.1 Autonomous Agent Ecosystems | |
      2. 3.3.2 Embedded Automation in Vertical SaaS | |
      3. 3.3.3 Emerging Market Expansion via Mobile-First Delivery | |
      4. 3.3.4 Automation Data Monetization | |
      5. 3.3.5 Compliance-as-Code Automation |
    4. 3.4 Industry Value Chain Analysis |
    5. 3.5 Porter's Five Forces Analysis
  4. 4 Global Automation as a Service Market Size & Forecast (2021–2035) |
    1. 4.1 Historical Market Size (2021–2025) |
    2. 4.2 Current & Forecast Market Size (2026–2035) |
    3. 4.3 Market Size by Revenue (USD Billion) |
    4. 4.4 Year-over-Year Growth Analysis
  5. 5 Segmentation Analysis |
    1. 5.1 By Deployment Type | |
      1. 5.1.1 On-Premise | |
      2. 5.1.2 Cloud |
    2. 5.2 By Component | |
      1. 5.2.1 Solution | |
      2. 5.2.2 Services |
    3. 5.3 By Business Function | |
      1. 5.3.1 IT Operations | |
      2. 5.3.2 Finance & Accounting | |
      3. 5.3.3 Sales & Marketing | |
      4. 5.3.4 Other Business Functions |
    4. 5.4 By Enterprise Size | |
      1. 5.4.1 Large Enterprises | |
      2. 5.4.2 Small and Medium Enterprises (SMEs) |
    5. 5.5 By End-User Vertical | |
      1. 5.5.1 BFSI | |
      2. 5.5.2 Telecom & IT | |
      3. 5.5.3 Retail & Consumer Goods | |
      4. 5.5.4 Other Verticals
  6. 6 Regional Analysis |
    1. 6.1 North America | |
      1. 6.1.1 United States | |
      2. 6.1.2 Canada | |
      3. 6.1.3 Mexico |
    2. 6.2 Europe | |
      1. 6.2.1 Germany | |
      2. 6.2.2 United Kingdom | |
      3. 6.2.3 France | |
      4. 6.2.4 Italy | |
      5. 6.2.5 Spain | |
      6. 6.2.6 Nordic Countries | |
      7. 6.2.7 Russia | |
      8. 6.2.8 Rest of Europe |
    3. 6.3 Asia-Pacific | |
      1. 6.3.1 China | |
      2. 6.3.2 India | |
      3. 6.3.3 Japan | |
      4. 6.3.4 South Korea | |
      5. 6.3.5 ASEAN | |
      6. 6.3.6 Rest of Asia-Pacific |
    4. 6.4 South America | |
      1. 6.4.1 Brazil | |
      2. 6.4.2 Argentina | |
      3. 6.4.3 Rest of South America |
    5. 6.5 Middle East & Africa | |
      1. 6.5.1 Saudi Arabia | |
      2. 6.5.2 UAE | |
      3. 6.5.3 South Africa | |
      4. 6.5.4 Egypt | |
      5. 6.5.5 Rest of MEA
  7. 7 Competitive Landscape |
    1. 7.1 Market Share Analysis (2025) |
    2. 7.2 Competitive Benchmarking Matrix |
    3. 7.3 Company Profiles | |
      1. 7.3.1 UiPath | |
      2. 7.3.2 Automation Anywhere | |
      3. 7.3.3 Microsoft | |
      4. 7.3.4 IBM | |
      5. 7.3.5 ServiceNow | |
      6. 7.3.6 Pegasystems | |
      7. 7.3.7 Appian | |
      8. 7.3.8 SAP | |
      9. 7.3.9 Salesforce | |
      10. 7.3.10 Wipro
  8. 8 Future Outlook & Strategic Recommendations (2026–2035) |
    1. 8.1 AI-Native Autonomous Operations |
    2. 8.2 Platform Economics and Marketplace Models |
    3. 8.3 Sustainability and ESG Reporting Automation |
    4. 8.4 Sovereign Automation and Data Localization
  9. 9 Recent Developments & News
  10. 10 Frequently Asked Questions (FAQs)
  11. 11 Report Scope & Methodology |
    1. 11.1 Study Period & Base Year |
    2. 11.2 Data Sources & Citations |
    3. 11.3 Abbreviations
  12. 12 LIST OF TABLES |
  13. TABLE 1 Global Automation as a Service Market Size & Forecast, by Revenue (USD Billion), 2021–2035 |
  14. TABLE 2 Global Automation as a Service Market – Year-over-Year Growth Analysis, 2021–2035 |
  15. TABLE 3 Market Driver Impact Analysis, 2026–2035 |
  16. TABLE 4 Market Restraint Impact Analysis, 2026–2035 |
  17. TABLE 5 Global Automation as a Service Market Size, by Deployment Type, 2021–2035 (USD Billion) |
  18. TABLE 6 Global Automation as a Service Market Size, by Component, 2021–2035 (USD Billion) |
  19. TABLE 7 Global Automation as a Service Market Size, by Business Function, 2021–2035 (USD Billion) |
  20. TABLE 8 Global Automation as a Service Market Size, by Enterprise Size, 2021–2035 (USD Billion) |
  21. TABLE 9 Global Automation as a Service Market Size, by End-User Vertical, 2021–2035 (USD Billion) |
  22. TABLE 10 Global Automation as a Service Market Size, by Region, 2021–2035 (USD Billion) |
  23. TABLE 11 North America Automation as a Service Market Size, by Country, 2021–2035 (USD Billion) |
  24. TABLE 12 Europe Automation as a Service Market Size, by Country, 2021–2035 (USD Billion) |
  25. TABLE 13 Asia-Pacific Automation as a Service Market Size, by Country, 2021–2035 (USD Billion) |
  26. TABLE 14 South America Automation as a Service Market Size, by Country, 2021–2035 (USD Billion) |
  27. TABLE 15 Middle East & Africa Automation as a Service Market Size, by Country, 2021–2035 (USD Billion) |
  28. TABLE 16 Competitive Benchmarking Matrix – Global Automation as a Service Market, 2025 |
  29. TABLE 17 Company Profiles – Key Players, Global Automation as a Service Market |
  30. TABLE 18 Recent Developments & Strategic Announcements, 2023–2025 |
  31. TABLE 19 North America Automation as a Service Market Size, by Deployment Type, 2021–2035 (USD Billion) |
  32. TABLE 20 North America Automation as a Service Market Size, by Component, 2021–2035 (USD Billion) |
  33. TABLE 21 North America Automation as a Service Market Size, by Business Function, 2021–2035 (USD Billion) |
  34. TABLE 22 North America Automation as a Service Market Size, by Enterprise Size, 2021–2035 (USD Billion) |
  35. TABLE 23 North America Automation as a Service Market Size, by End-User Vertical, 2021–2035 (USD Billion) |
  36. TABLE 24 Europe Automation as a Service Market Size, by Deployment Type, 2021–2035 (USD Billion) |
  37. TABLE 25 Europe Automation as a Service Market Size, by Component, 2021–2035 (USD Billion) |
  38. TABLE 26 Europe Automation as a Service Market Size, by Business Function, 2021–2035 (USD Billion) |
  39. TABLE 27 Europe Automation as a Service Market Size, by Enterprise Size, 2021–2035 (USD Billion) |
  40. TABLE 28 Europe Automation as a Service Market Size, by End-User Vertical, 2021–2035 (USD Billion) |
  41. TABLE 29 Asia-Pacific Automation as a Service Market Size, by Deployment Type, 2021–2035 (USD Billion) |
  42. TABLE 30 Asia-Pacific Automation as a Service Market Size, by Component, 2021–2035 (USD Billion) |
  43. TABLE 31 Asia-Pacific Automation as a Service Market Size, by Business Function, 2021–2035 (USD Billion) |
  44. TABLE 32 Asia-Pacific Automation as a Service Market Size, by Enterprise Size, 2021–2035 (USD Billion) |
  45. TABLE 33 Asia-Pacific Automation as a Service Market Size, by End-User Vertical, 2021–2035 (USD Billion) |
  46. TABLE 34 South America Automation as a Service Market Size, by Deployment Type, 2021–2035 (USD Billion) |
  47. TABLE 35 South America Automation as a Service Market Size, by Component, 2021–2035 (USD Billion) |
  48. TABLE 36 South America Automation as a Service Market Size, by Business Function, 2021–2035 (USD Billion) |
  49. TABLE 37 South America Automation as a Service Market Size, by Enterprise Size, 2021–2035 (USD Billion) |
  50. TABLE 38 South America Automation as a Service Market Size, by End-User Vertical, 2021–2035 (USD Billion) |
  51. TABLE 39 Middle East & Africa Automation as a Service Market Size, by Deployment Type, 2021–2035 (USD Billion) |
  52. TABLE 40 Middle East & Africa Automation as a Service Market Size, by Component, 2021–2035 (USD Billion) |
  53. TABLE 41 Middle East & Africa Automation as a Service Market Size, by Business Function, 2021–2035 (USD Billion) |
  54. TABLE 42 Middle East & Africa Automation as a Service Market Size, by Enterprise Size, 2021–2035 (USD Billion) |
  55. TABLE 43 Middle East & Africa Automation as a Service Market Size, by End-User Vertical, 2021–2035 (USD Billion)
  56. 13 LIST OF FIGURES |
  57. FIGURE 1 Automation as a Service Market Dynamics – Drivers, Restraints, and Opportunities |
  58. FIGURE 2 Industry Value Chain Analysis – Automation as a Service Market |
  59. FIGURE 3 Porter's Five Forces Analysis – Automation as a Service Market |
  60. FIGURE 4 Global Automation as a Service Market Size Trend (USD Billion), 2021–2035 |
  61. FIGURE 5 Automation as a Service Market Share, by Deployment Type, 2025 (%) |
  62. FIGURE 6 Automation as a Service Market Share, by Component, 2025 (%) |
  63. FIGURE 7 Automation as a Service Market Share, by Business Function, 2025 (%) |
  64. FIGURE 8 Automation as a Service Market Share, by Enterprise Size, 2025 (%) |
  65. FIGURE 9 Automation as a Service Market Share, by End-User Vertical, 2025 (%) |
  66. FIGURE 10 Automation as a Service Market Share, by Region, 2025 (%) |
  67. FIGURE 11 North America Automation as a Service Market Size Trend, 2021–2035 (USD Billion) |
  68. FIGURE 12 Europe Automation as a Service Market Size Trend, 2021–2035 (USD Billion) |
  69. FIGURE 13 Asia-Pacific Automation as a Service Market Size Trend, 2021–2035 (USD Billion) |
  70. FIGURE 14 South America Automation as a Service Market Size Trend, 2021–2035 (USD Billion) |
  71. FIGURE 15 Middle East & Africa Automation as a Service Market Size Trend, 2021–2035 (USD Billion) |
  72. FIGURE 16 Competitive Landscape – Market Share Distribution, 2025

Segmentation Quick Reference

DimensionSub-SegmentsDominant SegmentFastest Growing Segment
Deployment TypeOn-Premise, CloudOn-Premise (72.1% share, 2025)Cloud (25.2% CAGR)
ComponentSolution, ServicesSolution (70.5% share, 2025)Services (25.1% CAGR)
Business FunctionIT Operations, Finance & Accounting, Sales & Marketing, OthersIT Operations (47.6% share, 2025)Sales & Marketing (24.5% CAGR)
Enterprise SizeLarge Enterprises, SMEsLarge Enterprises (75.8% share, 2025)SMEs (24.8% CAGR)
End-User VerticalBFSI, Telecom & IT, Retail & Consumer Goods, OthersTelecom & IT (24.1% share, 2025)BFSI (24.2% CAGR)
GeographyNorth America, Europe, Asia-Pacific, South America, MEANorth America (40.7% share, 2025)Asia-Pacific (24.3% CAGR)


Market Segmentation Overview

By Deployment Type

Sub-SegmentKey Trend
On-PremiseSustained demand from regulated industries prioritizing data control and legacy integration
CloudRapid adoption driven by SaaS delivery models, consumption-based pricing, and global scalability


On-premise solutions retain their revenue lead due to entrenched enterprise infrastructure investments, but cloud deployments are closing the gap as vendor platforms mature and data residency concerns are addressed through sovereign cloud options and hybrid architectures.

By Component

Sub-SegmentKey Trend
SolutionIntegrated platform suites consolidating RPA, AI, and process mining into single stacks
ServicesGrowing demand for managed automation, CoE-as-a-service, and implementation consulting


The solution segment benefits from enterprise preference for unified platforms, while services growth reflects the reality that many organizations lack in-house expertise to design, deploy, and govern automation programs at scale.

By Business Function

Sub-SegmentKey Trend
IT OperationsAIOps-driven infrastructure automation and incident response workflows
Finance & AccountingInvoice processing, reconciliation, and regulatory reporting automation
Sales & MarketingAI-powered lead scoring, campaign orchestration, and personalization engines
Other FunctionsHR onboarding, procurement, supply chain visibility, and customer service


IT operations dominates because automation initiatives typically originate within technology teams, while sales and marketing is the fastest-growing function as generative AI unlocks new content and engagement workflows.

By Enterprise Size

Sub-SegmentKey Trend
Large EnterprisesMulti-platform deployments with enterprise-grade governance and global rollouts
Small and Medium Enterprises (SMEs)Pay-per-use models and template-driven onboarding reducing time to value


Large enterprises command the spending majority, but SME adoption is accelerating as vendors introduce free tiers, industry-specific starter kits, and community-supported bot libraries.

By End-User Vertical

Sub-SegmentKey Trend
BFSICompliance-driven automation for KYC, AML, claims, and fraud detection
Telecom & ITNetwork operations, customer service, and billing workflow automation
Retail & Consumer GoodsOrder management, inventory optimization, and omnichannel engagement
Other VerticalsHealthcare, manufacturing, energy, government, and logistics


BFSI is poised for the strongest growth trajectory as regulatory complexity intensifies, while telecom and IT maintain share leadership through deeply embedded operational automation.




Download PDF ×

We do not share your information with anyone. However, we may send you emails based on your report interest from time to time. You may contact us at any time to opt-out.