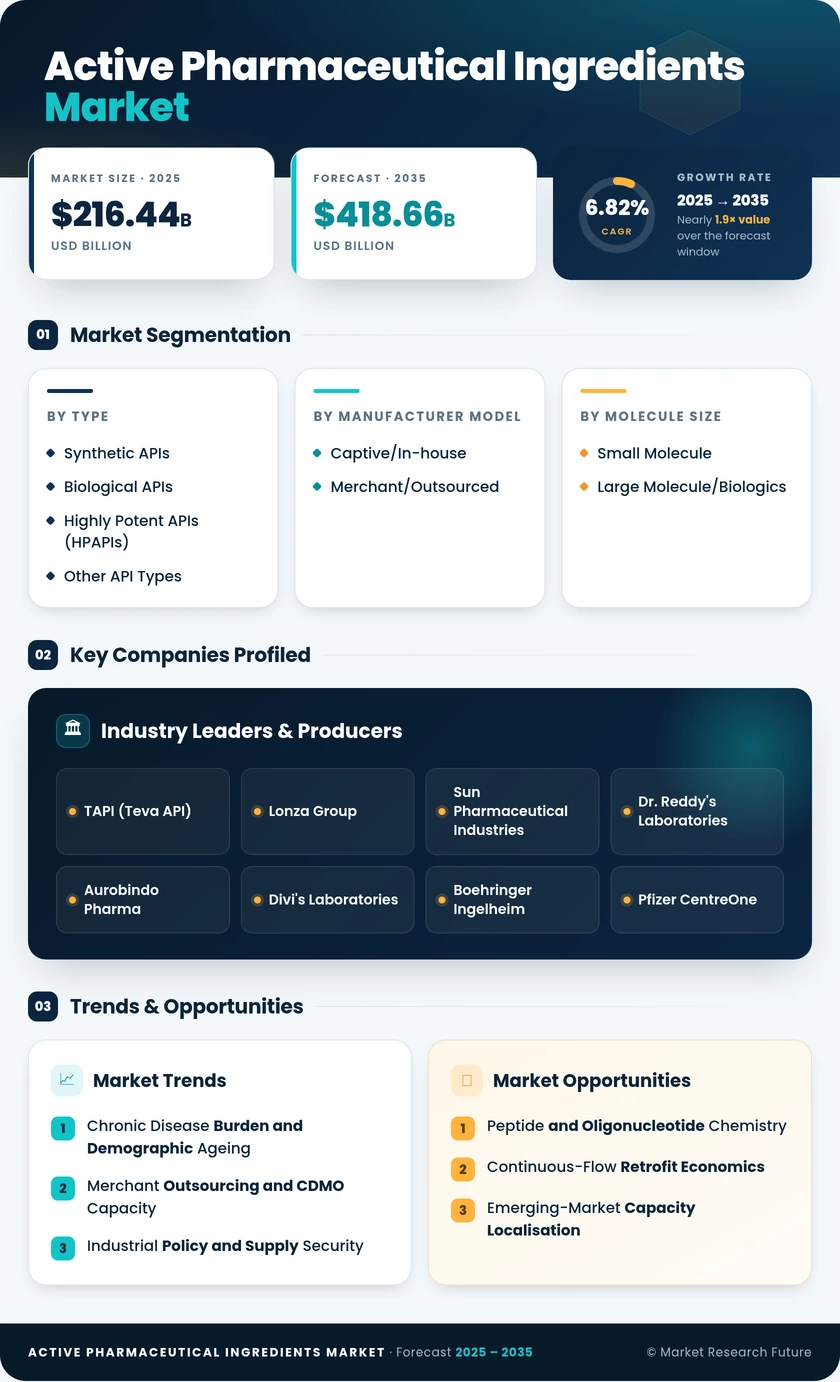
Active Pharmaceutical Ingredients Market (2026 - 2035)

Active Pharmaceutical Ingredients Market Research Report: Size, Share, Trend Analysis By Types (Synthetic APIs, Biotech APIs, Natural APIs), By Formulation (Tablets, Injectables, Capsules, Others), By Therapeutic Area (Cardiovascular, Oncology, Diabetes, Psychiatry, Infectious Diseases), By Manufacturing Process (Batch Manufacturing, Continuous Manufacturing, Contract Manufacturing) and By Regional (North America, Europe, South America, Asia Pacific, Middle East and Africa) - Growth Outlook & Industry Forecast 2025 To 2035

Forecast Period
2026-2035
CAGR
6.82%
2025 Market Size
USD 216.44 Billion
2035 Market Size
USD 418.66 Billion
Healthcare ● Updated August 2026 Report ID: MRFR/HC/0876-CR | Pages: 200 | Author: Nidhi Mandole, Rahul Gotadki
  1. 1 Market Overview |
    1. 1.1 Study Assumptions & Market Definition |
    2. 1.2 Scope of the Study |
    3. 1.3 Research Methodology |
    4. 1.4 Market Summary
  2. 2 Key Report Takeaways |
    1. 2.1 By API Type |
    2. 2.2 By Manufacturer Model and Molecule Size |
    3. 2.3 By Therapeutic Area |
    4. 2.4 By Geography
  3. 3 Global Market Size & Forecast (2021–2035) |
    1. 3.1 Historical Market Size (2021–2025) |
    2. 3.2 Current & Forecast Market Size (2026–2035) |
    3. 3.3 Market Size by Revenue (USD Billion) |
    4. 3.4 Year-over-Year Growth Analysis
  4. 4 Market Drivers Analysis |
    1. 4.1 Chronic Disease Burden and Demographic Ageing |
    2. 4.2 Merchant Outsourcing and CDMO Capacity |
    3. 4.3 Industrial Policy and Supply Security |
    4. 4.4 Biologics and High-Potency Chemistry
  5. 5 Market Restraints Analysis |
    1. 5.1 Compliance Cost Escalation |
    2. 5.2 Price Deflation in Commoditised Chemistry |
    3. 5.3 Geopolitical Fragmentation
  6. 6 Market Opportunity Analysis |
    1. 6.1 Peptide and Oligonucleotide Chemistry |
    2. 6.2 Continuous-Flow Retrofit Economics |
    3. 6.3 Emerging-Market Capacity Localisation |
    4. 6.4 Data and Digital Service Monetisation |
    5. 6.5 Sustainability-Linked Supply Agreements |
    6. 6.6 Industry Value Chain Analysis |
    7. 6.7 Porter's Five Forces Analysis
  7. 7 Regional Analysis |
    1. 7.1 North America | |
      1. 7.1.1 US | |
      2. 7.1.2 Canada | |
      3. 7.1.3 Mexico |
    2. 7.2 Europe | |
      1. 7.2.1 Germany | |
      2. 7.2.2 UK | |
      3. 7.2.3 France | |
      4. 7.2.4 Italy | |
      5. 7.2.5 Spain | |
      6. 7.2.6 Nordic Countries | |
      7. 7.2.7 Russia | |
      8. 7.2.8 Rest of Europe |
    3. 7.3 Asia-Pacific | |
      1. 7.3.1 China | |
      2. 7.3.2 India | |
      3. 7.3.3 Japan | |
      4. 7.3.4 South Korea | |
      5. 7.3.5 ASEAN | |
      6. 7.3.6 Rest of Asia-Pacific |
    4. 7.4 South America | |
      1. 7.4.1 Brazil | |
      2. 7.4.2 Argentina | |
      3. 7.4.3 Rest of South America |
    5. 7.5 Middle East & Africa | |
      1. 7.5.1 Saudi Arabia | |
      2. 7.5.2 UAE | |
      3. 7.5.3 South Africa | |
      4. 7.5.4 Egypt | |
      5. 7.5.5 Rest of Middle East & Africa
  8. 8 Future Outlook (2026–2035) |
    1. 8.1 AI-Assisted Route Design |
    2. 8.2 Continuous Manufacturing at Scale |
    3. 8.3 Supply Security as Permanent Policy |
    4. 8.4 Green Chemistry and Scope 3 Accountability
  9. 9 Segmentation Analysis |
    1. 9.1 By API Type | |
      1. 9.1.1 Synthetic APIs | |
      2. 9.1.2 Biological APIs | |
      3. 9.1.3 Highly Potent APIs (HPAPIs) | |
      4. 9.1.4 Other API Types |
    2. 9.2 By Manufacturer Model | |
      1. 9.2.1 Captive/In-house | |
      2. 9.2.2 Merchant/Outsourced |
    3. 9.3 By Molecule Size | |
      1. 9.3.1 Small Molecule | |
      2. 9.3.2 Large Molecule/Biologics |
    4. 9.4 By Therapeutic Area | |
      1. 9.4.1 Oncology | |
      2. 9.4.2 Cardiovascular | |
      3. 9.4.3 Diabetes & Metabolic | |
      4. 9.4.4 Central Nervous System | |
      5. 9.4.5 Infectious Disease | |
      6. 9.4.6 Musculoskeletal | |
      7. 9.4.7 Other Therapeutic Areas
  10. 10 Competitive Landscape |
    1. 10.1 Market Share Analysis (2026) |
    2. 10.2 Competitive Benchmarking Matrix |
    3. 10.3 Company Profiles | |
      1. 10.3.1 TAPI | |
      2. 10.3.2 Lonza Group | |
      3. 10.3.3 Sun Pharmaceutical Industries | |
      4. 10.3.4 Dr. Reddy's Laboratories | |
      5. 10.3.5 Aurobindo Pharma | |
      6. 10.3.6 Divi's Laboratories | |
      7. 10.3.7 Boehringer Ingelheim | |
      8. 10.3.8 Pfizer CentreOne | |
      9. 10.3.9 Thermo Fisher Scientific | |
      10. 10.3.10 EUROAPI | |
      11. 10.3.11 Siegfried Holding | |
      12. 10.3.12 Hovione
  11. 11 Recent Developments & News
  12. 12 Report Scope & Methodology |
    1. 12.1 Study Period & Base Year |
    2. 12.2 Data Sources & Citations |
    3. 12.3 Abbreviations
  13. 13 Detailed Sources and Citations
  14. 14 Frequently Asked Questions (FAQs)
  15. 15 LIST OF TABLES |
  16. TABLE 1 Global Active Pharmaceutical Ingredients Market Size & Forecast, by Revenue (USD Billion), 2021–2035 |
  17. TABLE 2 Global Active Pharmaceutical Ingredients Market – Year-over-Year Growth Analysis, 2021–2035 |
  18. TABLE 3 Driver Impact Analysis Matrix, 2026–2035 |
  19. TABLE 4 Restraint Impact Analysis Matrix, 2026–2035 |
  20. TABLE 5 Global Market Size, by Region, 2021–2035 (USD Billion) |
  21. TABLE 6 North America Market Size, by Country, 2021–2035 (USD Billion) |
  22. TABLE 7 Europe Market Size, by Country, 2021–2035 (USD Billion) |
  23. TABLE 8 Asia-Pacific Market Size, by Country, 2021–2035 (USD Billion) |
  24. TABLE 9 South America Market Size, by Country, 2021–2035 (USD Billion) |
  25. TABLE 10 Middle East & Africa Market Size, by Country, 2021–2035 (USD Billion) |
  26. TABLE 11 Global Market Size, by API Type, 2021–2035 (USD Billion) |
  27. TABLE 12 Global Market Size, by Manufacturer Model, 2021–2035 (USD Billion) |
  28. TABLE 13 Global Market Size, by Molecule Size, 2021–2035 (USD Billion) |
  29. TABLE 14 Global Market Size, by Therapeutic Area, 2021–2035 (USD Billion) |
  30. TABLE 15 North America Market Size, by API Type, 2021–2035 (USD Billion) |
  31. TABLE 16 North America Market Size, by Therapeutic Area, 2021–2035 (USD Billion) |
  32. TABLE 17 Europe Market Size, by API Type, 2021–2035 (USD Billion) |
  33. TABLE 18 Europe Market Size, by Manufacturer Model, 2021–2035 (USD Billion) |
  34. TABLE 19 Asia-Pacific Market Size, by API Type, 2021–2035 (USD Billion) |
  35. TABLE 20 Asia-Pacific Market Size, by Molecule Size, 2021–2035 (USD Billion) |
  36. TABLE 21 South America Market Size, by Therapeutic Area, 2021–2035 (USD Billion) |
  37. TABLE 22 Middle East & Africa Market Size, by API Type, 2021–2035 (USD Billion) |
  38. TABLE 23 Competitive Benchmarking Matrix, 2026 |
  39. TABLE 24 Company Profiles – Key Players |
  40. TABLE 25 Recent Developments & Strategic Announcements, 2023–2025 |
  41. TABLE 26 Report Scope & Methodology Summary |
  42. TABLE 27 Detailed Sources and Citations
  43. 16 LIST OF FIGURES |
  44. FIGURE 1 Market Dynamics – Drivers, Restraints, and Opportunities |
  45. FIGURE 2 Industry Value Chain Analysis |
  46. FIGURE 3 Porter's Five Forces Analysis |
  47. FIGURE 4 Global Market Size Trend, 2021–2035 (USD Billion) |
  48. FIGURE 5 Year-over-Year Growth Trend, 2022–2035 (%) |
  49. FIGURE 6 Market Share by API Type, 2025 vs 2035 (%) |
  50. FIGURE 7 Market Share by Manufacturer Model, 2025 vs 2035 (%) |
  51. FIGURE 8 Market Share by Molecule Size, 2025 (%) |
  52. FIGURE 9 Market Share by Therapeutic Area, 2025 (%) |
  53. FIGURE 10 Regional Market Share, 2025 (%) |
  54. FIGURE 11 Regional CAGR Comparison, 2026–2035 (%) |
  55. FIGURE 12 Country-Level Share within Asia-Pacific, 2025 (%) |
  56. FIGURE 13 Competitive Landscape – Revenue Share Ranges, 2026 |
  57. FIGURE 14 Strategic Positioning Matrix of Key Players |
  58. FIGURE 15 Regulatory and Policy Timeline, 2023–2030
Share::
Request Free Sample

Segmentation Quick Reference

DimensionSub-SegmentsDominant SegmentFastest Growing Segment
By API TypeSynthetic APIs; Biological APIs; Highly Potent APIs (HPAPIs); Other API TypesSynthetic APIsBiological APIs
By Manufacturer ModelCaptive/In-house; Merchant/OutsourcedCaptive/In-houseMerchant/Outsourced
By Molecule SizeSmall Molecule; Large Molecule/BiologicsSmall MoleculeLarge Molecule/Biologics
By Therapeutic AreaOncology; Cardiovascular; Diabetes & Metabolic; Central Nervous System; Infectious Disease; Musculoskeletal; Other Therapeutic AreasCardiovascularOncology
By GeographyNorth America; Europe; Asia-Pacific; South America; Middle East & AfricaNorth AmericaAsia-Pacific


Market Segmentation Overview

By API Type

Sub-SegmentKey Trend
Synthetic APIsRoute redesign toward flow chemistry to defend margin against tender deflation
Biological APIsTitre improvements lowering cost per gram and expanding biosimilar viability
Highly Potent APIs (HPAPIs)OEB-5 containment scarcity sustaining premium tolling rates
Other API TypesSemi-synthetic and plant-derived molecules gaining traction in nutraceutical crossover


Molecular class remains the sharpest predictor of profitability. Producers holding containment or cell culture assets capture disproportionate value, while commodity synthetic chemistry competes almost entirely on landed cost and reliability of delivery.

By Manufacturer Model

Sub-SegmentKey Trend
Captive/In-houseRetained only for proprietary routes carrying genuine competitive secrecy
Merchant/OutsourcedSteady share gain as sponsors redeploy capital toward clinical pipelines


Ownership is migrating. Each year a further slice of originator chemistry transfers to specialist suppliers, concentrating manufacturing know-how outside the sponsors who commercialise the finished product.

By Molecule Size

Sub-SegmentKey Trend
Small MoleculeOral solid dose volume anchoring baseline demand across all regions
Large Molecule/BiologicsCapacity additions in Korea, Ireland, and the US easing prior bottlenecks


Size dictates the plant. Peptides straddle both categories and currently represent the tightest capacity constraint in the industry, with demand outrunning solid-phase synthesis availability.

By Therapeutic Area

Sub-SegmentKey Trend
OncologyConjugate payload demand driving premium containment investment
CardiovascularStable high-tonnage demand from ageing populations
Diabetes & MetabolicIncretin pipeline reshaping peptide capacity allocation
Central Nervous SystemRising neurology and psychiatry prescribing volumes
Infectious DiseaseStockpiling mandates supporting antimicrobial intermediate demand
MusculoskeletalMature analgesic and anti-inflammatory volume base
Other Therapeutic AreasOphthalmology and rare disease adding small but high-value molecules


Therapeutic mix decides growth exposure. Suppliers weighted toward oncology and metabolic chemistry outgrow the blended average, while cardiovascular franchises deliver predictable cash that funds the transition.

By Geography

Sub-SegmentKey Trend
North AmericaFederal onshoring awards rebuilding essential-medicine chemistry
EuropeNon-price procurement criteria monetising regulatory and environmental overhead
Asia-PacificIncentive-funded fermentation capacity restoring upstream self-sufficiency
South AmericaTechnology transfer tied to public procurement volume
Middle East & AfricaSovereign funds financing localisation from a small installed base


Geography now carries policy risk as much as cost advantage. Sourcing strategies built purely on unit economics are being rewritten around origin rules, and producers with plants on both sides of the emerging trade divide hold the strongest hand.




Share::
Request Free Sample
Download PDF ×

We do not share your information with anyone. However, we may send you emails based on your report interest from time to time. You may contact us at any time to opt-out.