ID: MRFR/Pharma/0876-CR | February 2021 | Region: Global | 157 Pages
1 Report Prologue
2 Market Introduction
2.1 Scope Of Study 20
2.2 Research Objective 20
2.3 List Of Assumptions 20
2.4 Market Structure 21
3 Research Methodology
3.1 Research Process 23
3.2 Primary Research 24
3.3 Secondary Research 25
3.4 Market Size Estimation 26
3.5 Forecast Model 26
4 Market Dynamics
4.1 Introduction 28
4.1.1 Drivers 28
4.1.1.1 Increasing Occurrences Of Chronic Diseases 28
4.1.1.2 Growth In Abbreviated New Drug Applications (ANDA) 29
4.1.1.3 Rising Acceptance And Uptake Of Biopharmaceuticals 29
4.1.1.4 Growing Importance Of Generics 30
4.1.2 Restraints 30
4.1.2.1 Stringent Regulatory Policies 30
4.1.2.2 Adverse Drug Price Control Policies Across Numerous Countries 30
4.1.3 Opportunities 31
4.1.3.1 Emerging Biosimilar Market 31
4.2 Increasing Scope For High-Potency Active Pharmaceutical Ingredients 31
4.3 Macroeconomic Indicators 31
5 Market Factor Analysis
5.1 Porter’s Five Forces Model 33
5.1.1 Bargaining Power Of Suppliers 33
5.1.2 Bargaining Power Of Buyers 34
5.1.3 Threat Of New Entrants 34
5.1.4 Threat Of Substitutes 34
5.1.5 Intensity Of Rivalry 34
5.2 Value Chain Analysis 35
5.2.1 Research & Development 35
5.2.2 Manufacturing 35
5.2.3 Distribution 35
5.2.4 Marketing & Sales 36
5.2.5 Post-Sales Monitoring 36
5.3 Demand & Supply: Gap Analysis 36
5.4 Pricing Analysis 36
6 Active Pharmaceutical Ingredients Market, By Manufacturing Process
6.1 Introduction 38
6.1.1 Captive Manufacturing 40
6.1.2 Contract Manufacturing 40
7 Active Pharmaceutical Ingredients Market, By Type Of Synthesis
7.1 Introduction 42
7.2 Synthetic 43
7.3 Biotech 44
7.3.1 Monoclonal Antibodies 44
7.3.2 Recombinant Proteins 44
7.3.3 Vaccines 45
7.3.4 Others 45
8 Active Pharmaceutical Ingredients Market, By API Formulation
8.1 Introduction 47
8.2 Generic API 48
8.3 Branded/Innovative API 49
9 Active Pharmaceutical Ingredients Market, By Application
9.1 Introduction 51
9.2 Cardiovascular Disease 54
9.3 Oncology 54
9.4 Neurological Disorders 54
9.5 Orthopedic Disorders 55
9.6 Respiratory 55
9.7 Gastrointestinal Disorders 55
9.8 Urology 56
9.9 Others 56
10 Active Pharmaceutical Ingredients Market, By Molecule
10.1 Introduction 58
10.2 Molecule 58
10.3 Large Molecule 59
10.4 Small Molecule 59
11 Global Active Pharmaceutical Ingredients Market, By Region
11.1 Introduction 61
11.2 Americas 62
Active Pharmaceutical Ingredients Market, By Manufacturing Process
Active Pharmaceutical Ingredients Market, By Type Of Synthesis
Active Pharmaceutical Ingredients Market, By API Formulation
Active Pharmaceutical Ingredients Market, By Application
Active Pharmaceutical Ingredients Market, By Molecule
11.2.1 North America 65
Active Pharmaceutical Ingredients Market, By Manufacturing Process
Active Pharmaceutical Ingredients Market, By Type Of Synthesis
Active Pharmaceutical Ingredients Market, By API Formulation
Active Pharmaceutical Ingredients Market, By Application
Active Pharmaceutical Ingredients Market, By Molecule
11.2.1.1 US. 67
Active Pharmaceutical Ingredients Market, By Manufacturing Process
Active Pharmaceutical Ingredients Market, By Type Of Synthesis
Active Pharmaceutical Ingredients Market, By API Formulation
Active Pharmaceutical Ingredients Market, By Application
Active Pharmaceutical Ingredients Market, By Molecule
11.2.1.2 Canada 69
Active Pharmaceutical Ingredients Market, By Manufacturing Process
Active Pharmaceutical Ingredients Market, By Type Of Synthesis
Active Pharmaceutical Ingredients Market, By API Formulation
Active Pharmaceutical Ingredients Market, By Application
Active Pharmaceutical Ingredients Market, By Molecule
11.2.2 South America 71
Active Pharmaceutical Ingredients Market, By Manufacturing Process
Active Pharmaceutical Ingredients Market, By Type Of Synthesis
Active Pharmaceutical Ingredients Market, By API Formulation
Active Pharmaceutical Ingredients Market, By Application
Active Pharmaceutical Ingredients Market, By Molecule
11.3 Europe 73
Active Pharmaceutical Ingredients Market, By Manufacturing Process
Active Pharmaceutical Ingredients Market, By Type Of Synthesis
Active Pharmaceutical Ingredients Market, By API Formulation
Active Pharmaceutical Ingredients Market, By Application
Active Pharmaceutical Ingredients Market, By Molecule
11.3.1 Western Europe 76
Active Pharmaceutical Ingredients Market, By Manufacturing Process
Active Pharmaceutical Ingredients Market, By Type Of Synthesis
Active Pharmaceutical Ingredients Market, By API Formulation
Active Pharmaceutical Ingredients Market, By Application
Active Pharmaceutical Ingredients Market, By Molecule
11.3.1.1 Germany 78
Active Pharmaceutical Ingredients Market, By Manufacturing Process
Active Pharmaceutical Ingredients Market, By Type Of Synthesis
Active Pharmaceutical Ingredients Market, By API Formulation
Active Pharmaceutical Ingredients Market, By Application
Active Pharmaceutical Ingredients Market, By Molecule
11.3.1.2 France 80
Active Pharmaceutical Ingredients Market, By Manufacturing Process
Active Pharmaceutical Ingredients Market, By Type Of Synthesis
Active Pharmaceutical Ingredients Market, By API Formulation
Active Pharmaceutical Ingredients Market, By Application
Active Pharmaceutical Ingredients Market, By Molecule
11.3.1.3 UK 82
Active Pharmaceutical Ingredients Market, By Manufacturing Process
Active Pharmaceutical Ingredients Market, By Type Of Synthesis
Active Pharmaceutical Ingredients Market, By API Formulation
Active Pharmaceutical Ingredients Market, By Application
Active Pharmaceutical Ingredients Market, By Molecule
11.3.1.4 Italy 84
Active Pharmaceutical Ingredients Market, By Manufacturing Process
Active Pharmaceutical Ingredients Market, By Type Of Synthesis
Active Pharmaceutical Ingredients Market, By API Formulation
Active Pharmaceutical Ingredients Market, By Application
Active Pharmaceutical Ingredients Market, By Molecule
11.3.1.5 Spain 86
Active Pharmaceutical Ingredients Market, By Manufacturing Process
Active Pharmaceutical Ingredients Market, By Type Of Synthesis
Active Pharmaceutical Ingredients Market, By API Formulation
Active Pharmaceutical Ingredients Market, By Application
Active Pharmaceutical Ingredients Market, By Molecule
11.3.1.6 Rest Of Western Europe 88
Active Pharmaceutical Ingredients Market, By Manufacturing Process
Active Pharmaceutical Ingredients Market, By Type Of Synthesis
Active Pharmaceutical Ingredients Market, By API Formulation
Active Pharmaceutical Ingredients Market, By Application
Active Pharmaceutical Ingredients Market, By Molecule
11.3.2 Eastern Europe 90
Active Pharmaceutical Ingredients Market, By Manufacturing Process
Active Pharmaceutical Ingredients Market, By Type Of Synthesis
Active Pharmaceutical Ingredients Market, By API Formulation
Active Pharmaceutical Ingredients Market, By Application
Active Pharmaceutical Ingredients Market, By Molecule
11.4 Asia-Pacific 92
Active Pharmaceutical Ingredients Market, By Manufacturing Process
Active Pharmaceutical Ingredients Market, By Type Of Synthesis
Active Pharmaceutical Ingredients Market, By API Formulation
Active Pharmaceutical Ingredients Market, By Application
Active Pharmaceutical Ingredients Market, By Molecule
11.4.1 Asia-Pacific 93
Active Pharmaceutical Ingredients Market, By Manufacturing Process
Active Pharmaceutical Ingredients Market, By Type Of Synthesis
Active Pharmaceutical Ingredients Market, By API Formulation
Active Pharmaceutical Ingredients Market, By Application
Active Pharmaceutical Ingredients Market, By Molecule
11.4.2 Japan 95
Active Pharmaceutical Ingredients Market, By Manufacturing Process
Active Pharmaceutical Ingredients Market, By Type Of Synthesis
Active Pharmaceutical Ingredients Market, By API Formulation
Active Pharmaceutical Ingredients Market, By Application
Active Pharmaceutical Ingredients Market, By Molecule
11.4.3 China 97
Active Pharmaceutical Ingredients Market, By Manufacturing Process
Active Pharmaceutical Ingredients Market, By Type Of Synthesis
Active Pharmaceutical Ingredients Market, By API Formulation
Active Pharmaceutical Ingredients Market, By Application
Active Pharmaceutical Ingredients Market, By Molecule
11.4.4 India 99
Active Pharmaceutical Ingredients Market, By Manufacturing Process
Active Pharmaceutical Ingredients Market, By Type Of Synthesis
Active Pharmaceutical Ingredients Market, By API Formulation
Active Pharmaceutical Ingredients Market, By Application
Active Pharmaceutical Ingredients Market, By Molecule
11.4.5 Australia 101
Active Pharmaceutical Ingredients Market, By Manufacturing Process
Active Pharmaceutical Ingredients Market, By Type Of Synthesis
Active Pharmaceutical Ingredients Market, By API Formulation
Active Pharmaceutical Ingredients Market, By Application
Active Pharmaceutical Ingredients Market, By Molecule
11.4.6 SouthKorea 103
Active Pharmaceutical Ingredients Market, By Manufacturing Process
Active Pharmaceutical Ingredients Market, By Type Of Synthesis
Active Pharmaceutical Ingredients Market, By API Formulation
Active Pharmaceutical Ingredients Market, By Application
Active Pharmaceutical Ingredients Market, By Molecule
11.4.7 Rest Of Asia-Pacific 105
Active Pharmaceutical Ingredients Market, By Manufacturing Process
Active Pharmaceutical Ingredients Market, By Type Of Synthesis
Active Pharmaceutical Ingredients Market, By API Formulation
Active Pharmaceutical Ingredients Market, By Application
Active Pharmaceutical Ingredients Market, By Molecule
11.5 Middle East & Africa 107
Active Pharmaceutical Ingredients Market, By Manufacturing Process
Active Pharmaceutical Ingredients Market, By Type Of Synthesis
Active Pharmaceutical Ingredients Market, By API Formulation
Active Pharmaceutical Ingredients Market, By Application
Active Pharmaceutical Ingredients Market, By Molecule
11.5.1 Middle East And Africa 108
Active Pharmaceutical Ingredients Market, By Manufacturing Process
Active Pharmaceutical Ingredients Market, By Type Of Synthesis
Active Pharmaceutical Ingredients Market, By API Formulation
Active Pharmaceutical Ingredients Market, By Application
Active Pharmaceutical Ingredients Market, By Molecule
11.5.2 Middle East 110
Active Pharmaceutical Ingredients Market, By Manufacturing Process
Active Pharmaceutical Ingredients Market, By Type Of Synthesis
Active Pharmaceutical Ingredients Market, By API Formulation
Active Pharmaceutical Ingredients Market, By Application
Active Pharmaceutical Ingredients Market, By Molecule
11.5.2.1 Saudi Arabia 111
Active Pharmaceutical Ingredients Market, By Manufacturing Process
Active Pharmaceutical Ingredients Market, By Type Of Synthesis
Active Pharmaceutical Ingredients Market, By API Formulation
Active Pharmaceutical Ingredients Market, By Application
Active Pharmaceutical Ingredients Market, By Molecule
 
11.5.3 Africa 114
Active Pharmaceutical Ingredients Market, By Manufacturing Process
Active Pharmaceutical Ingredients Market, By Type Of Synthesis
Active Pharmaceutical Ingredients Market, By API Formulation
Active Pharmaceutical Ingredients Market, By Application
Active Pharmaceutical Ingredients Market, By Molecule
11.5.3.1 North Africa 116
Active Pharmaceutical Ingredients Market, By Manufacturing Process
Active Pharmaceutical Ingredients Market, By Type Of Synthesis
Active Pharmaceutical Ingredients Market, By API Formulation
Active Pharmaceutical Ingredients Market, By Application
Active Pharmaceutical Ingredients Market, By Molecule
12 Competitive Landscape
12.1 Company Market Share Analysis 119
12.1.1 Introduction 119
12.2 Merger And Acquisition 119
12.3 Major Strategies Adopted By Market Players 120
12.4 Competitive Landscape 121
12.4.1 Introduction 121
12.4.2 Strategic Partnership 121
12.5 Key Developments 122
12.6 Potential Molecules 126
13 Company Profiles
Company Profiles 127
13.1 Sanofi 128
13.1.1 Company Overview 128
13.1.2 Financial Overview 128
13.1.3 Products Offering 129
13.1.4 Key Developments 130
13.1.5 SWOT Analysis 131
13.1.6 Key Strategy 131
13.2 Bayer AG 132
13.2.1 Company Overview 132
13.2.2 Financial Overview 132
13.2.3 Products Offering 133
13.2.4 Key Developments 134
13.2.5 SWOT Analysis 135
13.2.6 Key Strategy 135
13.3 Pfizer Inc. 136
13.3.1 Company Overview 136
13.3.2 Financial Overview 136
13.3.3 Products Offering 137
13.3.4 Key Developments 138
13.3.5 SWOT Analysis 139
13.3.6 Key Strategy 139
 
13.4 F. Hoffmann-La Roche AG 140
13.4.1 Company Overview 140
13.4.2 Financial Overview 140
13.4.3 Products Offering 141
13.4.4 Key Developments 142
13.4.5 SWOT Analysis 142
13.4.6 Key Strategy 142
13.5 Abbott Laboratories 143
13.5.1 Company Overview 143
13.5.2 Financial Overview 143
13.5.3 Products Offering 144
13.5.4 Key Developments 144
13.5.5 SWOT Analysis 145
13.5.6 Key Strategy 145
13.6 Merck & Co., Inc. 146
13.6.1 Company Overview 146
13.6.2 Financial Overview 146
13.6.3 Products Offering 147
13.6.4 Key Developments 148
13.6.5 SWOT Analysis 149
13.6.6 Key Strategy 149
13.7 Boehringer Ingelheim GmbH 150
13.7.1 Company Overview 150
13.7.2 Financial Overview 150
13.7.3 Products Offering 151
13.7.4 Key Developments 152
13.7.5 SWOT Analysis 152
13.7.6 Key Strategy 152
13.8 Glaxosmithkline Plc (GSK) 153
13.8.1 Company Overview 153
13.8.2 Financial Overview 153
13.8.3 Products Offering 154
13.8.4 Key Developments 154
13.8.5 SWOT Analysis 155
13.8.6 Key Strategy 155
13.9 Novartis AG 156
13.9.1 Company Overview 156
13.9.2 Financial Overview 156
13.9.3 Products Offering 157
13.9.4 Key Developments 158
13.9.5 SWOT Analysis 159
13.9.6 Key Strategy 159
13.10 Eli Lilly And Company 160
13.10.1 Company Overview 160
13.10.2 Financial Overview 160
13.10.3 Products Offering 161
13.10.4 Key Developments 161
13.10.5 SWOT Analysis 161
13.10.6 Key Strategy 162
13.11 Teva Pharmaceutical Industries Ltd 163
13.11.1 Company Overview 163
13.11.2 Financial Overview 163
13.11.3 Products Offering 164
13.11.4 Key Developments 164
13.11.5 SWOT Analysis 165
13.11.6 Key Strategy 165
14 Conclusion
14.1 Key Findings 167
14.1.1 CEO’s Viewpoint 167
14.1.2 Unmet Needs 167
14.1.3 Key Companies To Watch 167
14.1.4 Prediction 167
15 Appendix
15.1 Discussion Blue Print 169
15.1.1 References 171
16 List Of Tables
TABLE 1 MARKET SYNOPSIS 17
TABLE 2 LIST OF ASSUMPTIONS 20
TABLE 3 GLOBAL ACTIVE PHARMACEUTICAL INGREDIENTS MARKET, BY MANUFACTURING PROCESS, 2020–2027 (USD MILLION) 39
TABLE 4 GLOBAL ACTIVE PHARMACEUTICAL INGREDIENTS MARKET FOR CAPTIVE MANUFACTURING, BY REGION,
2020–2027 (USD MILLION) 40
TABLE 5 GLOBAL ACTIVE PHARMACEUTICAL INGREDIENTS MARKET FOR CONTRACT MANUFACTURING, BY REGION
2020–2027 (USD MILLION) 40
TABLE 6 GLOBAL ACTIVE PHARMACEUTICAL INGREDIENTS MARKET, BY TYPE OF SYNTHESIS, 2020–2027 (USD MILLION) 43
TABLE 7 GLOBAL ACTIVE PHARMACEUTICAL INGREDIENTS MARKET, BY SYNTHETIC, 2020–2027 (USD MILLION) 43
TABLE 8 GLOBAL ACTIVE PHARMACEUTICAL INGREDIENTS MARKET, BY BIOLOGICAL, 2020–2027 (USD MILLION) 44
TABLE 9 GLOBAL ACTIVE PHARMACEUTICAL INGREDIENTS MARKET FOR MONOCLONAL ANTIBODIES, BY REGION
2020–2027 (USD MILLION) 44
TABLE 10 GLOBAL ACTIVE PHARMACEUTICAL INGREDIENTS MARKET FOR RECOMBINANT PROTEINS, BY REGION,
2020–2027 (USD MILLION) 44
TABLE 11 GLOBAL ACTIVE PHARMACEUTICAL INGREDIENTS MARKET FOR BIOTECH, BY VACCINES, 2020–2027 (USD MILLION) 45
TABLE 12 GLOBAL ACTIVE PHARMACEUTICAL INGREDIENTS MARKET FOR OTHERS, BY VACCINES, 2020–2027 (USD MILLION) 45
TABLE 13 GLOBAL ACTIVE PHARMACEUTICAL INGREDIENTS MARKET, BY API FORMULATION, 2020–2027 (USD MILLION) 48
TABLE 14 GLOBAL ACTIVE PHARMACEUTICAL INGREDIENTS MARKET FOR GENERIC API, BY REGION, 2020–2027 (USD MILLION) 48
TABLE 15 GLOBAL ACTIVE PHARMACEUTICAL INGREDIENTS MARKET FOR BRANDED/ INNOVATIVE API, BY REGION,
2020–2027 (USD MILLION) 49
TABLE 16 GLOBAL ACTIVE PHARMACEUTICAL INGREDIENTS MARKET, BY APPLICATION, 2020–2027 (USD MILLION) 53
TABLE 17 GLOBAL ACTIVE PHARMACEUTICAL INGREDIENTS MARKET FOR CARDIOVASCULAR DISEASE, BY REGION,
2020–2027 (USD MILLION) 54
TABLE 18 GLOBAL ACTIVE PHARMACEUTICAL INGREDIENTS MARKET FOR ONCOLOGY, BY REGION, 2020–2027 (USD MILLION) 54
TABLE 19 GLOBAL ACTIVE PHARMACEUTICAL INGREDIENTS MARKET FOR NEUROLOGICAL DISORDERS, BY REGION,
2020–2027 (USD MILLION) 54
TABLE 20 GLOBAL ACTIVE PHARMACEUTICAL INGREDIENTS MARKET FOR ONCOLOGY, BY REGION, 2020–2027 (USD MILLION) 55
TABLE 21 GLOBAL ACTIVE PHARMACEUTICAL INGREDIENTS MARKET FOR RESPIRATORY, BY REGION, 2020–2027 (USD MILLION) 55
TABLE 22 GLOBAL ACTIVE PHARMACEUTICAL INGREDIENTS MARKET FOR GASTROINTESTINAL DISORDERS, BY REGION,
2020–2027 (USD MILLION) 55
TABLE 23 GLOBAL ACTIVE PHARMACEUTICAL INGREDIENTS MARKET FOR UROLOGY, BY REGION, 2020–2027 (USD MILLION) 56
TABLE 24 GLOBAL ACTIVE PHARMACEUTICAL INGREDIENTS MARKET FOR OTHER APPLICATION, BY REGION, 2020–2027 (USD MILLION) 56
TABLE 25 GLOBAL ACTIVE PHARMACEUTICAL INGREDIENTS MARKET, BY MOLECULE, 2020–2027 (USD MILLION) 58
TABLE 26 GLOBAL ACTIVE PHARMACEUTICAL INGREDIENTS MARKET FOR LARGE MOLECULE, BY REGION, 2020–2027 (USD MILLION) 59
TABLE 27 GLOBAL ACTIVE PHARMACEUTICAL INGREDIENTS MARKET FOR SMALL MOLECULE, BY REGION, 2020–2027 (USD MILLION) 59
TABLE 28 GLOBAL ACTIVE PHARMACEUTICAL INGREDIENTS MARKET, BY REGION, 2020–2027 (USD MILLION) 61
TABLE 29 AMERICAS ACTIVE PHARMACEUTICAL INGREDIENTS MARKET, BY REGION, 2020–2027 (USD MILLION) 62
TABLE 30 AMERICAS ACTIVE PHARMACEUTICAL INGREDIENTS MARKET, BY MANUFACTURING PROCESS, 2020–2027 (USD MILLION) 63
TABLE 31 AMERICAS ACTIVE PHARMACEUTICAL INGREDIENTS MARKET BY TYPE OF SYNTHESIS, 2020–2027 (USD MILLION) 63
TABLE 32 AMERICAS ACTIVE PHARMACEUTICAL INGREDIENTS MARKET, BY BIOTECH, 2020–2027 (USD MILLION) 63
TABLE 33 AMERICAS ACTIVE PHARMACEUTICAL INGREDIENTS MARKET, BY API FORMULATION, 2020–2027 (USD MILLION) 63
TABLE 34 AMERICAS ACTIVE PHARMACEUTICAL INGREDIENTS MARKET, BY APPLICATION, 2020–2027 (USD MILLION) 64
TABLE 35 AMERICAS ACTIVE PHARMACEUTICAL INGREDIENTS MARKET, BY MOLECULE, 2020–2027 (USD MILLION) 64
TABLE 36 NORTH AMERICA: ACTIVE PHARMACEUTICAL INGREDIENTS MARKET, BY COUNTRY, 2020-2027 (USD MILLION) 65
TABLE 37 NORTH AMERICA ACTIVE PHARMACEUTICAL INGREDIENTS MARKET, BY MANUFACTURING PROCESS,
2020–2027 (USD MILLION) 65
TABLE 38 NORTH AMERICA ACTIVE PHARMACEUTICAL INGREDIENTS MARKET BY TYPE OF SYNTHESIS, 2020–2027 (USD MILLION) 65
TABLE 39 NORTH AMERICA ACTIVE PHARMACEUTICAL INGREDIENTS MARKET, BY BIOTECH, 2020–2027 (USD MILLION) 66
TABLE 40 NORTH AMERICA ACTIVE PHARMACEUTICAL INGREDIENTS MARKET, BY API FORMULATION, 2020–2027 (USD MILLION) 66
TABLE 41 NORTH AMERICA ACTIVE PHARMACEUTICAL INGREDIENTS MARKET, BY APPLICATION, 2020–2027 (USD MILLION) 66
TABLE 42 NORTH AMERICA ACTIVE PHARMACEUTICAL INGREDIENTS MARKET, BY MOLECULE, 2020–2027 (USD MILLION) 67
TABLE 43 US ACTIVE PHARMACEUTICAL INGREDIENTS MARKET, BY MANUFACTURING PROCESS, 2020–2027 (USD MILLION) 67
TABLE 44 US ACTIVE PHARMACEUTICAL INGREDIENTS MARKET BY TYPE OF SYNTHESIS, 2020–2027 (USD MILLION) 67
TABLE 45 US ACTIVE PHARMACEUTICAL INGREDIENTS MARKET, BY BIOTECH, 2020–2027 (USD MILLION) 67
TABLE 46 US ACTIVE PHARMACEUTICAL INGREDIENTS MARKET, BY API FORMULATION, 2020–2027 (USD MILLION) 68
TABLE 47 US ACTIVE PHARMACEUTICAL INGREDIENTS MARKET, BY APPLICATION, 2020–2027 (USD MILLION) 68
TABLE 48 US ACTIVE PHARMACEUTICAL INGREDIENTS MARKET, BY MOLECULE, 2020–2027 (USD MILLION) 68
TABLE 49 CANADA ACTIVE PHARMACEUTICAL INGREDIENTS MARKET, BY MANUFACTURING PROCESS, 2020–2027 (USD MILLION) 69
TABLE 50 CANADA ACTIVE PHARMACEUTICAL INGREDIENTS MARKET BY TYPE OF SYNTHESIS, 2020–2027 (USD MILLION) 69
TABLE 51 CANADA ACTIVE PHARMACEUTICAL INGREDIENTS MARKET, BY BIOTECH, 2020–2027 (USD MILLION) 69
TABLE 52 CANADA ACTIVE PHARMACEUTICAL INGREDIENTS MARKET, BY API FORMULATION, 2020–2027 (USD MILLION) 69
TABLE 53 CANADA ACTIVE PHARMACEUTICAL INGREDIENTS MARKET, BY APPLICATION, 2020–2027 (USD MILLION) 70
TABLE 54 CANADA ACTIVE PHARMACEUTICAL INGREDIENTS MARKET, BY MOLECULE, 2020–2027 (USD MILLION) 70
TABLE 55 SOUTH AMERICA ACTIVE PHARMACEUTICAL INGREDIENTS MARKET, BY MANUFACTURING PROCESS,
2020–2027 (USD MILLION) 71
TABLE 56 SOUTH AMERICA ACTIVE PHARMACEUTICAL INGREDIENTS MARKET BY TYPE OF SYNTHESIS, 2020–2027 (USD MILLION) 71
TABLE 57 SOUTH AMERICA ACTIVE PHARMACEUTICAL INGREDIENTS MARKET, BY BIOTECH, 2020–2027 (USD MILLION) 71
TABLE 58 SOUTH AMERICA ACTIVE PHARMACEUTICAL INGREDIENTS MARKET, BY API FORMULATION, 2020–2027 (USD MILLION) 72
TABLE 59 SOUTH AMERICA ACTIVE PHARMACEUTICAL INGREDIENTS MARKET, BY APPLICATION, 2020–2027 (USD MILLION) 72
TABLE 60 SOUTH AMERICA ACTIVE PHARMACEUTICAL INGREDIENTS MARKET, BY MOLECULE, 2020–2027 (USD MILLION) 72
TABLE 61 EUROPE ACTIVE PHARMACEUTICAL INGREDIENTS MARKET, BY COUNTRY, 2020–2027 (USD MILLION) 73
TABLE 62 EUROPE ACTIVE PHARMACEUTICAL INGREDIENTS MARKET, BY MANUFACTURING PROCESS, 2020–2027 (USD MILLION) 74
TABLE 63 EUROPE ACTIVE PHARMACEUTICAL INGREDIENTS MARKET BY TYPE OF SYNTHESIS, 2020–2027 (USD MILLION) 74
TABLE 64 EUROPE ACTIVE PHARMACEUTICAL INGREDIENTS MARKET, BY BIOTECH, 2020–2027 (USD MILLION) 75
TABLE 65 EUROPE ACTIVE PHARMACEUTICAL INGREDIENTS MARKET, BY API FORMULATION, 2020–2027 (USD MILLION) 75
TABLE 66 EUROPE ACTIVE PHARMACEUTICAL INGREDIENTS MARKET, BY APPLICATION, 2020–2027 (USD MILLION) 75
TABLE 67 EUROPE ACTIVE PHARMACEUTICAL INGREDIENTS MARKET, BY MOLECULE, 2020–2027 (USD MILLION) 76
TABLE 68 WESTERN EUROPE ACTIVE PHARMACEUTICAL INGREDIENTS MARKET, BY MANUFACTURING PROCESS,
2020–2027 (USD MILLION) 76
TABLE 69 WESTERN EUROPE ACTIVE PHARMACEUTICAL INGREDIENTS MARKET BY TYPE OF SYNTHESIS, 2020–2027 (USD MILLION) 76
TABLE 70 WESTERN EUROPE ACTIVE PHARMACEUTICAL INGREDIENTS MARKET, BY BIOTECH, 2020–2027 (USD MILLION) 77
TABLE 71 WESTERN EUROPE ACTIVE PHARMACEUTICAL INGREDIENTS MARKET, BY API FORMULATION, 2020–2027 (USD MILLION) 77
TABLE 72 WESTERN EUROPE ACTIVE PHARMACEUTICAL INGREDIENTS MARKET, BY APPLICATION, 2020–2027 (USD MILLION) 77
TABLE 73 WESTERN EUROPE ACTIVE PHARMACEUTICAL INGREDIENTS MARKET, BY MOLECULE, 2020–2027 (USD MILLION) 78
TABLE 74 GERMANY ACTIVE PHARMACEUTICAL INGREDIENTS MARKET, BY MANUFACTURING PROCESS, 2020–2027 (USD MILLION) 78
TABLE 75 GERMANY ACTIVE PHARMACEUTICAL INGREDIENTS MARKET BY TYPE OF SYNTHESIS, 2020–2027 (USD MILLION) 78
TABLE 76 GERMANY ACTIVE PHARMACEUTICAL INGREDIENTS MARKET, BY BIOTECH, 2020–2027 (USD MILLION) 78
TABLE 77 GERMANY ACTIVE PHARMACEUTICAL INGREDIENTS MARKET, BY API FORMULATION, 2020–2027 (USD MILLION) 79
TABLE 78 GERMANY ACTIVE PHARMACEUTICAL INGREDIENTS MARKET, BY APPLICATION, 2020–2027 (USD MILLION) 79
TABLE 79 GERMANY ACTIVE PHARMACEUTICAL INGREDIENTS MARKET, BY MOLECULE, 2020–2027 (USD MILLION) 79
TABLE 80 FRANCE ACTIVE PHARMACEUTICAL INGREDIENTS MARKET, BY MANUFACTURING PROCESS, 2020–2027 (USD MILLION) 80
TABLE 81 FRANCE ACTIVE PHARMACEUTICAL INGREDIENTS MARKET BY TYPE OF SYNTHESIS, 2020–2027 (USD MILLION) 80
TABLE 82 FRANCE ACTIVE PHARMACEUTICAL INGREDIENTS MARKET, BY BIOTECH, 2020–2027 (USD MILLION) 80
TABLE 83 FRANCE ACTIVE PHARMACEUTICAL INGREDIENTS MARKET, BY API FORMULATION, 2020–2027 (USD MILLION) 81
TABLE 84 FRANCE ACTIVE PHARMACEUTICAL INGREDIENTS MARKET, BY APPLICATION, 2020–2027 (USD MILLION) 81
TABLE 85 FRANCE ACTIVE PHARMACEUTICAL INGREDIENTS MARKET, BY MOLECULE, 2020–2027 (USD MILLION) 81
TABLE 86 UK ACTIVE PHARMACEUTICAL INGREDIENTS MARKET, BY MANUFACTURING PROCESS, 2020–2027 (USD MILLION) 82
TABLE 87 UK ACTIVE PHARMACEUTICAL INGREDIENTS MARKET BY TYPE OF SYNTHESIS, 2020–2027 (USD MILLION) 82
TABLE 88 UK ACTIVE PHARMACEUTICAL INGREDIENTS MARKET, BY BIOTECH, 2020–2027 (USD MILLION) 82
TABLE 89 UK ACTIVE PHARMACEUTICAL INGREDIENTS MARKET, BY API FORMULATION, 2020–2027 (USD MILLION) 82
TABLE 90 UK ACTIVE PHARMACEUTICAL INGREDIENTS MARKET, BY APPLICATION, 2020–2027 (USD MILLION) 83
TABLE 91 UK ACTIVE PHARMACEUTICAL INGREDIENTS MARKET, BY MOLECULE, 2020–2027 (USD MILLION) 83
TABLE 92 ITALY ACTIVE PHARMACEUTICAL INGREDIENTS MARKET, BY MANUFACTURING PROCESS, 2020–2027 (USD MILLION) 84
TABLE 93 ITALY ACTIVE PHARMACEUTICAL INGREDIENTS MARKET BY TYPE OF SYNTHESIS, 2020–2027 (USD MILLION) 84
TABLE 94 ITALY ACTIVE PHARMACEUTICAL INGREDIENTS MARKET, BY BIOTECH, 2020–2027 (USD MILLION) 84
TABLE 95 ITALY ACTIVE PHARMACEUTICAL INGREDIENTS MARKET, BY API FORMULATION, 2020–2027 (USD MILLION) 84
TABLE 96 ITALY ACTIVE PHARMACEUTICAL INGREDIENTS MARKET, BY APPLICATION, 2020–2027 (USD MILLION) 85
TABLE 97 ITALY ACTIVE PHARMACEUTICAL INGREDIENTS MARKET, BY MOLECULE, 2020–2027 (USD MILLION) 85
TABLE 98 SPAIN ACTIVE PHARMACEUTICAL INGREDIENTS MARKET, BY MANUFACTURING PROCESS, 2020–2027 (USD MILLION) 86
TABLE 99 SPAIN ACTIVE PHARMACEUTICAL INGREDIENTS MARKET BY TYPE OF SYNTHESIS, 2020–2027 (USD MILLION) 86
TABLE 100 SPAIN ACTIVE PHARMACEUTICAL INGREDIENTS MARKET, BY BIOTECH, 2020–2027 (USD MILLION) 86
TABLE 101 SPAIN ACTIVE PHARMACEUTICAL INGREDIENTS MARKET, BY API FORMULATION, 2020–2027 (USD MILLION) 86
TABLE 102 SPAIN ACTIVE PHARMACEUTICAL INGREDIENTS MARKET, BY APPLICATION, 2020–2027 (USD MILLION) 87
TABLE 103 SPAIN ACTIVE PHARMACEUTICAL INGREDIENTS MARKET, BY MOLECULE, 2020–2027 (USD MILLION) 87
TABLE 104 REST OF WESTERN EUROPE ACTIVE PHARMACEUTICAL INGREDIENTS MARKET, BY MANUFACTURING PROCESS,
2020–2027 (USD MILLION) 88
TABLE 105 REST OF WESTERN EUROPE ACTIVE PHARMACEUTICAL INGREDIENTS MARKET BY TYPE OF SYNTHESIS,
2020–2027 (USD MILLION) 88
TABLE 106 REST OF WESTERN EUROPE ACTIVE PHARMACEUTICAL INGREDIENTS MARKET, BY BIOTECH, 2020–2027 (USD MILLION) 88
TABLE 107 REST OF WESTERN EUROPE ACTIVE PHARMACEUTICAL INGREDIENTS MARKET, BY API FORMULATION,
2020–2027 (USD MILLION) 89
TABLE 108 REST OF WESTERN EUROPE ACTIVE PHARMACEUTICAL INGREDIENTS MARKET, BY APPLICATION, 2020–2027 (USD MILLION) 89
TABLE 109 REST OF WESTERN EUROPE ACTIVE PHARMACEUTICAL INGREDIENTS MARKET, BY MOLECULE, 2020–2027 (USD MILLION) 89
TABLE 110 EASTERN EUROPE ACTIVE PHARMACEUTICAL INGREDIENTS MARKET, BY MANUFACTURING PROCESS,
2020–2027 (USD MILLION) 90
TABLE 111 EASTERN EUROPE ACTIVE PHARMACEUTICAL INGREDIENTS MARKET BY TYPE OF SYNTHESIS, 2020–2027 (USD MILLION) 90
TABLE 112 EASTERN EUROPE ACTIVE PHARMACEUTICAL INGREDIENTS MARKET, BY BIOTECH, 2020–2027 (USD MILLION) 90
TABLE 113 EASTERN EUROPE ACTIVE PHARMACEUTICAL INGREDIENTS MARKET, BY API FORMULATION, 2020–2027 (USD MILLION) 91
TABLE 114 EASTERN EUROPE ACTIVE PHARMACEUTICAL INGREDIENTS MARKET, BY APPLICATION, 2020–2027 (USD MILLION) 91
TABLE 115 EASTERN EUROPE ACTIVE PHARMACEUTICAL INGREDIENTS MARKET, BY MOLECULE, 2020–2027 (USD MILLION) 91
TABLE 116 ASIA-PACIFIC ACTIVE PHARMACEUTICAL INGREDIENTS MARKET, BY COUNTRY, 2020–2027 (USD MILLION) 92
TABLE 117 ASIA-PACIFIC ACTIVE PHARMACEUTICAL INGREDIENTS MARKET, BY MANUFACTURING PROCESS, 2020–2027 (USD MILLION) 93
TABLE 118 ASIA-PACIFIC ACTIVE PHARMACEUTICAL INGREDIENTS MARKET BY TYPE OF SYNTHESIS, 2020–2027 (USD MILLION) 93
TABLE 119 ASIA-PACIFIC ACTIVE PHARMACEUTICAL INGREDIENTS MARKET, BY BIOTECH, 2020–2027 (USD MILLION) 94
TABLE 120 ASIA-PACIFIC ACTIVE PHARMACEUTICAL INGREDIENTS MARKET, BY API FORMULATION, 2020–2027 (USD MILLION) 94
TABLE 121 ASIA-PACIFIC ACTIVE PHARMACEUTICAL INGREDIENTS MARKET, BY APPLICATION, 2020–2027 (USD MILLION) 94
TABLE 122 ASIA-PACIFIC ACTIVE PHARMACEUTICAL INGREDIENTS MARKET, BY MOLECULE, 2020–2027 (USD MILLION) 95
TABLE 123 JAPAN ACTIVE PHARMACEUTICAL INGREDIENTS MARKET, BY MANUFACTURING PROCESS, 2020–2027 (USD MILLION) 95
TABLE 124 JAPAN ACTIVE PHARMACEUTICAL INGREDIENTS MARKET BY TYPE OF SYNTHESIS, 2020–2027 (USD MILLION) 95
TABLE 125 JAPAN ACTIVE PHARMACEUTICAL INGREDIENTS MARKET, BY BIOTECH, 2020–2027 (USD MILLION) 95
TABLE 126 JAPAN ACTIVE PHARMACEUTICAL INGREDIENTS MARKET, BY API FORMULATION, 2020–2027 (USD MILLION) 96
TABLE 127 JAPAN ACTIVE PHARMACEUTICAL INGREDIENTS MARKET, BY APPLICATION, 2020–2027 (USD MILLION) 96
TABLE 128 JAPAN ACTIVE PHARMACEUTICAL INGREDIENTS MARKET, BY MOLECULE, 2020–2027 (USD MILLION) 96
TABLE 129 CHINA ACTIVE PHARMACEUTICAL INGREDIENTS MARKET, BY MANUFACTURING PROCESS, 2020–2027 (USD MILLION) 97
TABLE 130 CHINA ACTIVE PHARMACEUTICAL INGREDIENTS MARKET BY TYPE OF SYNTHESIS, 2020–2027 (USD MILLION) 97
TABLE 131 CHINA ACTIVE PHARMACEUTICAL INGREDIENTS MARKET, BY BIOTECH, 2020–2027 (USD MILLION) 97
TABLE 132 CHINA ACTIVE PHARMACEUTICAL INGREDIENTS MARKET, BY API FORMULATION, 2020–2027 (USD MILLION) 98
TABLE 133 CHINA ACTIVE PHARMACEUTICAL INGREDIENTS MARKET, BY APPLICATION, 2020–2027 (USD MILLION) 98
TABLE 134 CHINA ACTIVE PHARMACEUTICAL INGREDIENTS MARKET, BY MOLECULE, 2020–2027 (USD MILLION) 98
TABLE 135 INDIA ACTIVE PHARMACEUTICAL INGREDIENTS MARKET, BY MANUFACTURING PROCESS, 2020–2027 (USD MILLION) 99
TABLE 136 INDIA ACTIVE PHARMACEUTICAL INGREDIENTS MARKET BY TYPE OF SYNTHESIS, 2020–2027 (USD MILLION) 99
TABLE 137 INDIA ACTIVE PHARMACEUTICAL INGREDIENTS MARKET, BY BIOTECH, 2020–2027 (USD MILLION) 99
TABLE 138 INDIA ACTIVE PHARMACEUTICAL INGREDIENTS MARKET, BY API FORMULATION, 2020–2027 (USD MILLION) 99
TABLE 139 INDIA ACTIVE PHARMACEUTICAL INGREDIENTS MARKET, BY APPLICATION, 2020–2027 (USD MILLION) 100
TABLE 140 INDIA ACTIVE PHARMACEUTICAL INGREDIENTS MARKET, BY MOLECULE, 2020–2027 (USD MILLION) 100
TABLE 141 AUSTRALIA ACTIVE PHARMACEUTICAL INGREDIENTS MARKET, BY MANUFACTURING PROCESS, 2020–2027 (USD MILLION) 101
TABLE 142 AUSTRALIA ACTIVE PHARMACEUTICAL INGREDIENTS MARKET BY TYPE OF SYNTHESIS, 2020–2027 (USD MILLION) 101
TABLE 143 AUSTRALIA ACTIVE PHARMACEUTICAL INGREDIENTS MARKET, BY BIOTECH, 2020–2027 (USD MILLION) 101
TABLE 144 AUSTRALIA ACTIVE PHARMACEUTICAL INGREDIENTS MARKET, BY API FORMULATION, 2020–2027 (USD MILLION) 101
TABLE 145 AUSTRALIA ACTIVE PHARMACEUTICAL INGREDIENTS MARKET, BY APPLICATION, 2020–2027 (USD MILLION) 102
TABLE 146 AUSTRALIA ACTIVE PHARMACEUTICAL INGREDIENTS MARKET, BY MOLECULE, 2020–2027 (USD MILLION) 102
TABLE 147 SOUTH KOREA ACTIVE PHARMACEUTICAL INGREDIENTS MARKET, BY MANUFACTURING PROCESS,
2020–2027 (USD MILLION) 103
TABLE 148 SOUTH KOREA ACTIVE PHARMACEUTICAL INGREDIENTS MARKET BY TYPE OF SYNTHESIS, 2020–2027 (USD MILLION) 103
TABLE 149 SOUTH KOREA ACTIVE PHARMACEUTICAL INGREDIENTS MARKET, BY BIOTECH, 2020–2027 (USD MILLION) 103
TABLE 150 SOUTH KOREA ACTIVE PHARMACEUTICAL INGREDIENTS MARKET, BY API FORMULATION, 2020–2027 (USD MILLION) 104
TABLE 151 SOUTH KOREA ACTIVE PHARMACEUTICAL INGREDIENTS MARKET, BY APPLICATION, 2020–2027 (USD MILLION) 104
TABLE 152 SOUTH KOREA ACTIVE PHARMACEUTICAL INGREDIENTS MARKET, BY MOLECULE, 2020–2027 (USD MILLION) 104
TABLE 153 REST OF ASIA-PACIFIC ACTIVE PHARMACEUTICAL INGREDIENTS MARKET, BY MANUFACTURING PROCESS,
2020–2027 (USD MILLION) 105
TABLE 154 REST OF ASIA-PACIFIC ACTIVE PHARMACEUTICAL INGREDIENTS MARKET BY TYPE OF SYNTHESIS, 2020–2027 (USD MILLION) 105
TABLE 155 REST OF ASIA-PACIFIC ACTIVE PHARMACEUTICAL INGREDIENTS MARKET, BY BIOTECH, 2020–2027 (USD MILLION) 105
TABLE 156 REST OF ASIA-PACIFIC ACTIVE PHARMACEUTICAL INGREDIENTS MARKET, BY API FORMULATION, 2020–2027 (USD MILLION) 106
TABLE 157 REST OF ASIA-PACIFIC ACTIVE PHARMACEUTICAL INGREDIENTS MARKET, BY APPLICATION, 2020–2027 (USD MILLION) 106
TABLE 158 REST OF ASIA-PACIFIC ACTIVE PHARMACEUTICAL INGREDIENTS MARKET, BY MOLECULE, 2020–2027 (USD MILLION) 106
TABLE 159 MIDDLE EAST & NORTH AFRICA ACTIVE PHARMACEUTICAL INGREDIENTS MARKET, BY CONSUMPTION,
2020–2027 (USD MILLION) 107
TABLE 160 MIDDLE EAST & AFRICA ACTIVE PHARMACEUTICAL INGREDIENTS MARKET, BY COUNTRY, 2020–2027 (USD MILLION) 107
TABLE 161 MIDDLE EAST AND AFRICA ACTIVE PHARMACEUTICAL INGREDIENTS MARKET, BY MANUFACTURING PROCESS,
2020–2027 (USD MILLION) 108
TABLE 162 MIDDLE EAST AND AFRICA ACTIVE PHARMACEUTICAL INGREDIENTS MARKET BY TYPE OF SYNTHESIS,
2020–2027 (USD MILLION) 108
TABLE 163 MIDDLE EAST AND AFRICA ACTIVE PHARMACEUTICAL INGREDIENTS MARKET, BY BIOTECH, 2020–2027 (USD MILLION) 108
TABLE 164 MIDDLE EAST AND AFRICA ACTIVE PHARMACEUTICAL INGREDIENTS MARKET, BY API FORMULATION,
2020–2027 (USD MILLION) 109
TABLE 165 MIDDLE EAST AND AFRICA ACTIVE PHARMACEUTICAL INGREDIENTS MARKET, BY APPLICATION, 2020–2027 (USD MILLION) 109
TABLE 166 MIDDLE EAST AND AFRICA ACTIVE PHARMACEUTICAL INGREDIENTS MARKET, BY MOLECULE, 2020–2027 (USD MILLION) 109
TABLE 167 MIDDLE EAST ACTIVE PHARMACEUTICAL INGREDIENTS MARKET, BY MANUFACTURING PROCESS, 2020–2027 (USD MILLION) 110
TABLE 168 MIDDLE EAST ACTIVE PHARMACEUTICAL INGREDIENTS MARKET BY TYPE OF SYNTHESIS, 2020–2027 (USD MILLION) 110
TABLE 169 MIDDLE EAST ACTIVE PHARMACEUTICAL INGREDIENTS MARKET, BY BIOTECH, 2020–2027 (USD MILLION) 110
TABLE 170 MIDDLE EAST ACTIVE PHARMACEUTICAL INGREDIENTS MARKET, BY API FORMULATION, 2020–2027 (USD MILLION) 110
TABLE 171 MIDDLE EAST ACTIVE PHARMACEUTICAL INGREDIENTS MARKET, BY APPLICATION, 2020–2027 (USD MILLION) 111
TABLE 172 MIDDLE EAST ACTIVE PHARMACEUTICAL INGREDIENTS MARKET, BY MOLECULE, 2020–2027 (USD MILLION) 111
TABLE 173 SAUDI ARABIA ACTIVE PHARMACEUTICAL INGREDIENTS MARKET, BY CONSUMPTION, 2020–2027 (USD MILLION) 111
TABLE 174 SAUDI ARABIA ACTIVE PHARMACEUTICAL INGREDIENTS IMPORT/EXPORT, 2020–2027 (USD MILLION) 111
TABLE 175 SAUDI ARABIA ACTIVE PHARMACEUTICAL INGREDIENTS CONSUMPTION MARKET BY TYPE OF SYNTHESIS,
2020–2027 (USD MILLION) 112
TABLE 176 SAUDI ARABIA ACTIVE PHARMACEUTICAL INGREDIENTS CONSUMPTION MARKET, BY BIOTECH, 2020–2027 (USD MILLION) 112
TABLE 177 SAUDI ARABIA ACTIVE PHARMACEUTICAL INGREDIENTS CONSUMPTION MARKET, BY API FORMULATION,
2020–2027 (USD MILLION) 112
TABLE 178 SAUDI ARABIA ACTIVE PHARMACEUTICAL INGREDIENTS CONSUMPTION MARKET, BY APPLICATION,
2020–2027 (USD MILLION) 113
TABLE 179 SAUDI ARABIA ACTIVE PHARMACEUTICAL INGREDIENTS CONSUMPTION MARKET, BY MOLECULE, 2020–2027 (USD MILLION) 113
TABLE 180 SAUDI ARABIA ACTIVE PHARMACEUTICAL INGREDIENTS MARKET, BY MANUFACTURING PROCESS, 2020–2027 (USD MILLION) 113
TABLE 181 AFRICA ACTIVE PHARMACEUTICAL INGREDIENTS MARKET, BY MANUFACTURING PROCESS, 2020–2027 (USD MILLION) 114
TABLE 182 AFRICA ACTIVE PHARMACEUTICAL INGREDIENTS MARKET BY TYPE OF SYNTHESIS, 2020–2027 (USD MILLION) 114
TABLE 183 AFRICA ACTIVE PHARMACEUTICAL INGREDIENTS MARKET, BY BIOTECH, 2020–2027 (USD MILLION) 114
TABLE 184 AFRICA ACTIVE PHARMACEUTICAL INGREDIENTS MARKET, BY API FORMULATION, 2020–2027 (USD MILLION) 114
TABLE 185 AFRICA ACTIVE PHARMACEUTICAL INGREDIENTS MARKET, BY APPLICATION, 2020–2027 (USD MILLION) 115
TABLE 186 AFRICA ACTIVE PHARMACEUTICAL INGREDIENTS MARKET, BY MOLECULE, 2020–2027 (USD MILLION) 115
TABLE 187 NORTH AFRICA ACTIVE PHARMACEUTICAL INGREDIENTS MARKET, BY MANUFACTURING PROCESS,
2020–2027 (USD MILLION) 116
TABLE 188 NORTH AFRICA ACTIVE PHARMACEUTICAL INGREDIENTS MARKET BY TYPE OF SYNTHESIS, 2020–2027 (USD MILLION) 116
TABLE 189 NORTH AFRICA ACTIVE PHARMACEUTICAL INGREDIENTS MARKET, BY BIOTECH, 2020–2027 (USD MILLION) 116
TABLE 190 NORTH AFRICA ACTIVE PHARMACEUTICAL INGREDIENTS MARKET, BY API FORMULATION, 2020–2027 (USD MILLION) 116
TABLE 191 NORTH AFRICA ACTIVE PHARMACEUTICAL INGREDIENTS MARKET, BY APPLICATION, 2020–2027 (USD MILLION) 117
TABLE 192 NORTH AFRICA ACTIVE PHARMACEUTICAL INGREDIENTS MARKET, BY MOLECULE, 2020–2027 (USD MILLION) 117
TABLE 193 GLOBAL ACTIVE PHARMACEUTICAL INGREDIENTS MARKET: KEY DEVELOPMENT 122
TABLE 194 GLOBAL ACTIVE PHARMACEUTICAL INGREDIENTS MARKET: POTENTIAL MOLECULES 126
17 List Of Figures
FIGURE 1 GLOBAL ACTIVE PHARMACEUTICAL INGREDIENT MARKET: MARKET STRUCTURE 21
FIGURE 2 RESEARCH PROCESS OF MRFR 23
FIGURE 3 TOP-DOWN AND BOTTOM-UP APPROACH 26
FIGURE 4 DRIVERS & RESTRAINTS: GLOBAL ACTIVE PHARMACEUTICAL INGREDIENTS MARKET 28
FIGURE 5 PORTER’S FIVE FORCES ANALYSIS: GLOBAL ACTIVE PHARMACEUTICAL INGREDIENTS (API) MARKET 33
FIGURE 6 SUPPLY CHAIN: ACTIVE PHARMACEUTICAL INGREDIENTS (API) MARKET 35
FIGURE 7 GLOBAL ACTIVE PHARMACEUTICAL INGREDIENTS MARKET, BY MANUFACTURING PROCESS, 2020 (% SHARE) 39
FIGURE 8 GLOBAL ACTIVE PHARMACEUTICAL INGREDIENTS MARKET, BY MANUFACTURING PROCESS, 2020 & 2027 (USD MILLION) 39
FIGURE 9 GLOBAL ACTIVE PHARMACEUTICAL INGREDIENTS MARKET, BY TYPE OF SYNTHESIS 2020 (% SHARE) 42
FIGURE 10 GLOBAL ACTIVE PHARMACEUTICAL INGREDIENTS MARKET, BY TYPE OF SYNTHESIS, 2020 & 2027 (USD MILLION) 43
FIGURE 11 GLOBAL ACTIVE PHARMACEUTICAL INGREDIENTS MARKET, BY API FORMULATION 2020 (% SHARE) 47
FIGURE 12 GLOBAL ACTIVE PHARMACEUTICAL INGREDIENTS MARKET, BY API FORMULATION, 2020 & 2027 (USD MILLION) 48
FIGURE 13 GLOBAL ACTIVE PHARMACEUTICAL INGREDIENTS MARKET, BY APPLICATION 2020 (% SHARE) 52
FIGURE 14 GLOBAL ACTIVE PHARMACEUTICAL INGREDIENTS MARKET, BY APPLICATION, 2020 TO 2027 (USD MILLION) 53
FIGURE 15 GLOBAL ACTIVE PHARMACEUTICAL INGREDIENTS MARKET, BY MOLECULE 2020 (% SHARE) 58
FIGURE 16 GLOBAL ACTIVE PHARMACEUTICAL INGREDIENTS MARKET, BY MOLECULE, 2020 TO 2027 (USD MILLION) 59
FIGURE 17 GLOBAL ACTIVE PHARMACEUTICAL INGREDIENTS MARKET, BY REGION, 2020 & 2027 (USD MILLION) 61
FIGURE 18 AMERICAS ACTIVE PHARMACEUTICAL INGREDIENTS MARKET, BY REGION, 2020 (%) 62
FIGURE 19 NORTH AMERICA: ACTIVE PHARMACEUTICAL INGREDIENTS MARKET SHARE, BY COUNTRY, 2020 (% SHARE) 65
FIGURE 20 EUROPE ACTIVE PHARMACEUTICAL INGREDIENTS MARKET, BY COUNTRY, 2020 (%) 74
FIGURE 21 ASIA-PACIFIC ACTIVE PHARMACEUTICAL INGREDIENTS MARKET, BY COUNTRY, 2020 (%) 93
FIGURE 22 MIDDLE EAST & AFRICA ACTIVE PHARMACEUTICAL INGREDIENTS MARKET, BY COUNTRY, 2020 (%) 107
FIGURE 23 GLOBAL ACTIVE PHARMACEUTICAL INGREDIENTS MARKET, MARKET SHARE ANALYSIS 2020 (%) 120
FIGURE 24 GLOBAL ACTIVE PHARMACEUTICAL INGREDIENTS MARKET COMPETITIVE LANDSCAPE (%) 122
$312 Billion
6.2%
North America
2021-2028
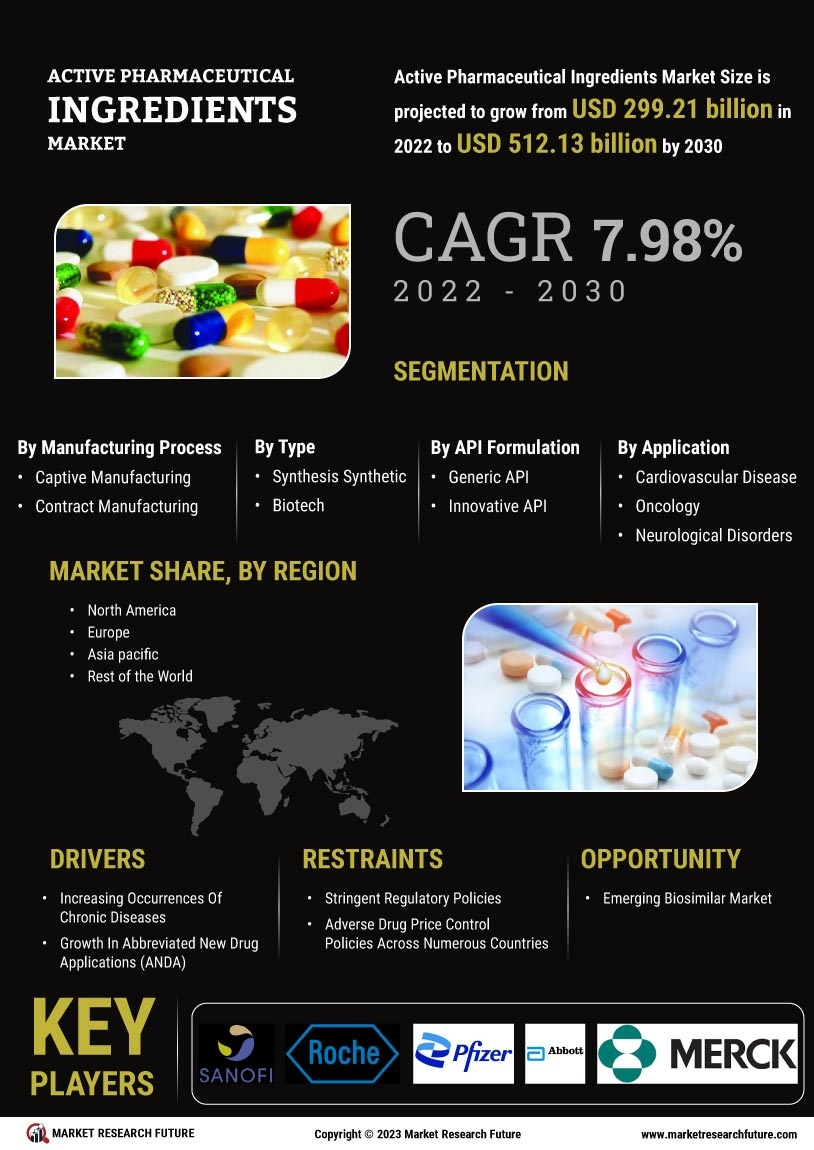
Active Pharmaceutical Ingredient Market size is anticipated to disclose a 6.2% CAGR and touch USD 312 Billion by 2028. The active pharmaceutical ingredients share price has risen incrementally over the past few years due to medicinal properties. The drugs taken together with combined therapy have numerous active ingredients to treat a range of disorders. The various types of active pharmaceutical ingredients are prime elements in the production of drugs, and this global market is estimated to experience optimistic growth in the upcoming period.
COVID-19 Analysis of Active Pharmaceutical Ingredient Market
The surge in COVID-19 cases globally has played an intrinsic role in active pharmaceutical ingredient manufacturers' development through the forecast period. In India's active pharmaceutical ingredient market, the administration has completed a molecule-by-molecule charting of active pharmaceutical ingredients (APIs) imported from China to elevate domestic construction and imports from third party suppliers in sight of the supply chain interruptions because of the COVID-19 pandemic. The administration is also organizing special provisions for APIs that still require to be sourced from China.
The COVID-19 pandemic has added a further hurdle as governments globally decided to boycott APIs manufactured in China. The COVID-19 contagion put a constraint on the manufacture and the supply chain of several strategic pharmaceutical companies. The global reliance on China for APIs for various biologics and generic drugs is estimated to exert a considerable pull on the global active pharmaceutical ingredient business model. Approximately 44 businesses were considered invalid during the pandemic lockdown restrictions put by the Chinese government. This trend has contributed mainly to nations rolling out native API production programs after reassessing their healthcare models to treat the virus and guarantee a steady inflow of API manufacture. Consequently, well-known pharmaceutical companies are altering their business standards based on key performance indicators.
Drivers
Raised Incidences Of Chronic Diseases
The increasing occurrences of chronic diseases have risen significantly in the past few years due to increased exposure to risk factors and better detection of the ailments at their initial stages.
Upsurge In Novel Drug Applications
The progress in reduced new drug applications (ANDA) is showing a sudden spike due to improved funding into the R & D aspect for treatment of the disease.
Promotion In The Biopharmaceutical Outlook
The intensifying approval of biopharmaceuticals is estimated to play out in favor of the active pharmaceutical ingredient industry in the coming period. The community's healthcare expenses and the present COVID-19 pandemic have led pharmaceutical producers to rearrange their capabilities to cater to a large patient pool.
Opportunities
Advancement In Generics
The developing status of generics in the global active pharmaceutical ingredient market is projected to augment the active pharmaceutical ingredients market growth. Also, the diminishing number of novel drugs in the pharmaceutical industry is estimated to add to the product development's active pharmaceutical ingredients in the upcoming period.
Restraints
Regulatory Drawbacks
The rigorous supervisory strategies and hostile drug price control strategies throughout several countries are expected to limit the growth of the active pharmaceutical ingredients' companies. A shift to digital manufacturing and patents for blockbuster drugs is estimated to lower the market's development.
By Manufacturing Process
The contract manufacturing segment is estimated to enhance the active pharmaceutical ingredients market share.
Based On Type Of Synthesis
The biotech segment is foreseen to display promising growth in the duration of the forecast period.
Based On API Formulation
The generic API and branded/ innovative API segments are estimated to show notable progress in the forecast period.
Based on Application
The cardiovascular disease oncology and neurological disorders segment is estimated to perform extraordinarily in the upcoming period.
Based On Molecule
The small molecule is estimated to enhance the active pharmaceutical ingredients market share in the forecast period.
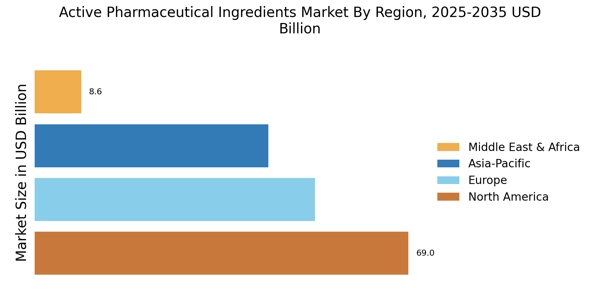
The Americas active pharmaceutical ingredient market is anticipated to hold the principal portion of the global market. The North America active pharmaceutical ingredients market governs the global active pharmaceutical ingredients market due to the increasing technological progress in diagnostics linked with the growing occurrences of chronic diseases and other neurological conditions.
The European regional active pharmaceutical ingredient market is projected to account for a second principal market portion through the forecast period. Many CMOs present in manufacturing of APIs and the mounting need to advance generic drugs are likely to spur the market.
The Asia Pacific active pharmaceutical ingredient market is evaluated to be the fastest encouraging region in the global active pharmaceutical ingredient market due to the commonness of quickly emerging markets such as India, China, and South Korea that are developing as main hubs for outsourcing drug manufacturing. Japan is estimated to advance the Asia Pacific active pharmaceutical ingredient market primarily.
The Middle Eastern & African active pharmaceutical ingredients market is anticipated to intensify due to the escalate emerging healthcare infrastructure and growing demand for healthcare products.
Active Pharmaceutical Ingredient Market Competitive Landscape
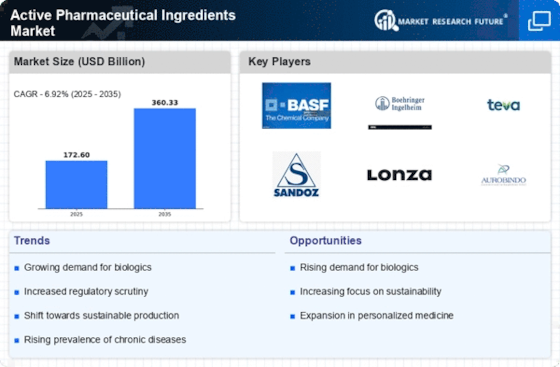
The noticeable companies in the active pharmaceutical ingredients market are
The companies functioning in the global market are expanding their presence by strategic collaborations to increase production capacities and amass a bigger market share in the forecast period.
Recent Developments
Report Overview
Report Attribute/Metric | Details |
---|---|
Market Size | 2028: USD 312 Billion |
CAGR | 6.6% (2021-2028) |
Base Year | 2019 |
Forecast Period | 2028 |
Historical Data | 2018 |
Forecast Units | Value (USD Billion) |
Report Coverage | Revenue Forecast, Competitive Landscape, Growth Factors, and Trends |
Segments Covered | By Manufacturing Process, Type of Synthesis, API Formulation, Application, Molecule, Region |
Geographies Covered | North America, Europe, Asia-Pacific, and Rest of the World (RoW) |
Key Vendors | Sanofi SA (France), Hoffmann-La Roche Ltd (Switzerland), Pfizer Inc. (US), Abbott (US), Bayer AG(UK), Merck & Co., Inc (US), Boehringer Ingelheim GmbH (UK), GlaxoSmithKline Plc (UK), Novartis AG (UK), Eli Lilly and Company (US), Teva Pharmaceutical Industries Ltd (Israel) |
Key Market Opportunities | Advancement In Generics |
Key Market Drivers |
|
Frequently Asked Questions (FAQ) :
The active pharmaceutical ingredients market is projected to grow at a 6.2% CAGR between 2021-2028.
The Americas are predicted to command the highest share in the active pharmaceutical ingredients market.
The active pharmaceutical ingredients market is predicted to touch USD 312 Billion by 2028.
Rising prevalence of chronic diseases and rising importance of generics are boosting market growth.
Strict regulatory policies may impede market growth.
Active Pharmaceutical Ingredients or API, in short, are growing in an increscent manner due to the unmatched effects of active chemicals in the drugs and the portions that work on treating the condition. The bridging of foreign manufacturers and local distributors has led to extensive progress in the market over the past few years. The launch of innovative and improved APIs in the market will boost the market’s progress to a great extent in the forthcoming period. Moreover, the constantly growing demand for biotech API has stimulated the firms to present better and new products to address the unmet requirements of the market.
The outlook for growth in the economy is likely to perceive a sweeping rise in the API industry owing to the growing occurrence of chronic disorders such as diabetes, cardiovascular diseases, obesity and other infectious diseases which will lead to the launch of numerous innovative drugs. The rising cases of chronic diseases are also one of the foremost reasons for hospitalization with a huge number of patients with these conditions who may need re-admission in hospitals owing to an infection that can cause other chronic diseases. The expiration of patents of branded drugs has created a serious impression on drug manufacturers, as the companies can incur tremendous losses after expiration. Hence, the producers favor generic drugs over the branded ones. The generics are also expected to be the most rapidly growing type due to patent expirations of many blockbuster drugs.
However, the rapidly increasing scope for high-potency active pharmaceutical ingredients over the last decade has shifted the focus to the new biologics gold rush of recombinant proteins and monoclonal antibodies. As a result of this, the chemical API market for western contract manufacturers, on the whole, has undergone a sharp decline till 2015. Many custom manufacturing organizations (CMOs) have shifted their emphasis to rescheduling plants or manufacturing of higher-value biologics.
Segmental Analysis
The segmental analysis of the market is based on the segments of the manufacturing process, API formulation, application, type of synthesis, molecule, and region. The market segmentation by type of synthesis consists of biotech and synthetic segments. The synthetic segment in 2017 was worth USD 132,690.7 Mn. The manufacturing process based segmentation of the market comprises of contract manufacturing and captive manufacturing. The captive manufacturing segment presently has the significant market share and is expected to remain extremely lucrative throughout the assessment period. The API formulation segments the market into innovative API and generic API. The generic API segment presently held the leading market share in 2017. The segmentation based on molecule has been segmented into small molecule and large molecule. The small molecule segment is expected to maintain its top position till the end of 2028. The application based segmentation of the market has been segmented into oncology, cardiovascular disease, orthopedic disorders, neurological disorders, respiratory, urology, gastrointestinal disorders and others. The oncology segment is anticipated to develop with an incremental CAGR during the forecast period.
Regional Analysis
The market for APIs has been segmented into Europe, Americas, Asia Pacific (APAC), and the Middle East & Africa (MEA). The Americas region presently controls the significant market portion, and the trend will probably carry on in the foreseeable future. This factor is majorly related to the robust value sustained by the small molecule segment in both Canada and the U.S. Additionally the pharmaceutical industry is among one of the major and most exceptional ventures in the US nations. The pharmaceutical organizations in the USA have developed quickly in comparison with other countries. The European and Asia Pacific region are also anticipated to continue growth in the revenue pockets for the active pharmaceutical ingredients (API) market during the forecast period. Europe accounts for the second largest market for active pharmaceutical ingredients which is followed by the Asia Pacific region. While the APAC region, the market’s course is mostly directed by factors such as the amplified level of expense on equipment and infrastructure, expanding initiatives which are motivating investment in APIs from drug makers to increase the capacity to produce APIs.
Competitive Analysis
The players and key trends have created a positive tone for development. The competitors in the market are also leveraging their competitive benefits to secure their development in the market. The market progress by competitors also encompasses strong risk management strategies which are positively motivating the expansion of the market.
Bayer AG, Eli Lilly and Company, Pfizer Inc., F. Hoffmann-La Roche AG, Sanofi, Boehringer Ingelheim GmbH, Abbott Laboratories, GlaxoSmithKline Plc (GSK), Novartis AG, Merck & Co., Inc., and Teva Pharmaceutical Industries Ltd.