Table of Contents
1 Executive Summary
2 Market Introduction
2.1 Market Definition
2.2 Scope of the Study
2.3 Market Structure
3 Research Methodology
3.1 Primary Research
3.2 Secondary Research
3.3 Market Capacity Estimation
3.4 Forecast Model
3.5 List of Assumptions
3.6 Limitations of the Study
4 Market Insights
5 Market Dynamics
5.1 Introduction
5.2 Market Drivers
5.3 Market Restraints
5.4 Market Opportunities
5.5 Porter’s Five Forces Analysis
5.5.1 Threat of New Entrants
5.5.2 Bargaining Power of Buyers
5.5.3 Bargaining Power of Suppliers
5.5.4 Threat of Substitutes
5.5.5 Intensity of Rivalry
5.6 Value Chain/Supply Chain Analysis
6 Global Portable Power Station Market, by Operation Type
6.1 Introduction
6.2 Direct Power
6.2.1 Market Estimates & Forecast, 2020–2027
6.2.2 Market Estimates & Forecast, by Region, 2020–2027
6.3 Solar Power
6.3.1 Market Estimates & Forecast, 2020–2027
6.3.2 Market Estimates & Forecast, by Region, 2020–2027
7 Global Portable Power Station Market, by Application
7.1 Introduction
7.2 Emergency Power
7.2.1 Market Estimates & Forecast, 2020–2027
7.2.2 Market Estimates & Forecast, by Region, 2020–2027
7.3 Off-Grid Power
7.3.1 Market Estimates & Forecast, 2020–2027
7.3.2 Market Estimates & Forecast, by Region, 2020–2027
7.4 Automotive
7.4.1 Market Estimates & Forecast, 2020–2027
7.4.2 Market Estimates & Forecast, by Region, 2020–2027
8 Global Portable Power Station Market, by Capacity Type
8.1 Introduction
8.2 Less than 500 WH
8.2.1 Market Estimates & Forecast, 2020–2027
8.2.2 Market Estimates & Forecast, by Region, 2020–2027
8.3 500 WH to 999 WH
8.3.1 Market Estimates & Forecast, 2020–2027
8.3.2 Market Estimates & Forecast, by Region, 2020–2027
8.4 1000 WH to 1499 WH
8.4.1 Market Estimates & Forecast, 2020–2027
8.4.2 Market Estimates & Forecast, by Region, 2020–2027
8.5 1500 WH and Above
8.5.1 Market Estimates & Forecast, 2020–2027
8.5.2 Market Estimates & Forecast, by Region, 2020–2027
9 Global Portable Power Station Market, by Technology Type
9.1 Introduction
9.2 Lithium-Ion
9.2.1 Market Estimates & Forecast, 2020–2027
9.2.2 Market Estimates & Forecast, by Region, 2020–2027
9.3 Sealed Lead-Acid
9.3.1 Market Estimates & Forecast, 2020–2027
9.3.2 Market Estimates & Forecast, by Region, 2020–2027
10 Global Portable Power Station Market, by Region
10.1 Introduction
10.2 North America
10.2.1 Market Estimates & Forecast, by Operation Type, 2020–2027
10.2.2 Market Estimates & Forecast, by Application, 2020–2027
10.2.3 Market Estimates & Forecast, by Capacity Type, 2020–2027
10.2.4 Market Estimates & Forecast, by Technology Type, 2020–2027
10.2.5 Market Estimates & Forecast, by Country, 2020–2027
10.2.6 US
10.2.6.1 Market Estimates & Forecast, by Operation Type, 2020–2027
10.2.6.2 Market Estimates & Forecast, by Application, 2020–2027
10.2.6.3 Market Estimates & Forecast, by Capacity Type, 2020–2027
10.2.6.4 Market Estimates & Forecast, by Technology Type, 2020–2027
10.2.7 Canada
10.2.7.1 Market Estimates & Forecast, by Operation Type, 2020–2027
10.2.7.2 Market Estimates & Forecast, by Application, 2020–2027
10.2.7.3 Market Estimates & Forecast, by Capacity Type, 2020–2027
10.2.7.4 Market Estimates & Forecast, by Technology Type, 2020–2027
10.2.8 Mexico
10.2.8.1 Market Estimates & Forecast, by Operation Type, 2020–2027
10.2.8.2 Market Estimates & Forecast, by Application, 2020–2027
10.2.8.3 Market Estimates & Forecast, by Capacity Type, 2020–2027
10.2.8.4 Market Estimates & Forecast, by Technology Type, 2020–2027
10.3 Europe
10.3.1 Market Estimates & Forecast, by Operation Type, 2020–2027
10.3.2 Market Estimates & Forecast, by Application, 2020–2027
10.3.3 Market Estimates & Forecast, by Capacity Type, 2020–2027
10.3.4 Market Estimates & Forecast, by Technology Type, 2020–2027
10.3.5 Market Estimates & Forecast, by Country, 2020–2027
10.3.6 Germany
10.3.6.1 Market Estimates & Forecast, by Operation Type, 2020–2027
10.3.6.2 Market Estimates & Forecast, by Application, 2020–2027
10.3.6.3 Market Estimates & Forecast, by Capacity Type, 2020–2027
10.3.6.4 Market Estimates & Forecast, by Technology Type, 2020–2027
10.3.7 UK
10.3.7.1 Market Estimates & Forecast, by Operation Type, 2020–2027
10.3.7.2 Market Estimates & Forecast, by Application, 2020–2027
10.3.7.3 Market Estimates & Forecast, by Capacity Type, 2020–2027
10.3.7.4 Market Estimates & Forecast, by Technology Type, 2020–2027
10.3.8 Russia
10.3.8.1 Market Estimates & Forecast, by Operation Type, 2020–2027
10.3.8.2 Market Estimates & Forecast, by Application, 2020–2027
10.3.8.3 Market Estimates & Forecast, by Capacity Type, 2020–2027
10.3.8.4 Market Estimates & Forecast, by Technology Type, 2020–2027
10.3.9 Rest of Europe
10.3.9.1 Market Estimates & Forecast, by Operation Type, 2020–2027
10.3.9.2 Market Estimates & Forecast, by Application, 2020–2027
10.3.9.3 Market Estimates & Forecast, by Capacity Type, 2020–2027
10.3.9.4 Market Estimates & Forecast, by Technology Type, 2020–2027
10.4 Asia-Pacific
10.4.1 Market Estimates & Forecast, by Operation Type, 2020–2027
10.4.2 Market Estimates & Forecast, by Application, 2020–2027
10.4.2.1 Market Estimates & Forecast, by Capacity Type, 2020–2027
10.4.2.2 Market Estimates & Forecast, by Technology Type, 2020–2027
10.4.3 Market Estimates & Forecast, by Country, 2020–2027
10.4.4 China
10.4.4.1 Market Estimates & Forecast, by Operation Type, 2020–2027
10.4.4.2 Market Estimates & Forecast, by Application, 2020–2027
10.4.4.3 Market Estimates & Forecast, by Capacity Type, 2020–2027
10.4.4.4 Market Estimates & Forecast, by Technology Type, 2020–2027
10.4.5 Japan
10.4.5.1 Market Estimates & Forecast, by Operation Type, 2020–2027
10.4.5.2 Market Estimates & Forecast, by Application, 2020–2027
10.4.5.3 Market Estimates & Forecast, by Capacity Type, 2020–2027
10.4.5.4 Market Estimates & Forecast, by Technology Type, 2020–2027
10.4.6 South Korea
10.4.6.1 Market Estimates & Forecast, by Operation Type, 2020–2027
10.4.6.2 Market Estimates & Forecast, by Application, 2020–2027
10.4.6.3 Market Estimates & Forecast, by Capacity Type, 2020–2027
10.4.6.4 Market Estimates & Forecast, by Technology Type, 2020–2027
10.4.7 Rest of Asia-Pacific
10.4.7.1 Market Estimates & Forecast, by Operation Type, 2020–2027
10.4.7.2 Market Estimates & Forecast, by Application, 2020–2027
10.4.7.3 Market Estimates & Forecast, by Capacity Type, 2020–2027
10.4.7.4 Market Estimates & Forecast, by Technology Type, 2020–2027
10.5 Middle East & Africa
10.5.1 Market Estimates & Forecast, by Operation Type, 2020–2027
10.5.2 Market Estimates & Forecast, by Application, 2020–2027
10.5.2.1 Market Estimates & Forecast, by Capacity Type, 2020–2027
10.5.2.2 Market Estimates & Forecast, by Technology Type, 2020–2027
10.5.3 Market Estimates & Forecast, by Country, 2020–2027
10.5.4 Saudi Arabia
10.5.4.1 Market Estimates & Forecast, by Operation Type, 2020–2027
10.5.4.2 Market Estimates & Forecast, by Application, 2020–2027
10.5.4.3 Market Estimates & Forecast, by Capacity Type, 2020–2027
10.5.4.4 Market Estimates & Forecast, by Technology Type, 2020–2027
10.5.5 UAE
10.5.5.1 Market Estimates & Forecast, by Operation Type, 2020–2027
10.5.5.2 Market Estimates & Forecast, by Application, 2020–2027
10.5.5.3 Market Estimates & Forecast, by Capacity Type, 2020–2027
10.5.5.4 Market Estimates & Forecast, by Technology Type, 2020–2027
10.5.6 South Africa
10.5.6.1 Market Estimates & Forecast, by Operation Type, 2020–2027
10.5.6.2 Market Estimates & Forecast, by Application, 2020–2027
10.5.6.3 Market Estimates & Forecast, by Capacity Type, 2020–2027
10.5.6.4 Market Estimates & Forecast, by Technology Type, 2020–2027
10.5.7 Rest of Middle East & Africa
10.5.7.1 Market Estimates & Forecast, by Operation Type, 2020–2027
10.5.7.2 Market Estimates & Forecast, by Application, 2020–2027
10.5.7.3 Market Estimates & Forecast, by Capacity Type, 2020–2027
10.5.7.4 Market Estimates & Forecast, by Technology Type, 2020–2027
10.6 South America
10.6.1 Market Estimates & Forecast, by Operation Type, 2020–2027
10.6.2 Market Estimates & Forecast, by Application, 2020–2027
10.6.3 Market Estimates & Forecast, by Capacity Type, 2020–2027
10.6.4 Market Estimates & Forecast, by Technology Type, 2020–2027
10.6.5 Market Estimates & Forecast, by Country, 2020–2027
10.6.6 Argentina
10.6.6.1 Market Estimates & Forecast, by Operation Type, 2020–2027
10.6.6.2 Market Estimates & Forecast, by Application, 2020–2027
10.6.6.3 Market Estimates & Forecast, by Capacity Type, 2020–2027
10.6.6.4 Market Estimates & Forecast, by Technology Type, 2020–2027
10.6.7 Brazil
10.6.7.1 Market Estimates & Forecast, by Operation Type, 2020–2027
10.6.7.2 Market Estimates & Forecast, by Application, 2020–2027
10.6.7.3 Market Estimates & Forecast, by Capacity Type, 2020–2027
10.6.7.4 Market Estimates & Forecast, by Technology Type, 2020–2027
10.6.8 Rest of South America
10.6.8.1 Market Estimates & Forecast, by Operation Type, 2020–2027
10.6.8.2 Market Estimates & Forecast, by Application, 2020–2027
10.6.8.3 Market Estimates & Forecast, by Capacity Type, 2020–2027
10.6.8.4 Market Estimates & Forecast, by Technology Type, 2020–2027
11 Competitive Landscape
11.1 Competitive Scenario
11.2 Competitive Benchmarking of the Global Portable Power Station Market
11.3 Major Growth Key Strategies in the Global Portable Power Station Market
11.4 Market Share Analysis: Global Portable Power Station Market
11.5 XX: The Leading Player in Terms of Number of Developments in the Global Portable Power Station Market
11.6 Operation Type Development in Global Portable Power Station Market
11.7 Mergers and Acquisitions in Global Portable Power Station Market
11.8 Contracts and Agreements in Global Portable Power Station Market
11.9 Expansions and Investments in Global Portable Power Station Market
12 Company Profile
12.1 Goal Zero (US)
12.1.1 Company Overview
12.1.2 Operation Types/Services Offered
12.1.3 Financial Overview
12.1.4 Key Developments
12.1.5 Key Strategies
12.1.6 SWOT Analysis
12.2 Jackery (US)
12.2.1 Company Overview
12.2.2 Operation Types/Services Offered
12.2.3 Financial Overview
12.2.4 Key Developments
12.2.5 Key Strategies
12.2.6 SWOT Analysis
12.3 Lion Energy (US)
12.3.1 Company Overview
12.3.2 Operation Types/Services Offered
12.3.3 Financial Overview
12.3.4 Key Developments
12.3.5 Key Strategies
12.3.6 SWOT Analysis
12.4 EcoFlow (US)
12.4.1 Company Overview
12.4.2 Operation Types/Services Offered
12.4.3 Financial Overview
12.4.4 Key Developments
12.4.5 Key Strategies
12.4.6 SWOT Analysis
12.5 Li Power (Shenzhen) Technology (China)
12.5.1 Company Overview
12.5.2 Operation Types/Services Offered
12.5.3 Financial Overview
12.5.4 Key Developments
12.5.5 Key Strategies
12.5.6 SWOT Analysis
12.6 ChargeTech (US)
12.6.1 Company Overview
12.6.2 Operation Types/Services Offered
12.6.3 Financial Overview
12.6.4 Key Developments
12.6.5 Key Strategies
12.6.6 SWOT Analysis
12.7 Midland (US)
12.7.1 Company Overview
12.7.2 Operation Types/Services Offered
12.7.3 Financial Overview
12.7.4 Key Developments
12.7.5 Key Strategies
12.7.6 SWOT Analysis
12.8 Duracell (US)
12.8.1 Company Overview
12.8.2 Operation Types/Services Offered
12.8.3 Financial Overview
12.8.4 Key Developments
12.8.5 Key Strategies
12.8.6 SWOT Analysis
12.9 Drow Enterprise (China)
12.9.1 Company Overview
12.9.2 Operation Types/Services Offered
12.9.3 Financial Overview
12.9.4 Key Developments
12.9.5 Key Strategies
12.9.6 SWOT Analysis
12.10 Scott Electric (US)
12.10.1 Company Overview
12.10.2 Operation Types/Services Offered
12.10.3 Financial Overview
12.10.4 Key Developments
12.10.5 Key Strategies
12.10.6 SWOT Analysis
12.11 Suaoki (Japan)
12.11.1 Company Overview
12.11.2 Operation Types/Services Offered
12.11.3 Financial Overview
12.11.4 Key Developments
12.11.5 Key Strategies
12.11.6 SWOT Analysis
12.12 Milwaukee Electric Tool (US)
12.12.1 Company Overview
12.12.2 Operation Types/Services Offered
12.12.3 Financial Overview
12.12.4 Key Developments
12.12.5 Key Strategies
12.12.6 SWOT Analysis
List of Tables
Table 1 Global Portable Power Station Market, by Region, 2020–2027 (USD Million)
Table 2 North America Portable Power Station Market, by Country, 2020–2027 (USD Million)
Table 3 Europe Portable Power Station Market, by Country, 2020–2027 (USD Million)
Table 4 Asia-Pacific Portable Power Station Market, by Country, 2020–2027 (USD Million)
Table 5 Middle East & Africa Portable Power Station Market, by Country, 2020–2027 (USD Million)
Table 6 South America Portable Power Station Market, by Country, 2020–2027 (USD Million)
Table 7 Global Portable Power Station Market, by Operation Type, 2020–2027 (USD Million)
Table 8 North America Portable Power Station Market, by Operation Type, 2020–2027 (USD Million)
Table 9 Europe Portable Power Station Market, by Operation Type, 2020–2027 (USD Million)
Table 10 Asia-Pacific Portable Power Station Market, by Operation Type, 2020–2027 (USD Million)
Table 11 Middle East & Africa Portable Power Station Market, by Operation Type, 2020–2027 (USD Million)
Table 12 South America Portable Power Station Market, by Operation Type, 2020–2027 (USD Million)
Table 13 Global Portable Power Station Market, by Application, 2020–2027 (USD Million)
Table 14 North America Portable Power Station Market, by Application, 2020–2027 (USD Million)
Table 15 Europe Portable Power Station Market, by Application, 2020–2027 (USD Million)
Table 16 Asia-Pacific Portable Power Station Market, by Application, 2020–2027 (USD Million)
Table 17 Middle East & Africa Portable Power Station Market, by Application, 2020–2027 (USD Million)
Table 18 South America Portable Power Station Market, by Application, 2020–2027 (USD Million)
Table 19 Global Portable Power Station Market, by Capacity Type, 2020–2027 (USD Million)
Table 20 North America Portable Power Station Market, by Capacity Type, 2020–2027 (USD Million)
Table 21 Europe Portable Power Station Market, by Capacity Type, 2020–2027 (USD Million)
Table 22 Asia-Pacific Portable Power Station Market, by Capacity Type, 2020–2027 (USD Million)
Table 23 Middle East & Africa Portable Power Station Market, by Capacity Type, 2020–2027 (USD Million)
Table 24 South America Portable Power Station Market, by Capacity Type, 2020–2027 (USD Million)
Table 19 Global Portable Power Station Market, by Technology Type, 2020–2027 (USD Million)
Table 20 North America Portable Power Station Market, by Technology Type, 2020–2027 (USD Million)
Table 21 Europe Portable Power Station Market, by Technology Type, 2020–2027 (USD Million)
Table 22 Asia-Pacific Portable Power Station Market, by Technology Type, 2020–2027 (USD Million)
Table 23 Middle East & Africa Portable Power Station Market, by Technology Type, 2020–2027 (USD Million)
Table 24 South America Portable Power Station Market, by Technology Type, 2020–2027 (USD Million)
Table 25 Global Portable Power Station Market: by Region, 2020–2027 (USD Million)
Table 26 North America Portable Power Station Market, by Country, 2020–2027 (USD Million)
Table 27 North America Portable Power Station Market, by Operation Type, 2020–2027 (USD Million)
Table 28 North America Portable Power Station Market, by Application, 2020–2027 (USD Million)
Table 28 North America Portable Power Station Market, by Capacity Type, 2020–2027 (USD Million)
Table 28 North America Portable Power Station Market, by Technology Type, 2020–2027 (USD Million)
Table 30 US Portable Power Station Market, by Operation Type, 2020–2027 (USD Million)
Table 31 US Portable Power Station Market, by Application, 2020–2027 (USD Million)
Table 32 Canada Portable Power Station Market, by Operation Type, 2020–2027 (USD Million)
Table 33 Canada Portable Power Station Market, by Application, 2020–2027 (USD Million)
Table 34 Mexico Portable Power Station Market, by Operation Type, 2020–2027 (USD Million)
Table 35 Mexico Portable Power Station Market, by Application, 2020–2027 (USD Million)
Table 36 Europe Portable Power Station Market, by Country, 2020–2027 (USD Million)
Table 37 Europe Portable Power Station Market, by Operation Type, 2020–2027 (USD Million)
Table 38 Europe Portable Power Station Market, by Application, 2020–2027 (USD Million)
Table 39 Europe Portable Power Station Market, by Capacity Type, 2020–2027 (USD Million)
Table 40 Germany Portable Power Station Market, by Operation Type, 2020–2027 (USD Million)
Table 41 Germany Portable Power Station Market, by Application, 2020–2027 (USD Million)
Table 42 Europe Portable Power Station Market, by Capacity Type, 2020–2027 (USD Million)
Table 43 UK Portable Power Station Market, by Operation Type, 2020–2027 (USD Million)
Table 44 UK Portable Power Station Market, by Application, 2020–2027 (USD Million)
Table 45 UK Portable Power Station Market, by Capacity Type, 2020–2027 (USD Million)
Table 46 Russia Portable Power Station Market, by Operation Type, 2020–2027 (USD Million)
Table 47 Russia Portable Power Station Market, by Application, 2020–2027 (USD Million)
Table 48 Russia Portable Power Station Market, by Capacity Type, 2020–2027 (USD Million)
Table 49 Rest of Europe Portable Power Station Market, by Operation Type, 2020–2027 (USD Million)
Table 50 Rest of Europe Portable Power Station Market, by Application, 2020–2027 (USD Million)
Table 51 Rest of Europe Portable Power Station Market, by Capacity Type, 2020–2027 (USD Million)
Table 52 Asia-Pacific Portable Power Station Market, by Country, 2020–2027 (USD Million)
Table 53 Asia-Pacific Portable Power Station Market, by Operation Type, 2020–2027 (USD Million)
Table 54 Asia-Pacific Portable Power Station Market, by Application, 2020–2027 (USD Million)
Table 55 Asia-Pacific Portable Power Station Market, by Capacity Type, 2020–2027 (USD Million)
Table 56 China Portable Power Station Market, by Operation Type, 2020–2027 (USD Million)
Table 57 China Portable Power Station Market, by Application, 2020–2027 (USD Million)
Table 58 China Portable Power Station Market, by Capacity Type, 2020–2027 (USD Million)
Table 59 Japan Portable Power Station Market, by Operation Type, 2020–2027 (USD Million)
Table 60 Japan Portable Power Station Market, by Application, 2020–2027 (USD Million)
Table 61 Japan Portable Power Station Market, by Capacity Type, 2020–2027 (USD Million)
Table 62 India Portable Power Station Market, by Operation Type, 2020–2027 (USD Million)
Table 63 India Portable Power Station Market, by Application, 2020–2027 (USD Million)
Table 64 India Portable Power Station Market, by Capacity Type, 2020–2027 (USD Million)
Table 65 Indonesia Portable Power Station Market, by Operation Type, 2020–2027 (USD Million)
Table 66 Indonesia Portable Power Station Market, by Application, 2020–2027 (USD Million)
Table 67 Indonesia Portable Power Station Market, by Capacity Type, 2020–2027 (USD Million)
Table 68 Rest of Asia-Pacific Portable Power Station Market, by Operation Type, 2020–2027 (USD Million)
Table 69 Rest of Asia-Pacific Portable Power Station Market, by Application, 2020–2027 (USD Million)
Table 70 Rest of Asia-Pacific Portable Power Station Market, by Capacity Type, 2020–2027 (USD Million)
Table 71 Middle East Portable Power Station Market, by Country, 2020–2027 (USD Million)
Table 72 Middle East Portable Power Station Market, by Operation Type, 2020–2027 (USD Million)
Table 73 Middle East Portable Power Station Market, by Application, 2020–2027 (USD Million)
Table 74 Middle East Portable Power Station Market, by Capacity Type, 2020–2027 (USD Million)
Table 75 Saudi Arabia Portable Power Station Market, by Operation Type, 2020–2027 (USD Million)
Table 76 Saudi Arabia Portable Power Station Market, by Application, 2020–2027 (USD Million)
Table 77 Saudi Arabia Portable Power Station Market, by Capacity Type, 2020–2027 (USD Million)
Table 78 UAE Portable Power Station Market, by Operation Type, 2020–2027 (USD Million)
Table 79 UAE Portable Power Station Market, by Application, 2020–2027 (USD Million)
Table 80 UAE Portable Power Station Market, by Capacity Type, 2020–2027 (USD Million)
Table 81 South Africa Portable Power Station Market, by Operation Type, 2020–2027 (USD Million)
Table 82 South Africa Portable Power Station Market, by Application, 2020–2027 (USD Million)
Table 83 South Africa Portable Power Station Market, by Capacity Type, 2020–2027 (USD Million)
Table 84 Rest of the Middle East & Africa Portable Power Station Market, by Operation Type, 2020–2027 (USD Million)
Table 85 Rest of the Middle East & Africa Portable Power Station Market, by Application, 2020–2027 (USD Million)
Table 86 Rest of the Middle East & Africa Portable Power Station Market, by Capacity Type, 2020–2027 (USD Million)
Table 87 South America Portable Power Station Market, by Country, 2020–2027 (USD Million)
Table 88 South America Portable Power Station Market, by Operation Type, 2020–2027 (USD Million)
Table 89 South America Portable Power Station Market, by Application, 2020–2027 (USD Million)
Table 90 South America Portable Power Station Market, by Capacity Type, 2020–2027 (USD Million)
Table 91 Brazil Portable Power Station Market, by Operation Type, 2020–2027 (USD Million)
Table 92 Brazil Portable Power Station Market, by Application, 2020–2027 (USD Million)
Table 93 Brazil Portable Power Station Market, by Capacity Type, 2020–2027 (USD Million)
Table 94 Argentina Portable Power Station Market, by Operation Type, 2020–2027 (USD Million)
Table 95 Argentina Portable Power Station Market, by Application, 2020–2027 (USD Million)
Table 96 Argentina Portable Power Station Market, by Capacity Type, 2020–2027 (USD Million)
Table 97 Rest of South America Portable Power Station Market, by Operation Type, 2020–2027 (USD Million)
Table 98 Rest of South America Portable Power Station Market, by Application, 2020–2027 (USD Million)
Table 99 Rest of South America Portable Power Station Market, by Capacity Type, 2020–2027 (USD Million)
List of Figures
Figure 1 Research Process of MRFR
Figure 2 Top-Down and Bottom-Up Approach
Figure 3 Market Dynamics
Figure 4 Impact Analysis: Market Drivers
Figure 5 Impact Analysis: Market Restraints
Figure 6 Porter’s Five Forces Analysis
Figure 7 Value Chain Analysis
Figure 8 Global Portable Power Station Market Share, by Operation Type, 2020 (%)
Figure 9 Global Portable Power Station Market, by Operation Type, 2020–2027 (USD Million)
Figure 10 Global Portable Power Station Market Share, by Application, 2020 (%)
Figure 11 Global Portable Power Station Market, by Application, 2020–2027 (USD Million)
Figure 12 Global Portable Power Station Market Share, by Capacity Type, 2020 (%)
Figure 13 Global Portable Power Station Market, by Capacity Type, 2020–2027 (USD Million)
Figure 14 North America Portable Power Station Market Share (%), 2020
Figure 15 North America Portable Power Station Market, by Country, 2020–2027 (USD Million)
Figure 16 Europe Portable Power Station Market Share (%), 2020
Figure 17 Europe Portable Power Station Market, by Country, 2020–2027 (USD Million)
Figure 18 Asia-Pacific Portable Power Station Market Share (%), 2020
Figure 19 Asia-Pacific Portable Power Station Market, by Country, 2020–2027 (USD Million)
Figure 20 Middle East & Africa Portable Power Station Market Share (%), 2020
Figure 21 Middle East & Africa Portable Power Station Market, by Country, 2020–2027 (USD Million)
Figure 22 South America Portable Power Station Market Share (%), 2020
Figure 23 South America Portable Power Station Market, by Country, 2020–2027 (USD Million)
$410 Million
8.14%
North America
2022-2028
広範なポータブル発電所市場分析に基づいて、市場の専門家は、2022年から2028年の間に市場が8.14%のCAGRで成長すると推定しています。市場の専門家は、ポータブル発電所業界の収益が2028年までに4億1000万に達すると予想しています。
多くの要因が世界のポータブル発電所の市場規模の成長を牽引しています。スマートフォンやスマートウォッチなどのガジェットの使用が急速に増加し、自動車、非常用電源、オフグリッド電源用の無停電電源装置の必要性が高まっているため、ポータブル発電所市場は今後数年間で一貫して成長するでしょう。
ポータブル発電所は、電力を捕獲し、貯蔵し、持続的に供給することによってエネルギーを供給するために使用されます。再生可能エネルギーをポータブル発電所に統合することは可能です。電気は、ポータブル発電所を使用してプラグアンドプレイ方式で供給されます。ポータブル発電所は余分なエネルギーを供給することができます。
COVID-19分析の発生は、ポータブル発電所市場に悪影響を及ぼしました。世界中のほとんどの国で厳格な封鎖措置が実施されました。厳しい旅行制限により、レクリエーション活動への投資は大幅に減少しました。ほとんどの人が自宅で最大限の時間を過ごしていたため、ポータブル発電所の必要性は急激に減少しました。
COVID-19の発生は、このセクターの原材料の入手可能性に影響を与えました。製造ユニットの一時的な閉鎖、労働力の利用不能、およびロジスティクスの問題により、ポータブル発電所市場は障害に直面しました。
パンデミック後の期間には、市場は上昇すると予想され、市場は予測された成長率で成長すると予想されます。
世界中で、スマート電子デバイスの使用が急増しています。これにより、ポータブル発電所の需要が高まっています。さらに、多くのアプリケーション分野で無停電電源の必要性が高まっているため、ポータブル発電所の需要も高まっています。
バッテリー対応のポータブル発電所を設置するためのより長い充電時間と高いコストは、ポータブル発電所業界の成長の主な制約です。
スマートグリッドサービスの利用の急速な急増、遠隔地での電力使用の増加、および再生可能エネルギー源への傾向は、予測期間中にポータブル発電所市場に機会を創出する主な要因です。
未開発地域での適切な設定の認識の欠如と利用できないことは、ポータブル発電所市場の将来の成長にとっての課題です。
ポータブル発電所の市場分析によると、このレポートは、市場が2028年までに8.14%のCAGRで成長すると予想されていることを示しています。このレポートによると、ポータブル発電所市場は、予測期間(2022〜2028)中に4億1000万米ドルの収益を達成する予定です。
有害ガスの悪影響、主要企業による多額の投資、高度な技術の採用、あらゆる種類の電子機器の使用の増加などに対する懸念の高まりは、世界中のポータブル発電所市場の成長を後押しする要因です。
世界中で都市化の割合が高いため、ポータブル発電所の需要が継続的に高まっています。使いやすさと幅広い用途により、ポータブル発電所市場は予測期間中にかなりの速度で成長すると予想されます。
世界のポータブル発電所市場は非常に大きいです。アプリケーション、使用される技術、操作タイプ、容量タイプ、および地域に基づいてセグメント化されます。
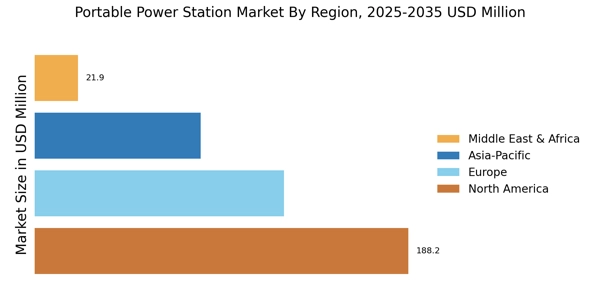
地域に基づいて、ポータブル発電所市場は北米、ヨーロッパ、アジア太平洋、南アメリカ、アフリカと中東に細分化されています。最大の市場シェアは北米地域によって占められています。この地域はほとんどのポータブル発電所メーカーの所在地であるためです。スマートフォンやその他のスマートガジェットの使用が一貫して増加していることが、市場の成長の原動力となっています。
ヨーロッパも非常に速い速度で成長しています。炭素排出量を抑制するための厳格な政府の取り組み、従来の電源の悪影響に対する意識の高まり、電子機器や電子機器の使用の増加により、ヨーロッパ地域のポータブル発電所市場は予測期間中に着実な成長を示すと予想されます。
世界のポータブル発電所市場は着実に成長しています。市場には次のような有名なプレーヤーがいます
主要企業のほとんどは、事業ポートフォリオを拡大するために、買収、新規契約、パートナーシップ、研究開発プロジェクトへの投資を行っています。たとえば、ジャッカリー(米国)とホンダ(日本)は、ポータブルソーラーユニットの発売契約に署名しました。
ポータブル発電所市場レポートの概要はこちらに記載されています。このレポートには、次の重要な点が含まれています。
ポータブル発電所市場レポートは、この市場のすべての重要な側面を示しています。
スマート電子機器の使用の増加、高い可処分所得、二酸化炭素排出量の削減に対する人々の意識の高まり、および厳格な政府の取り組みにより、ポータブル発電所市場は今後数年間で急速に成長すると予想されています。
ポータブル発電所市場の見通しは、市場の細分化、課題、成長機会、CAGR、主要プレーヤー、収益、市場の推進力、グローバルの課題などの情報を提供します
Report Attribute/Metric | Details |
---|---|
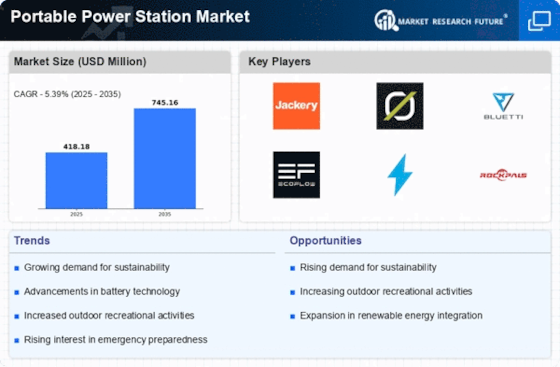
Market Size | 2030: USD 735.88 Million |
CAGR | 8.14% (2022-2030) |
Base Year | 2021 |
Forecast Period | 2022-2030 |
Historical Data | 2019 & 2020 |
Forecast Units | Value (USD Million) |
Report Coverage | Revenue Forecast, Competitive Landscape, Growth Factors, and Trends |
Segments Covered | Operation Type, Application and Capacity Type |
Geographies Covered | North America, Europe, Asia-Pacific, and Rest of the World (RoW) |
Key Vendors | Goal Zero (US), Jackery (US), Lion Energy (US), Ecoflow (US), Li Power (Shenzhen) Technology (China), ChargeTech (US), Midland (US), Duracell (US), Drow Enterprise (China), Scott Electric (US), Suaoki (Japan), and Milwaukee Electric Tool (US) |
Key Market Opportunities | longer charging times and the high cost of battery-powered portable power stations |
Key Market Drivers |
|
Frequently Asked Questions (FAQ) :
The portable power station global market is predicted to grow at a 8.14% CAGR between 2020- 2030.
The portable power station global market is predicted to reach USD 482 million by 2026.
North America will lead the global portable power station market.
Burgeoning demand for smart electronic devices is driving the global portable power station market growth.
Key contenders profiled in the global portable power station market include Goal Zero (US), Jackery (US), Lion Energy (US), Ecoflow (US), Li Power (Shenzhen) Technology (China), ChargeTech (US), Midland (US), Duracell (US), Drow Enterprise (China), Scott Electric (US), Suaoki (Japan), and Milwaukee Electric Tool (US).