Device as a Service Market

ID: MRFR/ICT/3072-CR 174 Pages Ankit Gupta Last Updated: September 15, 2026
Tamaño del mercado de Dispositivo como Servicio, participación y análisis de tendencias por componente (Hardware, Soluciones y Servicios), por Hardware (Escritorio, Portátiles, Impresoras y Otros), por Servicios (Servicios Profesionales y Gestionados) por Tamaño de Organización (Grandes Empresas, Pequeñas y Medianas Empresas), por Vertical de Industria (TI y Telecomunicaciones, BFSI, Salud, Retail, Gobierno, Educación, Manufactura y Otros) y por Región (América del Norte, Europa, Asia-Pacífico, Medio Oriente y África y América del Sur) - Pronóstico hasta 2035.
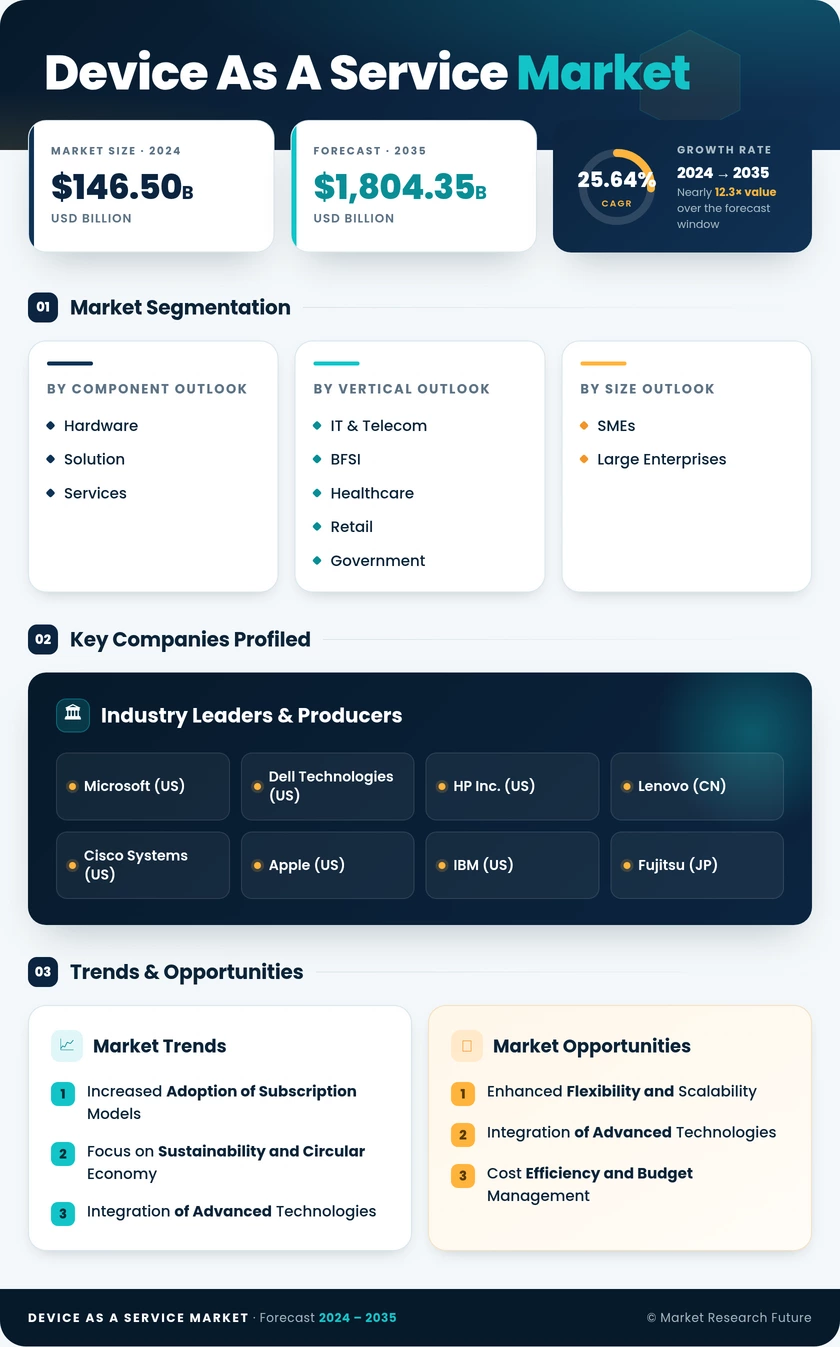
Device as a Service Market
Market Size
Forecast Period2025 - 2035
CAGR (2025 - 2035)25.64%
2024 Market Size$ 146.5 Billion
2025 Market Size$ 184.07 Billion
2035 Market Size$ 1,804.35 Billion
Key Players
Microsoft
Dell Technologies
HP Inc.
Lenovo
Cisco Systems
Apple
Opportunities
  • Enhanced Flexibility and Scalability
  • Integration of Advanced Technologies
  • Cost Efficiency and Budget Management
  1. 1 Resumen ejecutivo 17
    1. 1.1 ANÁLISIS DEL ATRACTIVO DEL MERCADO 18
  2. 2 INTRODUCCIÓN AL MERCADO 19
    1. 2.1 DEFINICIÓN 19
    2. 2.2 ALCANCE DEL ESTUDIO 19
    3. 2.3 Objetivo de la investigación 19
    4. 2.4 ESTRUCTURA DEL MERCADO 20
  3. 3 Metodología de la investigación 21
  4. 4 PERSPECTIVAS DEL MERCADO 28
  5. 5 Dinámica del mercado 30
    1. 5.1 Introducción 30
    2. 5.2 Impulsores 31
      1. 5.2.1 Creciente necesidad de reducir el gasto de capital (Capex) y el gasto operativo (Opex) entre las empresas 31
      2. 5.2.2 Adopción de servicios y soluciones basados ​​en contratos por parte de las PYME 32
      3. 5.2.3 Análisis del impacto de los impulsores 32
    3. 5.3 Restricciones 33
      1. 5.3.1 Adopción de políticas BYOD y CYOD 33
      2. 5.3.2 Falta de experiencia técnica y preocupaciones de seguridad 33
      3. 5.3.3 Análisis del impacto de las restricciones 33
    4. 5.4 Oportunidades 34
      1. 5.4.1 Creciente adopción de IoT 34
    5. 5.5 Impacto de la COVID-19 35
  6. 6 Análisis de factores de mercado 37
    1. 6.1 Análisis de la cadena de valor 37
      1. 6.1.1 Proveedores/proveedores de servicios 37
      2. 6.1.2 Socios de canal/vendedores de valor añadido/socios de integración 38
      3. 6.1.3 Usuarios finales 38
    2. 6.2 Modelo de las cinco fuerzas de Porter 38
      1. 6.2.1 Amenaza de nuevos participantes 39
      2. 6.2.2 Poder de negociación de los proveedores 39
      3. 6.2.3 Amenaza de sustitutos 39
      4. 6.2.4 Poder de negociación de los compradores 40
      5. 6.2.5 Rivalidad competitiva 40
  7. 7 MERCADO GLOBAL DE DISPOSITIVOS COMO SERVICIO (DAAS), POR COMPONENTE 41
    1. 7.1 DESCRIPCIÓN GENERAL 41
    2. 7.2 Solución (software) 42
    3. 7.3 Servicios 42
      1. 7.3.1 Servicios profesionales 42
      2. 7.3.2 Servicios gestionados 43
  8. 8 MERCADO GLOBAL DE DISPOSITIVOS COMO SERVICIO (DaaS), POR TAMAÑO DE LA ORGANIZACIÓN 45
    1. 8.1 DESCRIPCIÓN GENERAL 45
    2. 8.2 Grandes empresas 45
    3. 8.3 PYMES 45
  9. 9 MERCADO GLOBAL DE DISPOSITIVOS COMO SERVICIO (DaaS), POR VERTICAL 48
    1. 9.1 INTRODUCCIÓN 48
    2. 9.2 BFSI 48
    3. 9.3 ATENCIÓN MÉDICA 48
    4. 9.4 FABRICACIÓN 48
    5. 9.5 VENTA MINORISTA 48
    6. 9.6 TI Y TELECOMUNICACIONES 49
    7. 9.7 Educación 49
    8. 9.8 Gobierno 49
    9. 9.9 OTROS 49
  10. 10 MERCADO GLOBAL DE DISPOSITIVOS COMO SERVICIO (DAAS), POR REGIÓN 52
    1. 10.1 RESUMEN 52
    2. 10.2 AMÉRICA DEL NORTE 53
      1. 10.2.1 MERCADO DE DISPOSITIVOS COMO SERVICIO (DAAS) DE AMÉRICA DEL NORTE, POR PAÍS, 2018-2030 (MILES DE MILLONES DE USD) 54
      2. 10.2.2 MERCADO DE DISPOSITIVOS COMO SERVICIO (DAAS) DE AMÉRICA DEL NORTE, POR COMPONENTE, 2018-2030 (MILES DE MILLONES DE USD) 55
      3. 10.2.3 MERCADO DE DISPOSITIVOS COMO SERVICIO (DAAS) DE AMÉRICA DEL NORTE, POR HARDWARE, 2018-2030 (MILES DE MILLONES DE USD) MIL MILLONES) 56
      4. 10.2.4 América del Norte MERCADO DE DISPOSITIVOS COMO SERVICIO (DAAS), POR SERVICIOS, 2018-2030 (MILES DE MILLONES DE USD) 56
      5. 10.2.5 América del Norte MERCADO DE DISPOSITIVOS COMO SERVICIO (DAAS), POR TAMAÑO DE ORGANIZACIÓN, 2018-2030 (MILES DE MILLONES DE USD) 57
      6. 10.2.6 América del Norte MERCADO DE DISPOSITIVOS COMO SERVICIO (DAAS), POR VERTICAL, 2018-2030 (MILES DE MILLONES DE USD) 58
      7. 10.2.7 EE. UU. 59
      8. 10.2.8 EE. UU. MERCADO DE DISPOSITIVOS COMO SERVICIO (DAAS), POR COMPONENTE, 2018-2030 (MILES DE MILLONES DE USD) 59
      9. 10.2.9 EE. UU. MERCADO DE DISPOSITIVOS COMO SERVICIO (DAAS), POR HARDWARE, 2018-2030 (USD MILLONES) 59
      10. 10.2.10 MERCADO DE DISPOSITIVOS COMO SERVICIO (DAAS) DE EE. UU., POR SERVICIOS, 2018-2030 (USD MILLONES) 60
      11. 10.2.11 MERCADO DE DISPOSITIVOS COMO SERVICIO (DAAS) DE EE. UU., POR TAMAÑO DE ORGANIZACIÓN, 2018-2030 (USD MILLONES) 60
      12. 10.2.12 MERCADO DE DISPOSITIVOS COMO SERVICIO (DAAS) DE EE. UU., POR VERTICAL, 2018-2030 (USD MILLONES) 61
      13. 10.2.13 CANADÁ 61
      14. 10.2.14 MERCADO DE DISPOSITIVOS COMO SERVICIO (DAAS) DE CANADÁ, POR COMPONENTE, 2018-2030 (USD MILLONES) 61
      15. 10.2.15 MERCADO DE DISPOSITIVOS COMO SERVICIO (DAAS) EN CANADÁ, POR HARDWARE, 2018-2030 (MILES DE MILLONES DE USD) 62
      16. 10.2.16 MERCADO DE DISPOSITIVOS COMO SERVICIO (DAAS) EN CANADÁ, POR SERVICIOS, 2018-2030 (MILES DE MILLONES DE USD) 62
      17. 10.2.17 MERCADO DE DISPOSITIVOS COMO SERVICIO (DAAS) EN CANADÁ, POR TAMAÑO DE ORGANIZACIÓN, 2018-2030 (MILES DE MILLONES DE USD) 62
      18. 10.2.18 MERCADO DE DISPOSITIVOS COMO SERVICIO (DAAS) EN CANADÁ, POR VERTICAL, 2018-2030 (MILES DE MILLONES DE USD) 63
      19. 10.2.19 MÉXICO 63
      20. 10.2.20 MÉXICO DISPOSITIVOS COMO SERVICIO (DAAS) MERCADO, POR COMPONENTE, 2018-2030 (USD MIL MILLONES) 63
      21. 10.2.21 MÉXICO MERCADO DE DISPOSITIVOS COMO SERVICIO (DAAS), POR HARDWARE, 2018-2030 (USD MIL MILLONES) 64
      22. 10.2.22 MÉXICO MERCADO DE DISPOSITIVOS COMO SERVICIO (DAAS), POR servicios, 2018-2030 (USD MIL MILLONES) 64
      23. 10.2.23 MÉXICO MERCADO DE DISPOSITIVOS COMO SERVICIO (DAAS), POR tamaño de organización, 2018-2030 (USD MIL MILLONES) 64
      24. 10.2.24 MÉXICO MERCADO DE DISPOSITIVOS COMO SERVICIO (DAAS), POR vertical, 2018-2030 (USD MIL MILLONES) 65
    3. 10.3 Europa 66
      1. 10.3.1 Mercado europeo de dispositivos como servicio (DAAS), por país, 2018-2030 (miles de millones de USD) 67
      2. 10.3.2 Mercado europeo de dispositivos como servicio (DAAS), por componente, 2018-2030 (miles de millones de USD) 68
      3. 10.3.3 Mercado europeo de dispositivos como servicio (DAAS), por hardware, 2018-2030 (miles de millones de USD) 68
      4. 10.3.4 Mercado europeo de dispositivos como servicio (DAAS), por tamaño de organización, 2018-2030 (miles de millones de USD) 69
      5. 10.3.5 Mercado europeo de dispositivos como servicio (DAAS), por tamaño de organización, 2018-2030 (miles de millones de USD) 69
      6. 10.3.6 Europa MERCADO DE DISPOSITIVOS COMO SERVICIO (DAAS), POR VERTICAL, 2018-2030 (MILES DE MILLONES DE USD) 70
      7. 10.3.7 Reino Unido 71
        1. 10.3.7.1 Reino Unido MERCADO DE DISPOSITIVOS COMO SERVICIO (DAAS), POR COMPONENTE, 2018-2030 (MILES DE MILLONES DE USD) 71
        2. 10.3.7.2 Reino Unido MERCADO DE DISPOSITIVOS COMO SERVICIO (DAAS), POR HARDWARE, 2018-2030 (MILES DE MILLONES DE USD) 71
        3. 10.3.7.3 Reino Unido MERCADO DE DISPOSITIVOS COMO SERVICIO (DAAS), POR servicios, 2018-2030 (MILES DE MILLONES DE USD) 72
        4. 10.3.7.4 Reino Unido MERCADO DE DISPOSITIVOS COMO SERVICIO (DAAS), POR tamaño de organización, 2018-2030 (USD MIL MILLONES) 72
        5. 10.3.7.5 REINO UNIDO MERCADO DE DISPOSITIVOS COMO SERVICIO (DAAS), POR SECTOR VERTICAL, 2018-2030 (USD MIL MILLONES) 73
      8. 10.3.8 ALEMANIA 73
        1. 10.3.8.1 Alemania MERCADO DE DISPOSITIVOS COMO SERVICIO (DAAS), POR COMPONENTE, 2018-2030 (USD MIL MILLONES) 73
        2. 10.3.8.2 Alemania MERCADO DE DISPOSITIVOS COMO SERVICIO (DAAS), POR HARDWARE, 2018-2030 (USD MIL MILLONES) 74
        3. 10.3.8.3 Alemania MERCADO DE DISPOSITIVOS COMO SERVICIO (DAAS), POR SERVICIOS, 2018-2030 (USD MIL MILLONES) 74
        4. 10.3.8.4 Alemania DISPOSITIVO MERCADO DE DISPOSITIVOS COMO SERVICIO (DAAS), POR TAMAÑO DE ORGANIZACIÓN, 2018-2030 (MILES DE MILLONES DE USD) 74
        5. 10.3.8.5 Alemania MERCADO DE DISPOSITIVOS COMO SERVICIO (DAAS), POR SECTORES, 2018-2030 (MILES DE MILLONES DE USD) 75
      9. 10.3.9 Francia 75
        1. 10.3.9.1 Francia MERCADO DE DISPOSITIVOS COMO SERVICIO (DAAS), POR COMPONENTES, 2018-2030 (MILES DE MILLONES DE USD) 75
        2. 10.3.9.2 Francia MERCADO DE DISPOSITIVOS COMO SERVICIO (DAAS), POR HARDWARE, 2018-2030 (MILES DE MILLONES DE USD) 76
        3. 10.3.9.3 Francia MERCADO DE DISPOSITIVOS COMO SERVICIO (DAAS), POR SERVICIOS, 2018-2030 (MILES DE MILLONES DE USD) 76
        4. 10.3.9.4 Francia MERCADO DE DISPOSITIVOS COMO SERVICIO (DAAS), POR TAMAÑO DE LA ORGANIZACIÓN, 2018-2030 (MILES DE MILLONES DE USD) 76
        5. 10.3.9.5 Francia MERCADO DE DISPOSITIVOS COMO SERVICIO (DAAS), POR SECTORES, 2018-2030 (MILES DE MILLONES DE USD) 77
      10. 10.3.10 RESTO DE EUROPA 77
        1. 10.3.10.1 RESTO DE EUROPA MERCADO DE DISPOSITIVOS COMO SERVICIO (DAAS), POR COMPONENTES, 2018-2030 (MILES DE MILLONES DE USD) 77
        2. 10.3.10.2 RESTO DE EUROPA MERCADO DE DISPOSITIVOS COMO SERVICIO (DAAS), POR HARDWARE, 2018-2030 (MILES DE MILLONES DE USD) 78
        3. 10.3.10.3 RESTO DE EUROPA MERCADO DE DISPOSITIVOS COMO SERVICIO (DAAS), POR SERVICIOS, 2018-2030 (MILES DE MILLONES DE USD) 78
        4. 10.3.10.4 RESTO DE EUROPA MERCADO DE DISPOSITIVOS COMO SERVICIO (DAAS), POR TAMAÑO DE ORGANIZACIÓN, 2018-2030 (MILES DE MILLONES DE USD) 79
        5. 10.3.10.5 RESTO DE EUROPA MERCADO DE DISPOSITIVOS COMO SERVICIO (DAAS), POR VERTICAL, 2018-2030 (MILES DE MILLONES DE USD) 79
    4. 10.4 Asia-Pacífico 80
      1. 10.4.1 ASIA-PACÍFICO MERCADO DE DISPOSITIVOS COMO SERVICIO (DAAS), POR componente, 2018-2030 (MILES DE MILLONES DE USD) 82
      2. 10.4.2 ASIA-PACÍFICO MERCADO DE DISPOSITIVOS COMO SERVICIO (DAAS), POR HARDWARE, 2018-2030 (USD MIL MILLONES) 82
      3. 10.4.3 MERCADO DE DISPOSITIVOS COMO SERVICIO (DAAS) DE ASIA-PACÍFICO, POR SERVICIOS, 2018-2030 (USD MIL MILLONES) 83
      4. 10.4.4 MERCADO DE DISPOSITIVOS COMO SERVICIO (DAAS) DE ASIA-PACÍFICO, POR TAMAÑO DE ORGANIZACIÓN, 2018-2030 (USD MIL MILLONES) 84
      5. 10.4.5 MERCADO DE DISPOSITIVOS COMO SERVICIO (DAAS) DE ASIA-PACÍFICO, POR VERTICAL, 2018-2030 (USD MIL MILLONES) 85
      6. 10.4.6 CHINA 85
      7. 10.4.7 MERCADO DE DISPOSITIVOS COMO SERVICIO (DAAS) DE CHINA, POR COMPONENTE, 2018-2030 (USD MIL MILLONES) 85
      8. 10.4.8 MERCADO DE DISPOSITIVOS COMO SERVICIO (DAAS) EN CHINA, POR HARDWARE, 2018-2030 (MILES DE MILLONES DE USD) 86
      9. 10.4.9 MERCADO DE DISPOSITIVOS COMO SERVICIO (DAAS) EN CHINA, POR SERVICIOS, 2018-2030 (MILES DE MILLONES DE USD) 86
      10. 10.4.10 MERCADO DE DISPOSITIVOS COMO SERVICIO (DAAS) EN CHINA, POR TAMAÑO DE ORGANIZACIÓN, 2018-2030 (MILES DE MILLONES DE USD) 86
      11. 10.4.11 MERCADO DE DISPOSITIVOS COMO SERVICIO (DAAS) EN CHINA, POR VERTICAL, 2018-2030 (MILES DE MILLONES DE USD) 87
      12. 10.4.12 JAPÓN 87
      13. 10.4.13 JAPÓN, DISPOSITIVOS COMO SERVICIO (DAAS) MERCADO, POR COMPONENTE, 2018-2030 (USD MIL MILLONES) 87
      14. 10.4.14 MERCADO DE DISPOSITIVOS COMO SERVICIO (DAAS) EN JAPÓN, POR HARDWARE, 2018-2030 (USD MIL MILLONES) 88
      15. 10.4.15 MERCADO DE DISPOSITIVOS COMO SERVICIO (DAAS) EN JAPÓN, POR SERVICIOS, 2018-2030 (USD MIL MILLONES) 88
      16. 10.4.16 MERCADO DE DISPOSITIVOS COMO SERVICIO (DAAS) EN JAPÓN, POR TAMAÑO DE ORGANIZACIÓN, 2018-2030 (USD MIL MILLONES) 88
      17. 10.4.17 MERCADO DE DISPOSITIVOS COMO SERVICIO (DAAS) EN JAPÓN, POR VERTICAL, 2018-2030 (USD MIL MILLONES) 89
      18. 10.4.18 INDIA 89
      19. 10.4.19 MERCADO DE DISPOSITIVOS COMO SERVICIO (DAAS) EN INDIA, POR COMPONENTE, 2018-2030 (MILES DE MILLONES DE USD) 89
      20. 10.4.20 MERCADO DE DISPOSITIVOS COMO SERVICIO (DAAS) EN INDIA, POR HARDWARE, 2018-2030 (MILES DE MILLONES DE USD) 90
      21. 10.4.21 MERCADO DE DISPOSITIVOS COMO SERVICIO (DAAS) EN INDIA, POR SERVICIOS, 2018-2030 (MILES DE MILLONES DE USD) 90
      22. 10.4.22 MERCADO DE DISPOSITIVOS COMO SERVICIO (DAAS) EN INDIA, POR TAMAÑO DE ORGANIZACIÓN, 2018-2030 (MILES DE MILLONES DE USD) 90
      23. 10.4.23 MERCADO DE DISPOSITIVOS COMO SERVICIO (DAAS) EN INDIA, POR VERTICAL, 2018-2030 (USD MIL MILLONES) 91
      24. 10.4.24 Vietnam 91
      25. 10.4.25 VIETNAM MERCADO DE DISPOSITIVOS COMO SERVICIO (DAAS), POR COMPONENTE, 2018-2030 (USD MIL MILLONES) 91
      26. 10.4.26 VIETNAM MERCADO DE DISPOSITIVOS COMO SERVICIO (DAAS), POR HARDWARE, 2018-2030 (USD MIL MILLONES) 92
      27. 10.4.27 VIETNAM MERCADO DE DISPOSITIVOS COMO SERVICIO (DAAS), POR SERVICIOS, 2018-2030 (USD MIL MILLONES) 92
      28. 10.4.28 VIETNAM MERCADO DE DISPOSITIVOS COMO SERVICIO (DAAS), POR TAMAÑO DE LA ORGANIZACIÓN, 2018-2030 (USD MIL MILLONES) 92
      29. 10.4.29 VIETNAM MERCADO DE DISPOSITIVOS COMO SERVICIO (DAAS), POR VERTICAL, 2018-2030 (MILES DE MILLONES DE USD) 93
      30. 10.4.30 RESTO DE ASIA-PACÍFICO 93
      31. 10.4.31 RESTO DE ASIA-PACÍFICO MERCADO DE DISPOSITIVOS COMO SERVICIO (DAAS), POR COMPONENTE, 2018-2030 (MILES DE MILLONES DE USD) 93
      32. 10.4.32 RESTO DE ASIA-PACÍFICO MERCADO DE DISPOSITIVOS COMO SERVICIO (DAAS), POR HARDWARE, 2018-2030 (MILES DE MILLONES DE USD) 94
      33. 10.4.33 RESTO DE ASIA-PACÍFICO MERCADO DE DISPOSITIVOS COMO SERVICIO (DAAS), POR SERVICIOS, 2018-2030 (MILES DE MILLONES DE USD) 94
      34. 10.4.34 RESTO DE ASIA-PACÍFICO DISPOSITIVO MERCADO DE DISPOSITIVOS COMO SERVICIO (DAAS), POR TAMAÑO DE ORGANIZACIÓN, 2018-2030 (MILES DE MILLONES DE USD) 95
      35. 10.4.35 RESTO DE ASIA-PACÍFICO MERCADO DE DISPOSITIVOS COMO SERVICIO (DAAS), POR VERTICAL, 2018-2030 (MILES DE MILLONES DE USD) 95
    5. 10.5 Oriente Medio y África 96
      1. 10.5.1 ORIENTE MEDIO Y ÁFRICA MERCADO DE DISPOSITIVOS COMO SERVICIO (DAAS), POR componente, 2018-2030 (MILES DE MILLONES DE USD) 96
      2. 10.5.2 ORIENTE MEDIO Y ÁFRICA MERCADO DE DISPOSITIVOS COMO SERVICIO (DAAS), POR HARDWARE, 2018-2030 (MILES DE MILLONES DE USD) 97
      3. 10.5.3 ORIENTE MEDIO Y ÁFRICA MERCADO DE DISPOSITIVOS COMO SERVICIO (DAAS), POR SERVICIOS, 2018-2030 (MILES DE MILLONES DE USD) 97
      4. 10.5.4 ORIENTE MEDIO Y ÁFRICA MERCADO DE DISPOSITIVOS COMO SERVICIO (DAAS), POR TAMAÑO DE ORGANIZACIÓN, 2018-2030 (MILES DE MILLONES DE USD) 98
      5. 10.5.5 ORIENTE MEDIO Y MERCADO DE DISPOSITIVOS COMO SERVICIO (DAAS) EN ÁFRICA, POR VERTICAL, 2018-2030 (MILES DE MILLONES DE USD) 99
      6. 10.5.6 América del Sur 100
      7. 10.5.7 AMÉRICA DEL SUR MERCADO DE DISPOSITIVOS COMO SERVICIO (DAAS), POR COMPONENTE, 2018-2030 (MILES DE MILLONES DE USD) 100
      8. 10.5.8 AMÉRICA DEL SUR MERCADO DE DISPOSITIVOS COMO SERVICIO (DAAS), POR HARDWARE, 2018-2030 (MILES DE MILLONES DE USD) 101
      9. 10.5.9 AMÉRICA DEL SUR MERCADO DE DISPOSITIVOS COMO SERVICIO (DAAS), POR SERVICIOS, 2018-2030 (MILES DE MILLONES DE USD) 101
      10. 10.5.10 AMÉRICA DEL SUR MERCADO DE DISPOSITIVOS COMO SERVICIO (DAAS) MERCADO, POR TAMAÑO DE ORGANIZACIÓN, 2018-2030 (USD MIL MILLONES) 102
      11. 10.5.11 MERCADO DE DISPOSITIVOS COMO SERVICIO (DAAS) DE AMÉRICA DEL SUR, POR VERTICAL, 2018-2030 (USD MIL MILLONES) 103
  11. 11 Panorama competitivo 104
    1. 11.1 Descripción general competitiva 104
    2. 11.2 Panel de competidores 105
    3. 11.3 DESARROLLOS CLAVE Y ESTRATEGIAS DE CRECIMIENTO 106
      1. 11.3.1 Desarrollo de productos 106
      2. 11.3.2 Fusiones, adquisiciones y asociaciones 107
    4. 11.4 ANÁLISIS DE PARTICIPACIÓN DE PROVEEDORES 108
  12. 12 Perfiles de empresas 109
    1. 12.1 HP Development Company, L.P. 109
      1. 12.1.1 DESCRIPCIÓN GENERAL DE LA EMPRESA 109
      2. 12.1.2 PRODUCTOS/SOLUCIONES/SERVICIOS OFRECIDOS 110
      3. 12.1.3 DESARROLLOS CLAVE 111
      4. 12.1.4 ANÁLISIS FODA 112
      5. 12.1.5 ESTRATEGIAS CLAVE 112
    2. 12.2 Microsoft Corporation 113
      1. 12.2.1 DESCRIPCIÓN GENERAL DE LA EMPRESA 113
      2. 12.2.2 RESUMEN FINANCIERO 114
      3. 12.2.3 PRODUCTOS/SOLUCIONES/SERVICIOS OFRECIDOS 114
      4. 12.2.4 DESARROLLOS CLAVE 115
      5. 12.2.5 ANÁLISIS FODA 115
      6. 12.2.6 Estrategias clave 115
    3. 12.3 Dell Inc. 116
      1. 12.3.1 RESUMEN DE LA EMPRESA 116
      2. 12.3.2 RESUMEN FINANCIERO 117
      3. 12.3.3 PRODUCTOS/SOLUCIONES/SERVICIOS OFRECIDOS 117
      4. 12.3.4 DESARROLLOS CLAVE 118
      5. 12.3.5 ANÁLISIS FODA 119
      6. 12.3.6 Estrategias clave 119
    4. 12.4 Amazon Web Service 120
      1. 12.4.1 DESCRIPCIÓN GENERAL DE LA EMPRESA 120
      2. 12.4.2 DESCRIPCIÓN GENERAL FINANCIERA 120
      3. 12.4.3 PRODUCTOS/SOLUCIONES/SERVICIOS OFRECIDOS 121
      4. 12.4.4 DESARROLLOS CLAVE 121
      5. 12.4.5 ANÁLISIS FODA 121
      6. 12.4.6 Estrategias clave 121
    5. 12.5 Lenovo 122
      1. 12.5.1 DESCRIPCIÓN GENERAL DE LA EMPRESA 122
      2. 12.5.2 DESCRIPCIÓN GENERAL FINANCIERA 123
      3. 12.5.3 PRODUCTOS/SOLUCIONES/SERVICIOS OFRECIDOS 123
      4. 12.5.4 DESARROLLOS CLAVE 124
      5. 12.5.5 ANÁLISIS FODA 124
      6. 12.5.6 Estrategias clave 124
    6. 12.6 Yorktel 125
      1. 12.6.1 EMPRESA DESCRIPCIÓN GENERAL 125
      2. 12.6.2 DESCRIPCIÓN FINANCIERA GENERAL 125
      3. 12.6.3 PRODUCTOS/SOLUCIONES/SERVICIOS OFRECIDOS 125
      4. 12.6.4 DESARROLLOS CLAVE 125
    7. 12.7 Scantron 126
      1. 12.7.1 DESCRIPCIÓN GENERAL DE LA EMPRESA 126
      2. 12.7.2 DESCRIPCIÓN FINANCIERA GENERAL 126
      3. 12.7.3 PRODUCTOS/SOLUCIONES/SERVICIOS OFRECIDOS 126
      4. 12.7.4 DESARROLLOS CLAVE 126
    8. 12.8 INTEL CORPORATION 127
      1. 12.8.1 DESCRIPCIÓN GENERAL DE LA EMPRESA 127
      2. 12.8.2 ANÁLISIS FODA 128
      3. 12.8.3 PRODUCTOS/SOLUCIONES/ SERVICIOS OFRECIDOS 128
      4. 12.8.4 DESARROLLOS CLAVE 128
      5. 12.8.5 ANÁLISIS FODA 129
      6. 12.8.6 Estrategias clave 129
    9. 12.9 Apple Inc. 130
      1. 12.9.1 DESCRIPCIÓN GENERAL DE LA EMPRESA 130
      2. 12.9.2 DESCRIPCIÓN FINANCIERA 130
      3. 12.9.3 PRODUCTOS/SOLUCIONES/SERVICIOS OFRECIDOS 131
      4. 12.9.4 DESARROLLOS CLAVE 131
      5. 12.9.5 ANÁLISIS FODA 131
      6. 12.9.6 Estrategias clave 131
    10. 12.10 Citrix Systems 132
      1. 12.10.1 DESCRIPCIÓN GENERAL DE LA EMPRESA 132
      2. 12.10.2 RESUMEN FINANCIERO 133

Segmentación del mercado de dispositivos como servicio

Perspectiva de los componentes de dispositivos como servicio (miles de millones de USD, 2018-2030)

  • Hardware

    • Escritorio

    • Portátil

    • Impresoras

    • Otros

  • Solución

  • Servicios

    • Servicios profesionales

    • Administrado Servicios

Perspectiva del tamaño de las organizaciones de dispositivos como servicio (miles de millones de USD, 2018-2030)

  • PYME

  • Grandes empresas

Perspectiva de las verticales de la industria de dispositivos como servicio (miles de millones de USD, 2018-2030)

  • TI y Telecomunicaciones

  • BFSI

  • Salud

  • Venta minorista

  • Gobierno

  • Educación

  • Manufactura

  • Otros

Perspectiva regional de dispositivos como servicio (miles de millones de USD, 2018-2030)

  • Perspectiva de Norteamérica (miles de millones de USD, 2018-2030)

    • Dispositivo como servicio (DaaS) en Norteamérica por componente

      • Hardware

        • Escritorio

        • Portátil

        • Impresoras

        • Otros

      • Solución

      • Servicios

        • Servicios profesionales

        • Administrado Servicios

    • Dispositivo como servicio (DSS) en Norteamérica por tamaño de organización

      • PYMES

      • Grandes empresas

    • Dispositivo como servicio (DSS) en Norteamérica por sector industrial

      • TI y Telecomunicaciones

      • BFSI

      • Salud

      • Venta minorista

      • Gobierno

      • Educación

      • Manufactura

      • Otros

    • Perspectivas de EE. UU. (miles de millones de USD, 2018-2030)

    • Dispositivo como servicio (DaaS) de EE. UU. por Componente

      • Hardware

        • Escritorio

        • Portátil

        • Impresoras

        • Otros

      • Solución

      • Servicios

        • Servicios profesionales

        • Servicios gestionados

    • Dispositivo como servicio (EE. UU.) por organización Tamaño

      • PYME

      • Grandes empresas

    • Dispositivo como servicio (DaaS) en EE. UU. por sector industrial

      • TI y Telecomunicaciones

      • BFSI

      • Salud

      • Venta minorista

      • Gobierno

      • Educación

      • Manufactura

      • Otros

    • CANADÁPerspectivas (miles de millones de USD, 2018-2030)

    • CANADÁ: Dispositivo como servicio (DaaS) Componente

      • Hardware

        • Escritorio

        • Portátil

        • Impresoras

        • Otros

      • Solución

      • Servicios

        • Servicios profesionales

        • Servicios gestionados

    • CANADÁ: Dispositivo como servicio por organización Tamaño

    • PYME

    • Grandes empresas

  • CANADÁ: Dispositivos como servicio por sector industrial

    • TI y Telecomunicaciones

    • BFSI

    • Cuidado de la salud

    • Venta al por menor

    • Gobierno

    • Educación

    • Fabricación

    • Otros

Perspectivas de Europa (miles de millones de dólares, 2018-2030)Dispositivo como servicio en Europa por ComponenteHardwareEscritorioPortátilImpresorasOtrosSoluciónServiciosServicios profesionalesServicios gestionadosDispositivo como servicio en Europa por organización TamañoPYMEGrandes empresasDispositivo como servicio (DaaS) en Europa por sectores industrialesTI y TelecomunicacionesBFSISaludVenta minoristaGobiernoEducaciónManufacturaOtrosAlemaniaPerspectivas (miles de millones de USD, 2018-2030)Alemania: Dispositivo como servicio (DaaS) ComponenteHardwareEscritorioPortátilImpresorasOtrosSoluciónServiciosServicios profesionalesServicios gestionadosDispositivo como servicio (DaaS) en Alemania por organización Tamaño PYMEGrandes empresas Dispositivo como servicio (DaaS) en Alemania por sectores industrialesTI y TelecomunicacionesBFSISaludVenta minoristaGobiernoEducaciónManufacturaOtrosPerspectivas para Francia (miles de millones de USD, 2018-2030)Dispositivo como servicio en Francia por ComponenteHardwareEscritorioPortátilImpresorasOtrosSoluciónServiciosServicios profesionalesServicios gestionadosDispositivo como servicio (DaaS) en Francia por organización Tamaño PYMEGrandes empresas Dispositivo como servicio en Francia por sectores industrialesTI y TelecomunicacionesBFSISaludVenta minoristaGobiernoEducaciónManufacturaOtrosPerspectivas del Reino Unido (miles de millones de USD, 2018-2030)Dispositivo como servicio en el Reino Unido por ComponenteHardwareEscritorioPortátilImpresorasOtrosSoluciónServiciosServicios profesionalesServicios gestionadosDispositivo como servicio (DaaS) en el Reino Unido por organización TamañoPYMEGrandes empresasDispositivo como servicio (DaaS) en el Reino Unido por sectores industrialesTI y TelecomunicacionesBFSISaludVenta minoristaGobiernoEducaciónManufacturaOtrosITALIAPerspectivas (miles de millones de USD, 2018-2030)ITALIA: Dispositivo como servicio (DaaS) ComponenteHardwareEscritorioPortátilImpresorasOtrosSoluciónServiciosServicios profesionalesServicios gestionadosITALIA Dispositivo como servicio por organización TamañoPYMEGrandes empresasITALIA Dispositivo como Servicio por Sectores IndustrialesTI y TelecomunicacionesBFSISanidadComercio minoristaGobiernoEducaciónManufacturaOtrosPERSPECTIVAS PARA ESPAÑA (MIDORES DE USD, 2018-2030)Disco como servicio en España por ComponenteHardwareEscritorioPortátilImpresorasOtrosSoluciónServiciosServicios profesionalesServicios gestionadosDispositivo como servicio (DaaS) en España por organización TamañoPYMESGrandes empresasDispositivos como servicio en España por sectoresTI y TelecomunicacionesBFSISaludVenta minoristaGobiernoEducaciónManufacturaOtrosResto de EuropaPerspectivas (miles de millones de USD, 2018-2030)RESTO DE EUROPA: Dispositivo como servicio (DaaS) ComponenteHardwareEscritorioPortátilImpresorasOtrosSoluciónServiciosServicios profesionalesServicios gestionadosRESTO DE EUROPA: Dispositivo como servicio por organización TamañoPYMEGrandes empresasRESTO DE EUROPA Dispositivo como servicio por sectores industrialesTI y TelecomunicacionesBFSICuidado de la saludVenta al por menorGobiernoEducaciónFabricaciónOtros Perspectivas de Asia y el Pacífico (miles de millones de dólares, 2018-2030)Dispositivo como servicio de Asia y el Pacífico por ComponenteHardwareEscritorioPortátilImpresorasOtrosSoluciónServiciosServicios profesionalesServicios gestionadosDispositivo como servicio (DaaS) en Asia-Pacífico por organización TamañoPYMEGrandes empresasDispositivo como servicio (DaaS) en Asia-Pacífico por sectores industrialesTI y TelecomunicacionesBFSISaludVenta minoristaGobiernoEducaciónManufacturaOtrosPerspectivas de China (miles de millones de USD, 2018-2030)Dispositivo como servicio en China por ComponenteHardwareEscritorioPortátilImpresorasOtrosSoluciónServiciosServicios profesionalesServicios gestionadosDispositivo como servicio (DaaS) en China por organización TamañoPYMEGrandes empresasDispositivo como servicio (DaaS) en China por sectores industrialesTI y TelecomunicacionesBFSISaludVenta minoristaGobiernoEducaciónManufacturaOtrosPerspectivas para Japón (miles de millones de USD, 2018-2030)Dispositivo como servicio en Japón por ComponenteHardwareEscritorioPortátilImpresorasOtrosSoluciónServiciosServicios profesionalesServicios gestionadosDispositivo como servicio (DaaS) en Japón por organización Tamaño PYMEGrandes empresas Dispositivo como servicio (DaaS) en Japón por sectores industrialesTI y TelecomunicacionesBFSISaludVenta minoristaGobiernoEducaciónManufacturaOtrosPerspectivas de India(Miles de millones de USD, 2018-2030)Disco como servicio en India por ComponenteHardwareEscritorioPortátilImpresorasOtrosSoluciónServiciosServicios profesionalesServicios gestionadosDisco como servicio (DaaS) en India por organización Tamaño PYMEGrandes empresas Disco como Servicio en India por Sectores IndustrialesTI y TelecomunicacionesBFSISaludVenta minoristaGobiernoEducaciónManufacturaOtrosPerspectivas de Australia (miles de millones de USD, 2018-2030)Dispositivo como servicio (DaaS) en Australia ComponenteHardwareEscritorioPortátilImpresorasOtrosSoluciónServiciosServicios profesionalesServicios gestionadosAustralia: Dispositivo como servicio por organización Tamaño PYMEGrandes empresas Dispositivo como servicio (DaaS) en Australia por sectores industrialesTI y TelecomunicacionesBFSISaludVenta minoristaGobiernoEducaciónManufacturaOtrosPerspectivas para el resto de Asia-Pacífico (miles de millones de USD, 2018-2030)Dispositivo como servicio para el resto de Asia-Pacífico ComponenteHardwareEscritorioPortátilImpresorasOtrosSoluciónServiciosServicios profesionalesServicios gestionadosResto de Asia-Pacífico: Dispositivo como servicio por organización TamañoPYMEGrandes empresasResto de dispositivos como servicio (DaaS) de Asia-Pacífico por sectores industrialesTI y TelecomunicacionesBFSISaludVenta minoristaGobiernoEducaciónManufacturaOtros Perspectivas para el resto del mundo (miles de millones de USD, 2018-2030)Dispositivo como servicio (DaaS) para el resto del mundo ComponenteHardwareEscritorioPortátilImpresorasOtrosSoluciónServiciosServicios profesionalesServicios gestionadosDispositivo como servicio (DaaS) en el resto del mundo por organización TamañoPYMEGrandes empresasDispositivo como servicio (DaaS) en el resto del mundo por sectores industrialesTI y TelecomunicacionesBFSICuidado de la saludVenta al por menorGobiernoEducaciónFabricaciónOtros Perspectivas para Oriente Medio (miles de millones de USD, 2018-2030)Dispositivo como servicio (DaaS) en Oriente Medio por componenteHardwareEscritorioPortátilImpresorasOtrosSoluciónServiciosProfesional ServiciosServicios gestionados Dispositivo como servicio (DaaS) en Oriente Medio por tamaño de organizaciónPYMESGrandes empresasDispositivo como servicio (DaaS) en Oriente Medio por sectores industrialesTI y TelecomunicacionesBFSISaludVenta minoristaGobiernoEducaciónManufacturaOtrosPerspectivas de África (miles de millones de USD, 2018-2030)Dispositivo como servicio en África por ComponenteHardwareEscritorioPortátilImpresorasOtrosSoluciónServiciosServicios profesionales

  • Servicios gestionados en África: Dispositivo como servicio por tamaño de organización

    • PYMES

    • Grandes empresas Empresas

  • Dispositivo como servicio (DaaS) en África por sectores industriales

    • TI y Telecomunicaciones

    • BFSI

    • Salud

    • Venta minorista

    • Gobierno

    • Educación

    • Manufactura

    • Otros

  • Perspectivas para América Latina (miles de millones de USD, 2018-2030)

  • Dispositivo como servicio en América Latina por Componente

    • Hardware

      • Escritorio

      • Portátil

      • Impresoras

      • Otros

    • Solución

    • Servicios

      • Servicios Profesionales

  • Servicios Gestionados Dispositivo como Servicio en Latinoamérica por Tamaño de la Organización

    • PYMES

    • Grandes Empresas

  • Dispositivo como Servicio (DSS) en América Latina por Sectores Industriales

    • TI y Telecomunicaciones

    • BFSI

    • Salud

    • Venta Minorista

    • Gobierno

    • Educación

    • Manufactura

    • Otros

Download PDF ×

We do not share your information with anyone. However, we may send you emails based on your report interest from time to time. You may contact us at any time to opt-out.