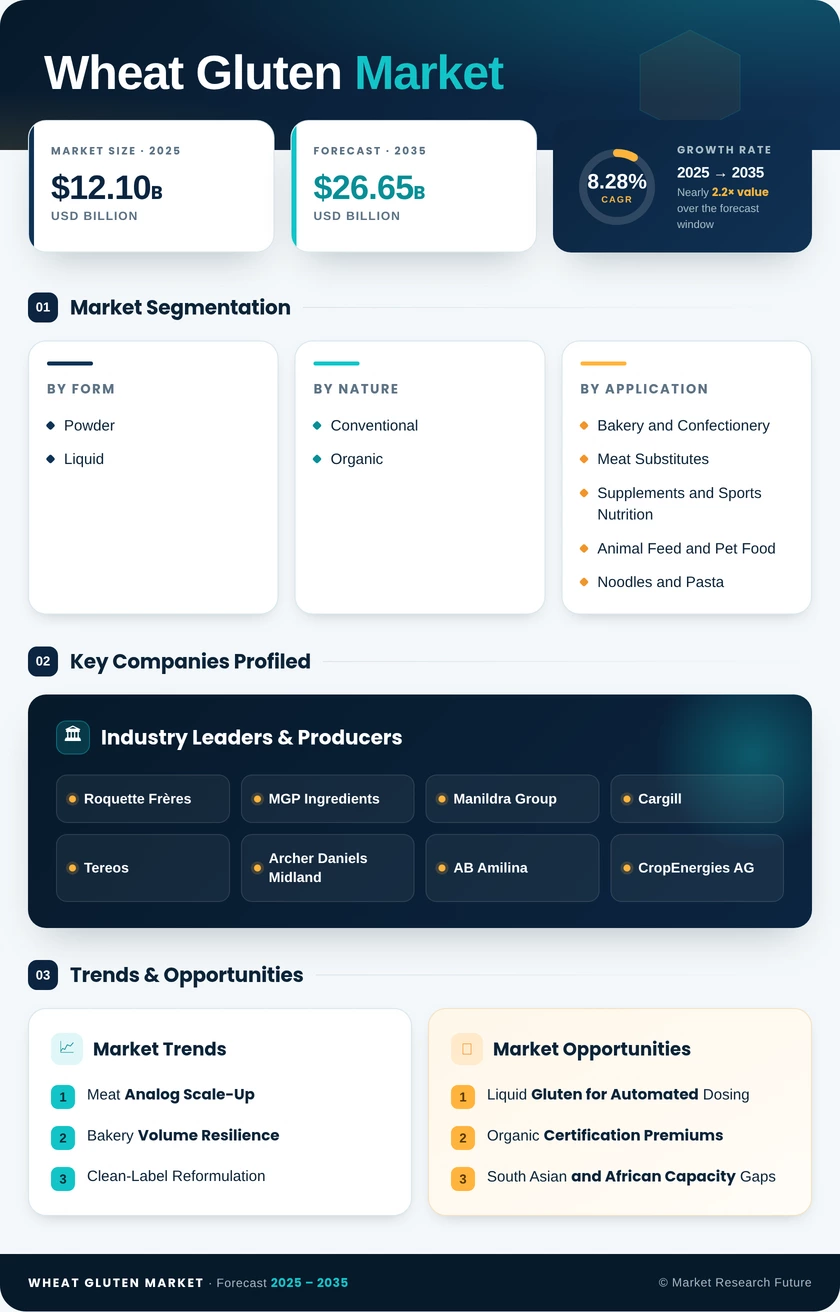
Wheat Gluten Market (2026 - 2035)

ID: MRFR/FnB/4791-HCR 100 Pages Snehal Singh Last Updated: September 15, 2026
Wheat Gluten Market Size, Share, Industry Trend & Analysis Research Report Information By Form (Liquid, Powder), By Nature (Organic, Conventional), By Application (Bakery and Confectionery, Supplements and Sports Nutrition, Animal Feed and Pet Food, Meat Substitutes, Noodles and Pasta, Others), By Region (North America, Europe, Asia-Pacific, South America, Middle East & Africa) – Forecast Till 2035
Wheat Gluten Market
Market Size
Forecast Period2026-2035
CAGR (2026-2035)8.28%
2025 Market SizeUSD 12.10 Billion
2035 Market SizeUSD 26.65 Billion
Key Players
Roquette Frères
MGP Ingredients
Manildra Group
Cargill
Tereos
Archer Daniels Midland
Opportunities
  • Liquid Gluten for Automated Dosing
  • Organic Certification Premiums
  • South Asian and African Capacity Gaps
  1. 1 Market Summary |
    1. 1.1 Study Assumptions & Market Definition |
    2. 1.2 Scope of the Study |
    3. 1.3 Research Methodology
  2. 2 Key Report Takeaways |
    1. 2.1 By Form |
    2. 2.2 By Nature |
    3. 2.3 By Application |
    4. 2.4 By Region
  3. 3 Market Size & Forecast (2021–2035) |
    1. 3.1 Historical Market Size (2021–2024) |
    2. 3.2 Base Year Assessment (2025) |
    3. 3.3 Forecast Market Size (2026–2035) |
    4. 3.4 Year-over-Year Growth Analysis
  4. 4 Driver Impact Analysis |
    1. 4.1 Meat Analog Scale-Up |
    2. 4.2 Bakery Volume Resilience |
    3. 4.3 Clean-Label Reformulation |
    4. 4.4 Feed and Pet Food Substitution
  5. 5 Restraints Impact Analysis |
    1. 5.1 Gluten Avoidance Behaviour |
    2. 5.2 Feedstock Volatility |
    3. 5.3 Alternative Protein Competition
  6. 6 Opportunities |
    1. 6.1 Liquid Gluten for Automated Dosing |
    2. 6.2 Organic Certification Premiums |
    3. 6.3 South Asian and African Capacity Gaps |
    4. 6.4 Functionality-as-a-Service Models |
    5. 6.5 Co-Product Valorisation
  7. 7 Regional Market Share & Country-Level Analysis |
    1. 7.1 North America | |
      1. 7.1.1 US | |
      2. 7.1.2 Canada | |
      3. 7.1.3 Mexico |
    2. 7.2 Europe | |
      1. 7.2.1 Germany | |
      2. 7.2.2 UK | |
      3. 7.2.3 France | |
      4. 7.2.4 Italy | |
      5. 7.2.5 Spain | |
      6. 7.2.6 Nordic Countries | |
      7. 7.2.7 Russia | |
      8. 7.2.8 Rest of Europe |
    3. 7.3 Asia-Pacific | |
      1. 7.3.1 China | |
      2. 7.3.2 India | |
      3. 7.3.3 Japan | |
      4. 7.3.4 South Korea | |
      5. 7.3.5 ASEAN | |
      6. 7.3.6 Rest of Asia-Pacific |
    4. 7.4 South America | |
      1. 7.4.1 Brazil | |
      2. 7.4.2 Argentina | |
      3. 7.4.3 Rest of South America |
    5. 7.5 Middle East & Africa | |
      1. 7.5.1 Saudi Arabia | |
      2. 7.5.2 UAE | |
      3. 7.5.3 South Africa | |
      4. 7.5.4 Egypt | |
      5. 7.5.5 Rest of Middle East & Africa
  8. 8 Future Outlook (2026–2035) |
    1. 8.1 Precision Fermentation Convergence |
    2. 8.2 Digital Quality Specification |
    3. 8.3 Decarbonised Drying |
    4. 8.4 Scope 3 Reporting Pressure
  9. 9 Market Segmentation Analysis |
    1. 9.1 By Form | |
      1. 9.1.1 Powder | |
      2. 9.1.2 Liquid |
    2. 9.2 By Nature | |
      1. 9.2.1 Conventional | |
      2. 9.2.2 Organic |
    3. 9.3 By Application | |
      1. 9.3.1 Bakery and Confectionery | |
      2. 9.3.2 Meat Substitutes | |
      3. 9.3.3 Supplements and Sports Nutrition | |
      4. 9.3.4 Animal Feed and Pet Food | |
      5. 9.3.5 Noodles and Pasta | |
      6. 9.3.6 Others
  10. 10 Competitive Landscape |
    1. 10.1 Market Concentration Analysis (2026) |
    2. 10.2 Competitive Benchmarking Matrix |
    3. 10.3 Company Profiles | |
      1. 10.3.1 Roquette Frères | |
      2. 10.3.2 MGP Ingredients | |
      3. 10.3.3 Manildra Group | |
      4. 10.3.4 Cargill | |
      5. 10.3.5 Tereos | |
      6. 10.3.6 Archer Daniels Midland | |
      7. 10.3.7 AB Amilina | |
      8. 10.3.8 CropEnergies AG | |
      9. 10.3.9 Sedamyl | |
      10. 10.3.10 Crespel & Deiters | |
      11. 10.3.11 Permolex | |
      12. 10.3.12 Agrana Beteiligungs-AG
  11. 11 Recent News & Developments
  12. 12 Report Scope & Methodology |
    1. 12.1 Study Period & Base Year |
    2. 12.2 Valuation Currency |
    3. 12.3 Abbreviations
  13. 13 Detailed Sources & Citations
  14. 14 Frequently Asked Questions
  15. 15 LIST OF TABLES |
  16. TABLE 1 Global Wheat Gluten Market Size & Forecast, by Revenue (USD Billion), 2021–2035 |
  17. TABLE 2 Global Wheat Gluten Market – Year-over-Year Growth Analysis, 2021–2035 |
  18. TABLE 3 Driver Impact Analysis Matrix, 2026–2035 |
  19. TABLE 4 Restraint Impact Analysis Matrix, 2026–2035 |
  20. TABLE 5 Global Wheat Gluten Market Size, by Region, 2021–2035 (USD Billion) |
  21. TABLE 6 North America Wheat Gluten Market Size, by Country, 2021–2035 (USD Billion) |
  22. TABLE 7 Europe Wheat Gluten Market Size, by Country, 2021–2035 (USD Billion) |
  23. TABLE 8 Asia-Pacific Wheat Gluten Market Size, by Country, 2021–2035 (USD Billion) |
  24. TABLE 9 South America Wheat Gluten Market Size, by Country, 2021–2035 (USD Billion) |
  25. TABLE 10 Middle East & Africa Wheat Gluten Market Size, by Country, 2021–2035 (USD Billion) |
  26. TABLE 11 Global Wheat Gluten Market Size, by Form, 2021–2035 (USD Billion) |
  27. TABLE 12 Global Wheat Gluten Market Size, by Nature, 2021–2035 (USD Billion) |
  28. TABLE 13 Global Wheat Gluten Market Size, by Application, 2021–2035 (USD Billion) |
  29. TABLE 14 North America Wheat Gluten Market Size, by Form, Nature and Application, 2021–2035 (USD Billion) |
  30. TABLE 15 Europe Wheat Gluten Market Size, by Form, Nature and Application, 2021–2035 (USD Billion) |
  31. TABLE 16 Asia-Pacific Wheat Gluten Market Size, by Form, Nature and Application, 2021–2035 (USD Billion) |
  32. TABLE 17 South America Wheat Gluten Market Size, by Form, Nature and Application, 2021–2035 (USD Billion) |
  33. TABLE 18 Middle East & Africa Wheat Gluten Market Size, by Form, Nature and Application, 2021–2035 (USD Billion) |
  34. TABLE 19 Competitive Benchmarking Matrix – Global Wheat Gluten Market, 2026 |
  35. TABLE 20 Company Profiles – Key Players, Global Wheat Gluten Market |
  36. TABLE 21 Recent Developments & Strategic Announcements, 2023–2025 |
  37. TABLE 22 Report Scope & Methodology Summary |
  38. TABLE 23 Detailed Sources & Citations Index
  39. 16 LIST OF FIGURES |
  40. FIGURE 1 Global Wheat Gluten Market – Market Dynamics Overview (Drivers, Restraints, Opportunities) |
  41. FIGURE 2 Industry Value Chain Analysis – Wheat Milling to Functional Ingredient |
  42. FIGURE 3 Porter's Five Forces Analysis – Global Wheat Gluten Market |
  43. FIGURE 4 Global Market Size Trend & Forecast (USD Billion), 2021–2035 |
  44. FIGURE 5 Year-over-Year Growth Trajectory, 2022–2035 |
  45. FIGURE 6 Market Share by Form, 2025 vs 2035 |
  46. FIGURE 7 Market Share by Nature, 2025 vs 2035 |
  47. FIGURE 8 Market Share by Application, 2025 vs 2035 |
  48. FIGURE 9 Regional Market Share Distribution, 2025 |
  49. FIGURE 10 Regional Growth Rate Comparison (CAGR), 2026–2035 |
  50. FIGURE 11 Country-Level Contribution Heat Map, 2025 |
  51. FIGURE 12 Competitive Landscape – Revenue Share Distribution, 2026 |
  52. FIGURE 13 Competitive Positioning Matrix – Scale vs Functional Specialisation |
  53. FIGURE 14 Pricing and Feedstock Correlation Analysis, 2021–2025

Segmentation Quick Reference

DimensionSub-SegmentsDominant SegmentFastest Growing Segment
By FormLiquid; PowderPowderLiquid
By NatureOrganic; ConventionalConventionalOrganic
By ApplicationBakery and Confectionery; Supplements and Sports Nutrition; Animal Feed and Pet Food; Meat Substitutes; Noodles and Pasta; OthersBakery and ConfectioneryMeat Substitutes
By RegionNorth America; Europe; Asia-Pacific; South America; Middle East & AfricaNorth AmericaAsia-Pacific


Market Segmentation Overview

By Form

Sub-SegmentKey Trend
PowderRemains the export and long-haul default on ambient stability and freight efficiency
LiquidGains share in dense bakery clusters where dosing automation removes hydration steps


Form choice is fundamentally a logistics decision rather than a functionality one. Producers serving local industrial customers are adding liquid lines as an incremental revenue layer, while export-oriented operations continue to invest in drying efficiency instead.

By Nature

Sub-SegmentKey Trend
ConventionalAnchors volume economics with commodity-scale sourcing and continuous campaigns
OrganicExpands on natural-channel premiums despite constrained certified wheat supply


Organic capacity growth is gated upstream. Until certified organic wheat availability improves materially, campaign scheduling and changeover yield losses will keep organic a premium niche rather than a volume segment.

By Application

Sub-SegmentKey Trend
Bakery and ConfectioneryFortification rates rise as incoming wheat protein averages drift lower
Meat SubstitutesExtrusion capacity additions convert directly into contracted gluten offtake
Supplements and Sports NutritionHydrolysed and isolate grades gain traction in cost-sensitive protein blends
Animal Feed and Pet FoodAquafeed formulators substitute fishmeal with digestible plant protein carriers
Noodles and PastaAsian producers standardise inclusion to control cooking loss and bite
OthersAdhesive, film, and biopolymer applications remain small but margin-accretive


Application mix determines margin quality more than volume. Bakery and noodles deliver predictable baseload utilisation, while analog and supplement channels supply the pricing upside that justifies specialty processing investment.

By Region

Sub-SegmentKey Trend
North AmericaAnalog and nutrition manufacturing density sustains premium-grade demand
EuropeEnergy efficiency and co-product valorisation define competitive advantage
Asia-PacificNoodle fortification and aquafeed drive the fastest regional expansion
South AmericaFeed substitution economics dominate offtake patterns
Middle East & AfricaImport substitution and bread program fortification create new demand pools


Geographic advantage tracks the overlap between wheat processing assets and industrial food manufacturing. Regions holding both — North America, Western Europe, and increasingly eastern China — capture disproportionate value across the chain.




Download PDF ×

We do not share your information with anyone. However, we may send you emails based on your report interest from time to time. You may contact us at any time to opt-out.