

US Healthcare Market Segmentation
Healthcare By Application (USD Million, 2025-2035)
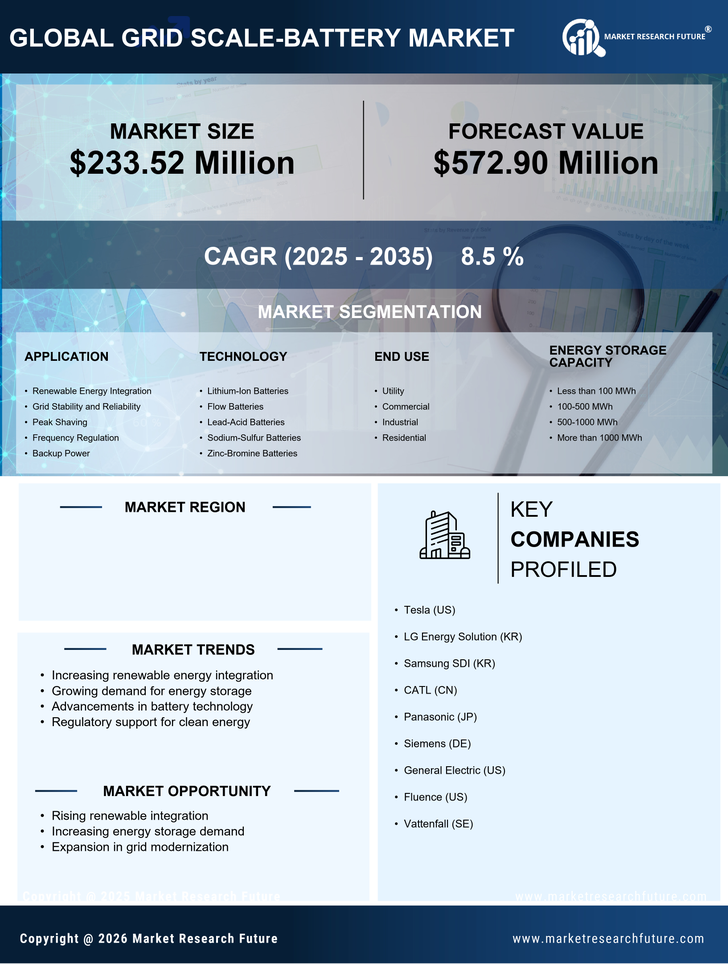
- Renewable Energy Integration
- Grid Stability and Reliability
- Peak Shaving
- Frequency Regulation
- Backup Power
Healthcare By Technology (USD Million, 2025-2035)
- Lithium-Ion Batteries
- Flow Batteries
- Lead-Acid Batteries
- Sodium-Sulfur Batteries
- Zinc-Bromine Batteries
Healthcare By End Use (USD Million, 2025-2035)
- Utility
- Commercial
- Industrial
- Residential
Healthcare By Energy Storage Capacity (USD Million, 2025-2035)
- Less than 100 MWh
- 100-500 MWh
- 500-1000 MWh
- More than 1000 MWh


