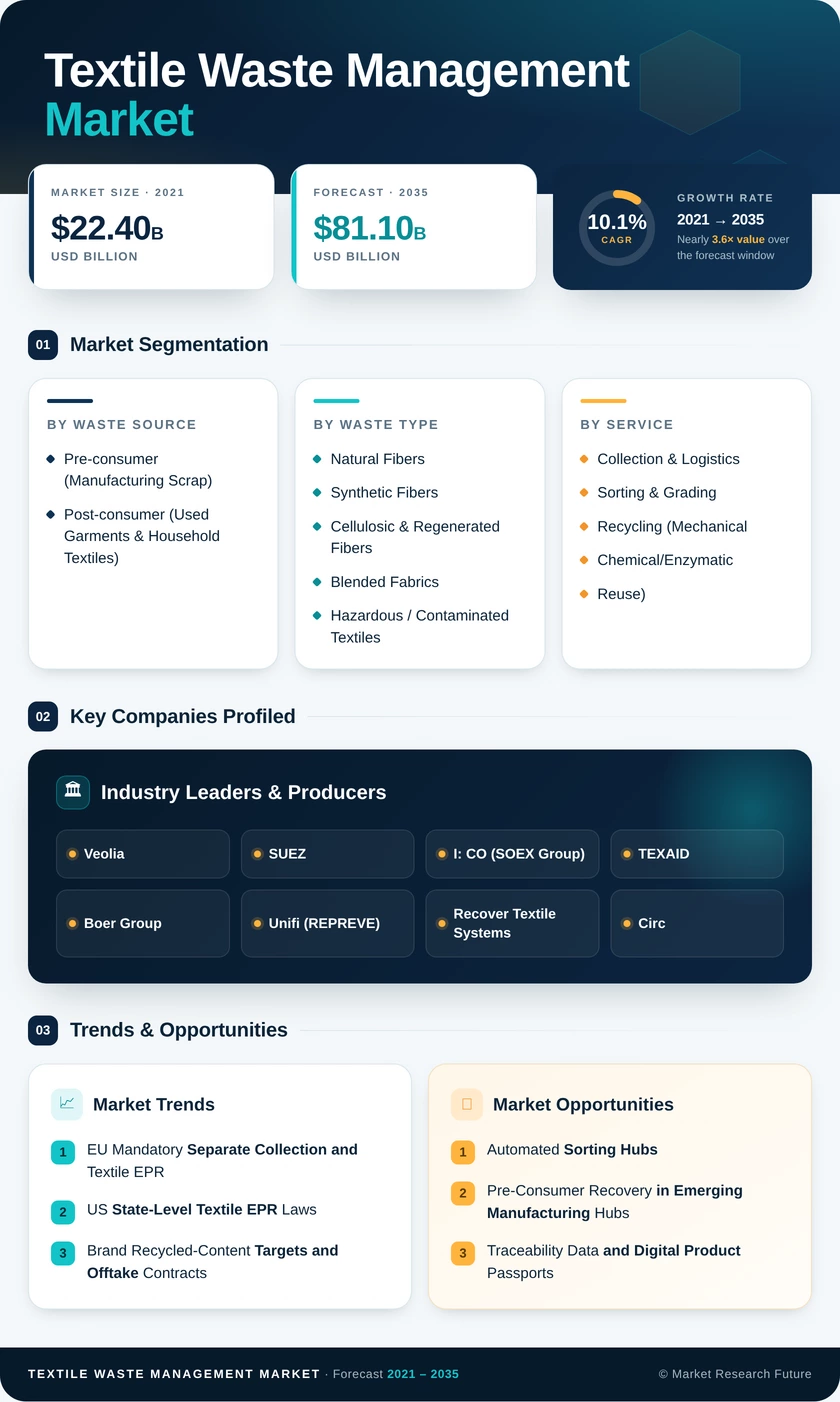
Textile Waste Management Market (2026 - 2035)

ID: MRFR/Equip/41080-HCR 200 Pages Garvit Vyas Last Updated: October 21, 2026
Textile Waste Management Market Research Report By Waste Source (Pre-consumer (Manufacturing Scrap), Post-consumer (Used Garments & Household Textiles)), By Waste Type (Natural Fibers, Synthetic Fibers, Cellulosic & Regenerated Fibers, Blended Fabrics, Hazardous / Contaminated Textiles), By Service (Collection & Logistics, Sorting & Grading, Recycling (Mechanical, Chemical/Enzymatic, Reuse), Energy Recovery (Incineration & WtE), Landfill / Open Dumping), By End-User (Residential / Household, Commercial & Institutional (Retail, Hospitality), Industrial Manufacturing (Apparel & Footwear), Others (Municipal Garbage, Medical Facilities, etc.)) - Forecast to 2035
Textile Waste Management Market
Market Size
Forecast Period2026-2035
CAGR (2026-2035)10.1%
2025 Market SizeUSD 31.0 Billion
2035 Market SizeUSD 81.1 Billion
Key Players
Veolia
SUEZ
I: CO
TEXAID
Boer Group
Unifi
Opportunities
  • Automated Sorting Hubs
  • Pre-Consumer Recovery in Emerging Manufacturing Hubs
  • Traceability Data and Digital Product Passports
  1. 1 Market Summary | |
  2. 2 Key Report Takeaways | |
    1. 2.1 By Waste Source | |
    2. 2.2 By Waste Type | |
    3. 2.3 By Service | |
    4. 2.4 By End-User | |
    5. 2.5 By Region | |
  3. 3 Market Size and Forecast (2021–2035) | |
    1. 3.1 Historical Market Size (2021–2024) | |
    2. 3.2 Base Year Market Size (2025) | |
    3. 3.3 Forecast Market Size (2026–2035) | |
  4. 4 Driver Impact Analysis | |
    1. 4.1 EU Mandatory Separate Collection and Textile EPR | |
    2. 4.2 US State-Level Textile EPR Laws | |
    3. 4.3 Brand Recycled-Content Targets and Offtake Contracts | |
    4. 4.4 Chemical and Enzymatic Recycling Scale-Up | |
    5. 4.5 Formalization of Pre-Consumer Waste in Asian Clusters | |
    6. 4.6 EU Ecodesign Regulation and Unsold-Goods Destruction Ban | |
  5. 5 Restraints Impact Analysis | |
    1. 5.1 Blended-Fiber Sorting and Pre-Processing Complexity | |
    2. 5.2 Weak Price Parity of Recycled Fiber Versus Virgin Polyester | |
    3. 5.3 Capital Intensity and Project-Financing Risk | |
    4. 5.4 Informal Collection and Exports of Used Clothing | |
    5. 5.5 Contamination and Hazardous Chemical Residues | |
  6. 6 Opportunities | |
    1. 6.1 Automated Sorting Hubs | |
    2. 6.2 Pre-Consumer Recovery in Emerging Manufacturing Hubs | |
    3. 6.3 Traceability Data and Digital Product Passports | |
    4. 6.4 Resale, Repair and Reuse Platforms | |
    5. 6.5 Gulf Landfill-Diversion Programs | |
  7. 7 Regional Market Share and Country-Level Analysis | |
    1. 7.1 North America | | |
      1. 7.1.1 United States | | |
      2. 7.1.2 Canada | | |
      3. 7.1.3 Mexico | |
    2. 7.2 Europe | | |
      1. 7.2.1 Germany | | |
      2. 7.2.2 France | | |
      3. 7.2.3 United Kingdom | | |
      4. 7.2.4 Italy | | |
      5. 7.2.5 Spain | | |
      6. 7.2.6 BENELUX (Belgium, Netherlands, and Luxembourg) | | |
      7. 7.2.7 NORDICS (Denmark, Finland, Iceland, Norway, and Sweden) | | |
      8. 7.2.8 Rest of Europe | |
    3. 7.3 Asia-Pacific | | |
      1. 7.3.1 China | | |
      2. 7.3.2 Japan | | |
      3. 7.3.3 India | | |
      4. 7.3.4 Bangladesh | | |
      5. 7.3.5 South Korea | | |
      6. 7.3.6 ASEAN (Indonesia, Thailand, Philippines, Malaysia, Vietnam) | | |
      7. 7.3.7 Rest of Asia-Pacific | |
    4. 7.4 South America | | |
      1. 7.4.1 Brazil | | |
      2. 7.4.2 Argentina | | |
      3. 7.4.3 Rest of South America | |
    5. 7.5 Middle East and Africa | | |
      1. 7.5.1 Saudi Arabia | | |
      2. 7.5.2 United Arab Emirates | | |
      3. 7.5.3 Turkey | | |
      4. 7.5.4 Egypt | | |
      5. 7.5.5 South Africa | | |
      6. 7.5.6 Rest of Middle East and Africa | |
  8. 8 Future Outlook (2026–2035) | |
    1. 8.1 AI-Driven Sorting and Robotic Pre-Processing | |
    2. 8.2 Offtake-Backed Plant Economics | |
    3. 8.3 EPR Fee Modulation and Policy Convergence | |
    4. 8.4 Carbon Accounting and ESG Disclosure | |
  9. 9 Segmentation Analysis | |
    1. 9.1 By Waste Source | | |
      1. 9.1.1 Pre-consumer (Manufacturing Scrap) | | |
      2. 9.1.2 Post-consumer (Used Garments & Household Textiles) | |
    2. 9.2 By Waste Type | | |
      1. 9.2.1 Natural Fibers | | |
      2. 9.2.2 Synthetic Fibers | | |
      3. 9.2.3 Cellulosic & Regenerated Fibers | | |
      4. 9.2.4 Blended Fabrics | | |
      5. 9.2.5 Hazardous / Contaminated Textiles | |
    3. 9.3 By Service | | |
      1. 9.3.1 Collection & Logistics | | |
      2. 9.3.2 Sorting & Grading | | |
      3. 9.3.3 Recycling (Mechanical, Chemical/Enzymatic, Reuse) | | |
      4. 9.3.4 Energy Recovery (Incineration & WtE) | | |
      5. 9.3.5 Landfill / Open Dumping | |
    4. 9.4 By End-User | | |
      1. 9.4.1 Residential / Household | | |
      2. 9.4.2 Commercial & Institutional (Retail, Hospitality) | | |
      3. 9.4.3 Industrial Manufacturing (Apparel & Footwear) | | |
      4. 9.4.4 Others (Municipal Garbage, Medical Facilities, etc.) | |
  10. 10 Competitive Landscape | |
    1. 10.1 Market Concentration Analysis | |
    2. 10.2 Competitive Benchmarking Matrix | |
    3. 10.3 Company Profiles | | |
      1. 10.3.1 Veolia | | |
      2. 10.3.2 SUEZ | | |
      3. 10.3.3 I: CO (SOEX Group) | | |
      4. 10.3.4 TEXAID | | |
      5. 10.3.5 Boer Group | | |
      6. 10.3.6 Unifi | | |
      7. 10.3.7 Recover Textile Systems | | |
      8. 10.3.8 Infinited Fiber Company | | |
      9. 10.3.9 Circ | | |
      10. 10.3.10 Worn Again Technologies | |
  11. 11 Recent News & Developments | |
  12. 12 Report Scope and Methodology | |
  13. 13 Detailed Sources and Citations | |
  14. 14 Frequently Asked Questions (FAQs) | | LIST OF TABLES | |
  15. TABLE 1 Global Market Size & Forecast, by Revenue (USD Billion), 2021–2035 | |
  16. TABLE 2 Year-over-Year Growth Analysis, 2021–2035 | |
  17. TABLE 3 Driver Impact Analysis | |
  18. TABLE 4 Restraints Impact Analysis | |
  19. TABLE 5 Regional Summary, 2025 | |
  20. TABLE 6 North America Market, by Country, 2025 | |
  21. TABLE 7 Europe Market, by Country, 2025 | |
  22. TABLE 8 Asia-Pacific Market, by Country, 2025 | |
  23. TABLE 9 South America Market, by Country, 2025 | |
  24. TABLE 10 Middle East and Africa Market, by Country, 2025 | |
  25. TABLE 11 Market Segmentation, by Waste Source, 2025 | |
  26. TABLE 12 Market Segmentation, by Waste Type, 2025 | |
  27. TABLE 13 Market Segmentation, by Service, 2025 | |
  28. TABLE 14 Market Segmentation, by End-User, 2025 | |
  29. TABLE 15 Competitive Benchmarking Matrix, 2025 | |
  30. TABLE 16 Report Scope and Methodology | |
  31. TABLE 17 Detailed Sources and Citations | | LIST OF FIGURES | |
  32. FIGURE 1 Market Dynamics Overview (Drivers, Restraints, Opportunities) | |
  33. FIGURE 2 Textile Waste Value Chain Analysis | |
  34. FIGURE 3 Porter's Five Forces Analysis | |
  35. FIGURE 4 Global Market Size Trend, 2021–2035 (USD Billion) | |
  36. FIGURE 5 Market Share, by Waste Source, 2025 | |
  37. FIGURE 6 Market Share, by Waste Type, 2025 | |
  38. FIGURE 7 Market Share, by Service, 2025 | |
  39. FIGURE 8 Market Share, by End-User, 2025 | |
  40. FIGURE 9 Regional Market Share, 2025 | |
  41. FIGURE 10 Regional CAGR Comparison, 2026–2035 | |
  42. FIGURE 11 Competitive Landscape – Revenue Share Ranges, 2025 | |
  43. FIGURE 12 Recent Strategic Developments Timeline, 2023–2025

Segmentation Quick Reference

DimensionSub-SegmentsDominant SegmentFastest Growing Segment
By Waste SourcePre-consumer (Manufacturing Scrap); Post-consumer (Used Garments & Household Textiles)Pre-consumer (Manufacturing Scrap) (66.4% share)Post-consumer (Used Garments & Household Textiles) (10.3% CAGR)
By Waste TypeNatural Fibers; Synthetic Fibers; Cellulosic & Regenerated Fibers; Blended Fabrics; Hazardous / Contaminated TextilesSynthetic Fibers (50.4% share)Cellulosic & Regenerated Fibers (9.2% CAGR)
By ServiceCollection & Logistics; Sorting & Grading; Recycling (Mechanical, Chemical/Enzymatic, Reuse); Energy Recovery (Incineration & WtE); Landfill / Open DumpingLandfill / Open Dumping (50.6% share)Recycling (Mechanical, Chemical/Enzymatic, Reuse) (10.7% CAGR)
By End-UserResidential / Household; Commercial & Institutional (Retail, Hospitality); Industrial Manufacturing (Apparel & Footwear); Others (Municipal Garbage, Medical Facilities, etc.)Industrial Manufacturing (Apparel & Footwear) (57.0% share)Residential / Household (13.1% CAGR)
By RegionNorth America; Europe; Asia-Pacific; South America; Middle East and AfricaAsia-Pacific (44.8% share)Middle East and Africa (12.6% CAGR)

Market Segmentation Overview

By Waste Source

Sub-SegmentKey Trend
Pre-consumer (Manufacturing Scrap)Factory scrap channeled into traceable mechanical recycling
Post-consumer (Used Garments & Household Textiles)Separate household collection under EPR mandates

Pre-consumer (Manufacturing Scrap) leads with a 66.4% share because cutting-room offcuts are clean, single-fiber and concentrated in garment clusters, which keeps baling and transport costs low. Post-consumer (Used Garments & Household Textiles) grows faster at a 10.3% CAGR as EU and US collection mandates pull household garments into formal channels. Its mixed blends and trims make it the main target for automated sorting investment.

By Waste Type

Sub-SegmentKey Trend
Natural FibersCotton scrap feeding mechanical recycled yarn
Synthetic FibersPolyester depolymerization adapted from bottle lines
Cellulosic & Regenerated FibersCotton-to-pulp routes for viscose and lyocell
Blended FabricsPolycotton separation moving from pilot to plant
Hazardous / Contaminated TextilesStricter handling of medical and chemically treated textiles

Synthetic Fibers dominate with a 50.4% share because polyester is the most common apparel fiber, yet textile-to-textile polyester recycling remains far smaller than bottle-based supply. Cellulosic & Regenerated Fibers grow fastest at a 9.2% CAGR, as dissolving-pulp processes turn cotton waste into viscose/rayon and lyocell / modal feedstock. Blended Fabrics remain the hardest technical challenge, which is why blend-separation specialists attract brand investment.

By Service

Sub-SegmentKey Trend
Collection & LogisticsEPR-funded containers and curbside routes
Sorting & GradingNIR and AI-based fiber identification
Recycling (Mechanical, Chemical/Enzymatic, Reuse)Brand offtakes underwriting fiber-to-fiber capacity
Energy Recovery (Incineration & WtE)Residual fractions under carbon-price pressure
Landfill / Open DumpingShare declining as gate fees and restrictions rise

Landfill / Open Dumping still handles a 50.6% share, reflecting weak infrastructure across emerging markets and the absence of collection in many cities. Recycling (Mechanical, Chemical/Enzymatic, Reuse) is the fastest-growing service at a 10.7% CAGR because take-or-pay contracts from brands reduce financing risk for new plants. Sorting & Grading capacity has to expand in step, since recyclers need fiber-specific bales to hit quality targets.

By End-User

Sub-SegmentKey Trend
Residential / HouseholdMandatory separate collection drives volume growth
Commercial & Institutional (Retail, Hospitality)Retail take-back and hotel linen recovery
Industrial Manufacturing (Apparel & Footwear)In-house scrap diversion as a production KPI
Others (Municipal Garbage, Medical Facilities, etc.)Regulated handling of medical and municipal textiles

Industrial Manufacturing (Apparel & Footwear) leads with a 57.0% share because mills generate steady, predictable scrap and face brand audits on waste diversion. Residential / Household grows fastest at a 13.1% CAGR as separate collection reaches households across Europe and pilot US states. Commercial & Institutional (Retail, Hospitality) sits between the two, with retailers adding take-back services to meet the EU ban on destroying unsold goods.


Download PDF ×

We do not share your information with anyone. However, we may send you emails based on your report interest from time to time. You may contact us at any time to opt-out.