Surfactants Market (2026 - 2035)

Surfactants Market Research Report Information By Substrate (Bio-based Surfactants and Biosurfactants(Glycolipids, Fatty Acids, Phospholipids, and Neutral Fats, Lipopeptides, and Polymeric Biosurfactants) Chemically Synthesized Bio-Based, Synthetic Surfactants), By Type (Cationic surfactants, Anionic surfactants(Linear alkyl benzene sulfonates, Fatty alcohol ether sulfates, Fatty alcohol sulfates, Sulfosuccinates), Non-Ionic Surfactants(Fatty Alcohol Ethoxylates), Alkyl Phenol Ethoxylates(Others) , and Amphoteric surfactants), By Application (Surface cleaners, Hair care, Skin care, Sanitizers, Emulsifiers, Dispersing Agents and Others), BY END-USE INDUSTRY (Household detergents, Personal Care, Institutional and Industrial Cleaners, Food Processing, Oilfield Chemicals, Agricultural Chemicals, Textiles, plastics, Paints and Coatings, adhesives and Others), and Region - Forecast till 2035
ID: MRFR/CnM/0913-CR
111 Pages
Chitranshi Jaiswal
Last Updated: June 27, 2026
Surfactants Market

Market Size

Forecast Period2026-2035
CAGR (2026-2035)3.60%
2025 Market SizeUSD 42,500 Million
2035 Market SizeUSD 60,530 Million

Key Players

BASF SE
Dow Inc.
Evonik Industries AG
Huntsman Corporation
Clariant AG
Croda International
Opportunities
  • Biosurfactant Scale-Up Through Fermentation Technology
  • Personal-Care Premiumization in Asia-Pacific
  • Oilfield and Enhanced Oil Recovery Applications

Surfactants Market Summary

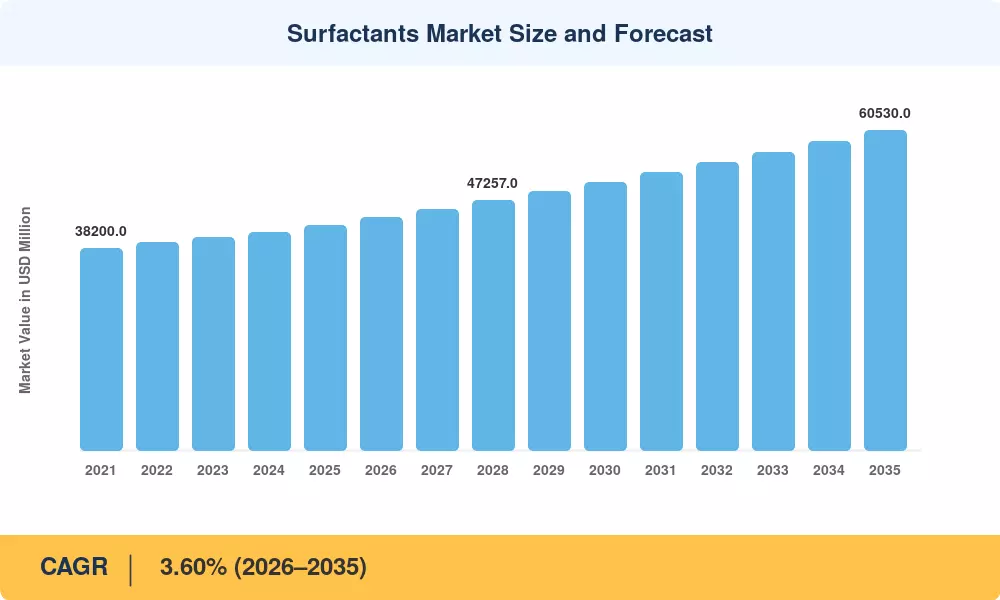
The global Surfactants Market reached an estimated USD 42,500 Million in 2025 and is projected to grow from USD 44,030 Million in 2026 to USD 60,530 Million by 2035, registering a compound annual growth rate of 3.60% during the forecast period. This expansion reflects rising demand across household cleaning, personal hygiene, and industrial process applications, underpinned by tightening sustainability regulations in the European Union and North America that are pushing formulators toward greener chemistries. The EU's revised Detergents Regulation and the U.S. EPA's Safer Choice program have accelerated reformulation timelines, creating a sustained pull for compliant raw materials [1].

A significant technology shift is reshaping the Surfactants Market as conventional petroleum-derived formulations give way to bio-based and enzymatic alternatives. Global investment in oleochemical refining capacity exceeded USD 2.8 billion between 2022 and 2024, with Southeast Asian palm-kernel and coconut-oil processing hubs attracting the largest share of capital [2]. Cold-water detergent platforms now account for a growing slice of laundry product launches in Europe, reducing energy intensity per wash cycle by roughly 30% and demanding surfactant architectures that perform effectively at temperatures below 30 °C [3].

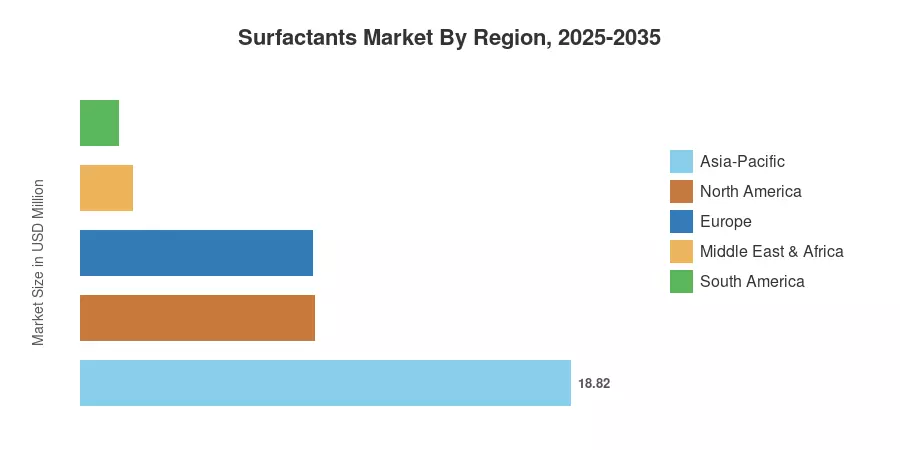
Asia-Pacific commands the largest share of the Surfactants Market at approximately 44.8% of global revenue in 2025, driven by population-scale consumption in China and India. The region is also the fastest-growing, with an anticipated CAGR of 4.60% through 2035 as urbanization and rising disposable incomes lift per-capita cleaning-product expenditure. Europe holds the second-largest position at around 21.2% share, anchored by mature personal-care and institutional-cleaning verticals. North America contributes roughly 22.5%, supported by strong industrial and oilfield-service demand. These regional dynamics will continue to shape competitive positioning and capacity-investment decisions across the next decade.


Key Report Takeaways

• By Type

  • Anionic surfactants accounted for approximately 44.2% of the global Surfactants Market share in 2025, underpinned by their dominant role in household and industrial cleaning formulations.
  • Amphoteric surfactants are forecast to grow at the fastest pace through 2035, reflecting rising demand in mild personal-care and baby-product segments.
  • Cationic surfactants generated approximately USD 5,100 Million in 2025, driven by fabric-softener and hair-conditioning applications.

• By Application

  • Household soap and detergent applications represented roughly 46.3% of the Surfactants Market revenue in 2025, reinforcing the category's position as the single largest demand pool.
  • Personal-care product applications are expected to register the highest CAGR of 5.00% through 2035, supported by premiumization trends in skincare and haircare.

• By Region

  • Asia-Pacific led the Surfactants Market with a 44.8% revenue share in 2025 and is projected to maintain the fastest regional growth trajectory through 2035.
  • North America contributed approximately USD 9,560 Million in 2025, with oilfield-chemicals and institutional-cleaning segments providing additional demand resilience.


Market Size and Forecast (2021–2035)

Market Research Future's proprietary estimation framework integrates primary interviews with surfactant producers and downstream formulators, secondary data from trade associations (CESIO, SDA, ICIS), and import-export databases to construct historical baselines and calibrate forward projections. Forecast-period values reflect a constant 3.60% CAGR applied uniformly, with qualitative adjustments noted for years affected by raw-material price shocks or pandemic-era demand anomalies.

Surfactants Market Size and Forecast
Our Impact
Enabled $4.3B Revenue Impact for Fortune 500 and Leading Multinationals
Partnering with 2000+ Global Organizations Each Year
30K+ Citations by Top-Tier Firms in the Industry

Driver Impact Analysis

Driver ~% Impact on CAGR Geographic Relevance Impact Timeline
Rising hygiene and sanitation awareness ~18% Global Short-term (≤2 yr)
Bio-based feedstock adoption mandates ~16% Europe, North America Medium-term (2–4 yr)
Cold-water detergent reformulation wave ~14% Europe, Asia-Pacific Medium-term (2–4 yr)
Premiumization in personal-care segments ~13% Global Long-term (≥4 yr)
Urbanization and FMCG penetration in emerging economies ~15% Asia-Pacific, South America Long-term (≥4 yr)
Oilfield-chemicals demand recovery ~12% North America, the Middle East Short-term (≤2 yr)
Industrial automation in cleaning operations ~12% Europe, North America Medium-term (2–4 yr)


Rising Hygiene and Sanitation Awareness

Post-pandemic behavioral shifts permanently elevated baseline consumption of hand soaps, surface disinfectants, and antibacterial washes. WHO data indicate that global hand-soap consumption per capita rose by approximately 22% between 2019 and 2023, with no sign of reverting to pre-2020 levels [4]. This sustained behavioral change directly benefits the Surfactants Market by expanding the addressable volume in both developed and developing economies.

Bio-Based Feedstock Adoption Mandates

Reformulation away from some historical chemistries is essentially required by the European Commission's updated Detergents Regulation, which mandates that all consumer cleaning products supplied within the EU satisfy improved biodegradability and aquatic-toxicity levels by 2027 [1]. In response, formulators are using methyl ester sulfonates and alkyl polyglucosides made from renewable palm kernel and coconut oils. At the expense of strictly petrochemical methods, this regulatory drive is driving the surfactants market toward greener product architectures.


Cold-Water Detergent Reformulation

Laundry detergents that operate at or below 20 °C are currently encouraged by energy-efficiency labeling schemes in Europe and Japan; this requirement necessitates revised surfactant compositions. Launched in 14 European markets, Procter & Gamble's Ariel cold-wash platform is said to have cut home energy use per wash cycle by 30% [3]. The addressable surfactants market in home cleaning is growing as a result of the performance requirements of these formulations, which are driving innovation budgets toward low-temperature-active surfactant chemistries.


Urbanization and FMCG Penetration in Emerging Economies

India's per-capita surfactant consumption stands at roughly 2.1 kg annually, compared with 8.5 kg in the United States and 6.2 kg in Germany [16]. As urban populations in India, Indonesia, and sub-Saharan Africa expand, per-capita cleaning-product usage is converging toward global averages. The resulting volume growth represents one of the most durable long-term tailwinds for the Surfactants Market.


Restraints Impact Analysis

The impact estimates below are directional and represent headwinds that moderate the Surfactants Market growth trajectory. They are not directly subtracted from the headline CAGR.

Restraint ~% Impact on CAGR Geographic Relevance Impact Timeline
Feedstock price volatility (oleochemical and petrochemical) ~−20% Global Short-term (≤2 yr)
China's overcapacity cycles and margin compression ~−18% Asia-Pacific Medium-term (2–4 yr)
Tightening environmental regulations raises compliance costs ~−15% Europe, North America Long-term (≥4 yr)
Substitution threat from enzyme-only cleaning technologies ~−12% Europe Long-term (≥4 yr)
Trade-barrier escalation on palm-derived raw materials ~−10% Global Medium-term (2–4 yr)


Feedstock Price Volatility

Surfactant producers face a dual-feedstock exposure: petrochemical-derived ethylene oxide and oleochemical-derived fatty alcohols. ICIS price-tracking data show that C12–C14 fatty-alcohol spot prices swung by more than 40% between Q1 2022 and Q3 2023, driven by Indonesian palm-oil export levies and shipping-lane disruptions [5]. This volatility compresses margins for midstream producers who lack backward integration and can discourage capital commitments in new Surfactants Market capacity.

China Overcapacity Cycles

Chinese surfactant production capacity expanded by an estimated 1.2 million tonnes between 2020 and 2024, outpacing domestic demand growth and triggering periodic export-price dumping into Southeast Asian and African markets [18]. These cycles depress realized prices for global producers and can delay return-on-investment timelines for new plant construction. The resulting margin uncertainty remains a persistent drag on the Surfactants Market in price-sensitive geographies.

Substitution from Enzyme-Only Cleaning Technologies

Biotechnology advances are enabling concentrated enzyme cocktails that can partially replace surfactant loading in laundry and dishwashing applications. Novozymes' enzymatic platform claims to reduce surfactant dosage requirements by up to 25% without sacrificing cleaning efficacy [14]. While full substitution remains unlikely, incremental dosage reduction at scale represents a material headwind for volume growth in the Surfactants Market over the long term.


Surfactants Market Opportunities

Biosurfactant Scale-Up Through Fermentation Technology

Rhamnolipids and sophorolipids produced via microbial fermentation are transitioning from laboratory curiosities to commercial-scale products. Evonik's rhamnolipid plant in Slovakia, which reached full production in 2024, demonstrates that fermentation-derived molecules can be cost-competitive with petrochemical counterparts at volumes above 10,000 tonnes per year [12]. This trajectory opens new premium tiers within the Surfactants Market for producers that master fermentation economics.

Personal-Care Premiumization in Asia-Pacific

The demand for high-end skincare products, sulfate-free shampoos, and mild face cleansers—which call for high-performance mild surfactant systems—is rising in China, India, and ASEAN countries due to rising middle-class affluence. Through 2035, it is anticipated that the addressable revenue pool for luxury personal-care formulations in Asia-Pacific will grow at twice the rate of mass-market categories.


Oilfield and Enhanced Oil Recovery Applications

Surfactant flooding projects are being expanded by Middle Eastern national oil firms and North American shale producers in an effort to increase recovery rates from older reservoirs. Chemical-enhanced oil recovery methods can increase recovery factors by 5–15 percentage points over waterflooding alone, according to U.S. Department of Energy estimates [17]. This niche allows specialty surfactant producers to earn margin premiums far higher than those of commodity cleaning-grade solutions, expanding the addressable base of the surfactants market.


Digital Formulation Platforms and Data Monetization

AI-driven formulation platforms now allow surfactant producers to offer customers simulation-based product-design tools, compressing development cycles from months to weeks. BASF's digital formulation assistant covers over 4,000 ingredient combinations and has shortened customer trial timelines by approximately 40% [20]. Producers that monetize formulation data through subscription or licensing models can diversify revenue streams beyond commodity chemical sales.

Institutional Cleaning Expansion in Emerging Markets

Rapid hospital, hotel, and food-service construction across sub-Saharan Africa, Southeast Asia, and Latin America is creating institutional-cleaning demand that barely existed a decade ago. The World Bank estimates that developing-country healthcare infrastructure investment will exceed USD 120 billion cumulatively between 2024 and 2030, each new facility requiring ongoing surfactant-intensive sanitation protocols [16].


Surfactants Market Future Outlook

Sustainability Reporting and ESG-Driven Procurement

Corporate ESG commitments are reshaping surfactant procurement criteria. By 2028, an estimated 75% of Fortune 500 consumer-goods companies will require Scope 3 carbon-footprint disclosures from chemical suppliers, per CDP reporting trends [21]. Surfactant producers that invest in lifecycle assessment tools and certified-sustainable feedstock sourcing will capture preferential supplier status in this evolving Surfactants Market landscape.

AI-Accelerated Formulation and Process Optimization

Machine-learning models trained on decades of formulation data are reducing the time required to develop new surfactant blends from 12–18 months to as few as 8–10 weeks. Dow's proprietary AI platform has reportedly screened over 50,000 virtual formulations for automotive-care applications, selecting optimal candidates before any physical lab work begins [20]. This acceleration in R&D productivity will sharpen competitive differentiation in the Surfactants Market.

Circular-Economy Integration

Chemical-recycling initiatives are beginning to produce recycled ethylene oxide and fatty alcohols suitable for surfactant synthesis. The Ellen MacArthur Foundation projects that circular-economy models could supply up to 15% of the European surfactant feedstock pool by 2032 [22]. Producers that establish partnerships with waste-oil recyclers and plastic-to-chemical converters will gain early-mover positioning in a tightening regulatory environment.

Electrification and Green-Hydrogen Linkages

As green-hydrogen production scales, the ethylene-oxide pathway — a critical intermediate for nonionic and anionic surfactant production — could transition toward electrolysis-based ethylene. The IEA estimates global green-hydrogen electrolyzer capacity will reach 130 GW by 2030 [23]. While full integration into the Surfactants Market supply chain remains a decade-horizon prospect, early pilot partnerships between hydrogen producers and oleochemical refiners are already underway in Northern Europe.


Surfactants Market Segmentation

By Type

Segment Key Metric Primary Demand Driver
Anionic Surfactants 44.2% share (2025) Household-cleaning and laundry dominance
Cationic Surfactants USD 5,100 Million (2025) Fabric softeners and hair conditioners
Nonionic Surfactants 3.80% CAGR (2026–2035) Low-foam industrial and institutional applications
Amphoteric Surfactants 4.70% CAGR (2026–2035) Mild personal-care and baby-product formulations


Anionic surfactants remain the workhorse of the Surfactants Market, valued for their strong foaming and cleaning performance at competitive price points. Linear alkylbenzene sulfonates and alcohol ether sulfates together constitute the bulk of this category, serving laundry-detergent and dishwashing-liquid producers worldwide. The segment's maturity means growth largely tracks overall market expansion rather than outpacing it.

Amphoteric surfactants are gaining momentum as personal-care brands reformulate toward sulfate-free and dermatologically mild product lines. Cocamidopropyl betaine, the most widely used amphoteric molecule, has seen procurement volumes rise steadily since 2021 as premium skincare and baby-care brands prioritize gentleness credentials. This category's above-average growth rate through 2035 reflects the premiumization trajectory reshaping the Surfactants Market in developed and emerging economies alike.

By Origin

Segment Key Metric Primary Demand Driver
Synthetic Surfactants 76.3% share (2025) Cost efficiency; established supply chains
Bio-Based Surfactants 4.55% CAGR (2026–2035) Regulatory mandates; consumer sustainability preferences


Synthetic surfactants dominate the Surfactants Market by volume, drawing on well-established petrochemical and oleochemical supply chains that deliver cost advantages at an industrial scale. Ethylene-oxide-derived ethoxylates and petroleum-based LAS grades form the backbone of global production capacity. Despite regulatory headwinds, synthetic variants will retain the majority share through 2035, given their performance-cost profile in commodity cleaning applications.

Bio-based surfactants are the faster-growing origin category, propelled by EU biodegradability mandates and consumer willingness to pay a 10–15% premium for verified-sustainable cleaning products [1]. Alkyl polyglucosides, rhamnolipids, and sophorolipids represent the primary commercial platforms in this space.

By Application

Segment Key Metric Primary Demand Driver
Household Soap & Detergent 46.3% share (2025) Population-scale daily-use consumption
Personal Care 5.00% CAGR (2026–2035) Premiumization and sulfate-free formulation trends
Lubricants & Fuel Additives USD 3,200 Million (2025) Automotive and industrial lubricant demand
Industry & Institutional Cleaning 3.90% CAGR (2026–2035) Healthcare and hospitality infrastructure expansion
Other Applications USD 2,800 Million (2025) Agricultural adjuvants; oilfield chemicals; textile processing


Household soap and detergent remains the largest application within the Surfactants Market, accounting for nearly half of global consumption. Growth in this segment closely correlates with population dynamics, urbanization rates, and per-capita disposable income in developing markets. Cold-water and concentrated-detergent formats are shifting the surfactant mix within this category toward higher-performance molecules that justify modest price premiums.

Personal-care applications represent the fastest-expanding segment, driven by a global shift toward sulfate-free shampoos, mild facial cleansers, and multifunctional body-wash formulations. Asia-Pacific and North America are the primary engines of personal-care surfactant demand growth, with K-beauty and clean-beauty trends influencing formulation preferences worldwide.


Regional Market Share Analysis

Region Key Metric Primary Investment Themes
Asia-Pacific 44.8% share (2025) FMCG expansion; oleochemical integration
North America USD 9,560 Million (2025) Oilfield chemicals; institutional cleaning
Europe 21.2% share (2025) Bio-based mandates; premium personal care
South America 3.50% CAGR (2026–2035) Consumer-goods penetration; agricultural adjuvants
Middle East & Africa USD 2,000 Million (2025) Infrastructure-driven hygiene demand
Total USD 42,500 Million (2025)

The Surfactants Market exhibits clear geographic concentration in Asia-Pacific, followed by North America and Europe. Regional dynamics are shaped by the interplay of population-scale consumer demand, regulatory stringency, and raw-material availability.


North America

Country Key Metric Key Driver
US 78.4% of regional share Industrial and oilfield surfactant demand
Canada USD 1,190 Million (2025) Institutional cleaning growth
Mexico 3.80% CAGR (2026–2035) Consumer-goods market expansion


The United States dominates North America's Surfactants Market, with strong demand from institutional cleaning, personal care, and oilfield services. The EPA's Safer Choice certification program has expanded its influence over procurement specifications in government and healthcare facilities, steering buyers toward verified-safer surfactant formulations [11]. Canada's market benefits from tight integration with U.S. supply chains, while Mexico is growing rapidly as multinational FMCG companies localize manufacturing.

Europe

Country Key Metric Key Driver
Germany 24.6% of regional share Chemical-industry hub; auto-care formulations
UK USD 1,480 Million (2025) Personal-care innovation center
France 3.45% CAGR (2026–2035) Green chemistry mandates
Italy USD 920 Million (2025) Household-cleaning heritage brands
Spain 3.30% CAGR (2026–2035) Oleochemical import processing
Nordic Countries USD 680 Million (2025) Sustainability-first consumer base
Russia 3.70% CAGR (2026–2035) Domestic production substitution
Rest of Europe USD 1,250 Million (2025) Varied industrial applications


Europe's Surfactants Market is the most regulation-intensive globally, with the revised EU Detergents Regulation and REACH framework driving rapid reformulation. Germany anchors the region as home to BASF, Evonik, and Henkel — companies that set formulation benchmarks for the continent. The Nordic countries punch above their weight in adopting bio-based cleaning products, often serving as bellwether markets for sustainability-led launches [1].

Asia-Pacific

Country Key Metric Key Driver
China 38.5% of regional share Scale manufacturing; domestic FMCG growth
India 4.90% CAGR (2026–2035) Per-capita consumption convergence
Japan USD 2,680 Million (2025) Premium personal-care formulations
South Korea 3.75% CAGR (2026–2035) K-beauty surfactant innovation
ASEAN USD 2,350 Million (2025) Palm-oil-based oleochemical integration
Rest of Asia-Pacific 3.60% CAGR (2026–2035) Emerging urbanization trends


Asia-Pacific holds the commanding share of the Surfactants Market, powered by China's manufacturing scale and India's accelerating consumer-goods penetration. Chinese producers have built substantial capacity in linear alkylbenzene sulfonate and alcohol ethoxylates, supplying both domestic demand and export markets across Africa and Latin America [18]. India represents the region's most dynamic growth story, with per-capita surfactant consumption still well below global averages and a rapidly expanding organized retail sector driving branded product adoption [10].

South America

Country Key Metric Key Driver
Brazil 62.3% of regional share Largest consumer market; agricultural adjuvants
Argentina USD 420 Million (2025) Household-cleaning demand
Rest of South America 3.65% CAGR (2026–2035) Growing urbanization


Brazil's Surfactants Market benefits from a large domestic consumer base and a significant agricultural sector that uses surfactant-based adjuvants in crop-protection formulations. The country's sugarcane-ethanol infrastructure also provides a feedstock pathway for bio-based ethylene oxide production, potentially lowering input costs for local surfactant manufacturers [2].

Middle East & Africa

Country Key Metric Key Driver
Saudi Arabia 28.4% of regional share Petrochemical feedstock advantage
UAE USD 310 Million (2025) Hospitality-driven institutional cleaning
South Africa 3.55% CAGR (2026–2035) Consumer-goods distribution expansion
Egypt USD 240 Million (2025) Population-driven household demand
Rest of MEA 3.80% CAGR (2026–2035) Infrastructure development


The Middle East benefits from feedstock cost advantages through integrated petrochemical complexes in Saudi Arabia and the UAE, positioning the region as a competitive surfactant export hub. Africa's Surfactants Market remains nascent but is expanding as institutional hygiene requirements in healthcare and hospitality create new demand channels, supported by World Bank-funded sanitation infrastructure programs [16].


Surfactants Market By Region, 2025-2035

Competitive Benchmarking

The Surfactants Market exhibits low concentration, with the top five producers holding an estimated combined share of 28–33%. The Herfindahl-Hirschman Index sits well below 1,000, confirming a fragmented competitive environment where regional specialists coexist alongside vertically integrated chemical conglomerates. Competition increasingly hinges on feedstock integration, sustainability credentials, and application-specific formulation expertise rather than pure volume scale.

Company Est. Revenue Share Range Key Offerings for Surfactants Market Strategic Positioning
BASF SE ~6–9% LAS, alcohol ethoxylates, APGs, rhamnolipids Vertically integrated; sustainability leader
Dow Inc. ~4–7% Ethoxylates, EO/PO block copolymers Feedstock integration; North American scale
Evonik Industries AG ~3–5% Betaines, biosurfactants, specialty amines Innovation-led; fermentation pioneer
Stepan Company ~3–5% Anionic and amphoteric surfactants, sulfonates Mid-market focus; Americas-centric
Huntsman Corporation ~2–4% EO derivatives, textile surfactants Downstream integration; industrial focus
Clariant AG ~2–4% Glucamides, personal-care actives Specialty positioning; high-margin niches
Croda International ~2–3% Bio-based ethoxylates, crop-care surfactants Sustainability branding; premium segments
Nouryon ~2–4% Ethylene amines, chelants, surfactant intermediates Integrated supply chain; industrial cleaning
Sasol Limited ~2–3% Detergent alcohols, alpha olefins Feedstock advantage; long-chain alcohol producer
Galaxy Surfactants Ltd. ~2–3% Performance surfactants for FMCG and personal care India-based; fast-growing regional player
Kao Corporation ~2–3% Oleochemical-based surfactants, MES grades Japan-anchored; green-chemistry focus
Solvay SA ~1–3% Nonionic surfactants, fluorosurfactant alternatives Specialty chemicals pivot; R&D depth


Recent News & Developments


Surfactants Market Report Scope

Parameter Detail
Market Scope Global Surfactants Market by Type, Origin, Application, and Geography
Study Period 2021–2035
CAGR (Forecast Period) 3.60% (2026–2035)
Base Year Market Size USD 42,500 Million (2025)
Forecast Endpoint USD 60,530 Million (2035)
Fastest Growing Segment (Type) Amphoteric Surfactants (4.70% CAGR)
Fastest Growing Segment (Application) Personal Care (5.00% CAGR)
Companies Profiled 12 (BASF, Dow, Evonik, Stepan, Huntsman, Clariant, Croda, Nouryon, Sasol, Galaxy Surfactants, Kao, Solvay)
Valuation Currency USD Million


FAQs

How do surfactant procurement contracts typically structure pricing against feedstock volatility?

Most industrial contracts use quarterly price-adjustment clauses indexed to fatty-alcohol or ethylene-oxide benchmarks published by ICIS. Buyers can lock in 6–12 month fixed-price terms at a 3–5% premium over spot [5].

What differentiates amphoteric surfactants from anionic grades in personal-care formulation?

Amphoteric molecules carry both positive and negative charges, enabling mildness at skin-compatible pH levels. Anionic grades deliver stronger foam but can strip natural oils, making them less suitable for sensitive-skin products [8].

Which biosurfactant platforms are closest to cost parity with synthetic alternatives?

Rhamnolipids produced via bacterial fermentation have reached near-parity at facilities exceeding 10,000 tonnes per year. Sophorolipids follow closely, with commercial plants operating in Belgium and the United States [12].

How does the EU Detergents Regulation revision affect non-European surfactant exporters?

Exporters must ensure formulations meet updated biodegradability and aquatic-toxicity criteria to retain EU market access. Compliance testing adds approximately 4–6 months to product-registration timelines [1].

What role do surfactants play in enhanced oil recovery operations?

Surfactant flooding reduces interfacial tension between trapped crude oil and reservoir rock, mobilizing residual oil. The U.S. DOE estimates this technique lifts recovery factors by 5–15 percentage points beyond waterflooding [17].

Are concentrated and unit-dose detergent formats reducing overall surfactant consumption per wash?

Concentrated formats lower per-dose surfactant weight by 30–40% but drive premiumization that lifts revenue per unit. Net volume impact is modest because dose-count per package often increases [3].

What supply-chain risks should buyers monitor for palm-kernel-derived surfactant feedstocks?

Indonesian and Malaysian export levies, RSPO certification bottlenecks, and shipping-lane disruptions are the primary risks. Diversifying toward coconut oil or synthetic-alcohol feedstocks provides partial mitigation [19].    
Author
Author
Author Profile
Chitranshi Jaiswal LinkedIn
Team Lead - Research
Chitranshi is a Team Leader in the Chemicals & Materials (CnM) and Energy & Power (EnP) domains, with 6+ years of experience in market research. She leads and mentors teams to deliver cross-domain projects that equip clients with actionable insights and growth strategies. She is skilled in market estimation, forecasting, competitive benchmarking, and both primary & secondary research, enabling her to turn complex data into decision-ready insights. An engineer and MBA professional, she combines technical expertise with strategic acumen to solve dynamic market challenges. Chitranshi has successfully managed projects that support market entry, investment planning, and competitive positioning, while building strong client relationships. Certified in Advanced Excel & Power BI she leverages data-driven approaches to ensure accuracy, clarity, and impactful outcomes.

Research Approach


Secondary Research

The secondary research process involved comprehensive analysis of chemical industry databases, regulatory frameworks, peer-reviewed scientific journals, patent publications, and authoritative industry associations. Key sources included the US Environmental Protection Agency (EPA), European Chemicals Agency (ECHA), Food & Drug Administration (FDA), US Department of Agriculture (USDA) BioPreferred Program, American Cleaning Institute (ACI), European Committee of Organic Surfactants and their Intermediates (CESIO), Society of Cosmetic Chemists (SCC), International Association for Soaps, Detergents and Maintenance Products (A.I.S.E.), National Center for Biotechnology Information (NCBI/PubMed), US Census Bureau Chemical Industry Reports, Eurostat Chemical Production Statistics, International Trade Centre (ITC) Trade Map, and national chemical ministry reports from key markets. These sources were used to collect production statistics, regulatory compliance data, safety assessments, sustainability trends, and market landscape analysis for anionic, cationic, non-ionic, and amphoteric surfactants across bio-based and synthetic substrate categories.


Primary Research

In order to gather both qualitative and quantitative insights, supply-side and demand-side stakeholders were interviewed during the primary research phase. Supply-side sources included CEOs, VPs of Business Development, regulatory compliance heads, and R&D directors from surfactant makers, chemical conglomerates, and specialty ingredient suppliers. Procurement directors from personal care formulators, producers of domestic cleaning products, experts in industrial applications, and sustainability officials from FMCG firms were examples of demand-side sources. In addition to gathering information on formulation adoption trends, raw material procurement tactics, and the dynamics of the green chemistry transition, primary research validated market segmentation and bio-based product pipeline timescales.

Primary Respondent Breakdown:

By Designation: C-level Primaries (32%), Director Level (30%), Others (38%)

By Region: North America (32%), Europe (30%), Asia-Pacific (28%), Rest of World (10%)


Market Size Estimation

Global market valuation was calculated using revenue mapping and production volume research. The methods included:

Identification of 50+ significant manufacturers in North America, Europe, Asia-Pacific, and Latin America

Product mapping among anionic surfactants (LAS, FAE Sulfates, FAS, Sulfosuccinates), cationic surfactants, non-ionic surfactants (Fatty Alcohol Ethoxylates, Alkyl Phenol Ethoxylates), and amphoteric surfactants

Substrate study encompassing both synthetic and bio-based surfactants, including glycolipids, fatty acids, phospholipids, lipopeptides, and polymeric biosurfactants

Examination of modeled and reported yearly revenues for surfactant portfolios

Coverage of manufacturers with 70-75% of global market share in 2024

Extrapolation employing bottom-up (production volume × ASP by region/application) and top-down (manufacturer revenue validation) methodologies to derive segment-specific values

Download Free Sample

Kindly complete the form below to receive a free sample of this Report

Download PDF ×

We do not share your information with anyone. However, we may send you emails based on your report interest from time to time. You may contact us at any time to opt-out.