Segmentation Quick Reference
| Dimension | Sub-Segments | Dominant Segment | Fastest Growing Segment |
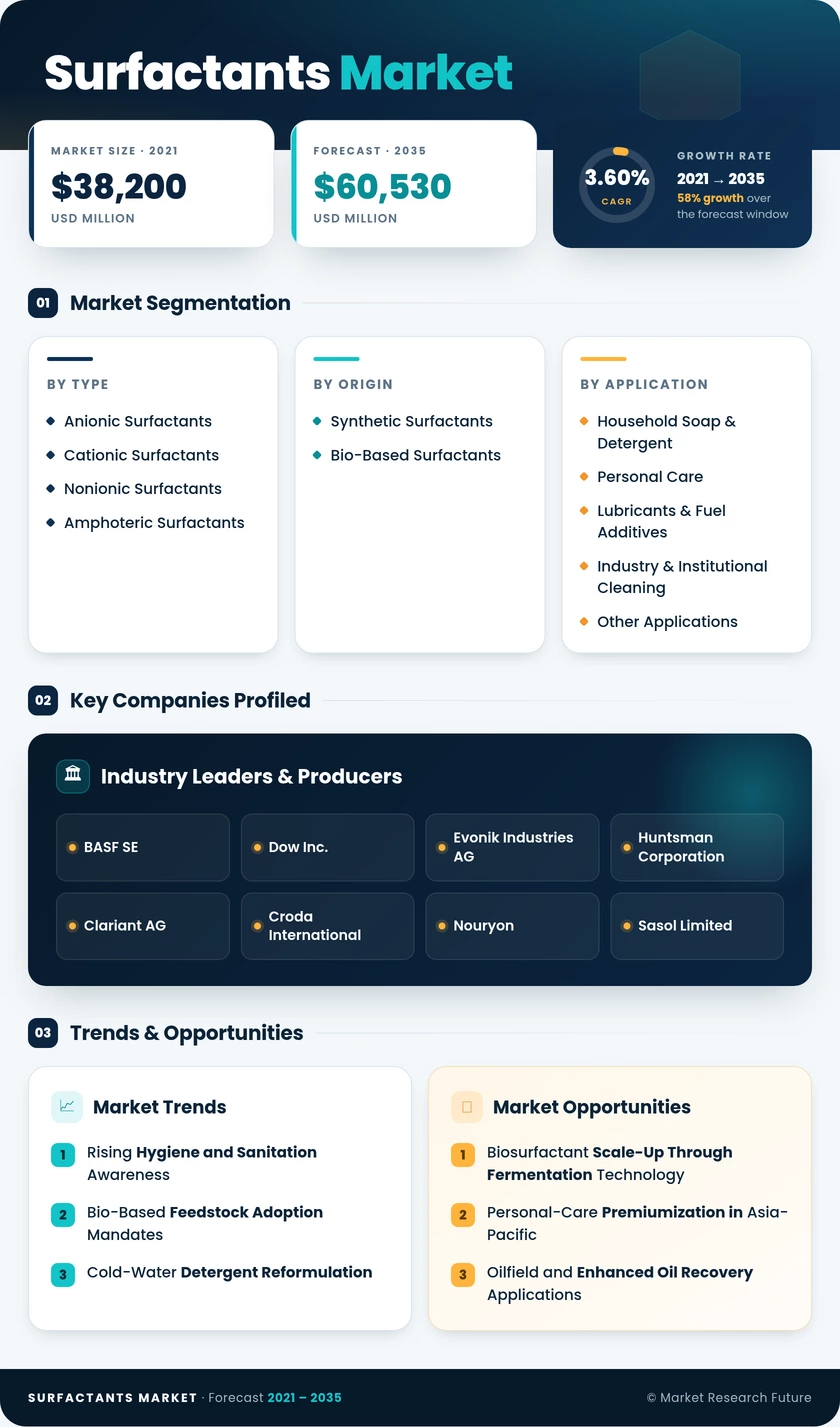
| By Type | Anionic Surfactants, Cationic Surfactants, Nonionic Surfactants, Amphoteric Surfactants | Anionic Surfactants | Amphoteric Surfactants |
| By Origin | Synthetic Surfactants, Bio-Based Surfactants | Synthetic Surfactants | Bio-Based Surfactants |
| By Application | Household Soap & Detergent, Personal Care, Lubricants & Fuel Additives, Industry & Institutional Cleaning, Other Applications | Household Soap & Detergent | Personal Care |
| By Geography | Asia-Pacific, North America, Europe, South America, the Middle East & Africa | Asia-Pacific | Asia-Pacific |
Market Segmentation Overview
By Type
| Sub-Segment | Key Trend |
| Anionic Surfactants | Mature segment sustained by household-cleaning and laundry-detergent demand; volume growth tracks the overall market |
| Cationic Surfactants | Steady demand from fabric-softener and hair-conditioning applications; limited disruption expected |
| Nonionic Surfactants | Growing adoption in low-foam industrial and institutional cleaning; cold-water formulation compatibility |
| Amphoteric Surfactants | Fastest-growing type driven by sulfate-free personal-care reformulation and baby-product demand |
Surfactant type selection hinges on the balance between cleaning performance, foam profile, mildness, and cost. Anionic grades will continue to dominate volume, but amphoteric and nonionic categories are capturing a growing share of value as formulators pursue milder, multifunctional product architectures.
By Origin
| Sub-Segment | Key Trend |
| Synthetic Surfactants | Retains majority share through established petrochemical and oleochemical supply infrastructure |
| Bio-Based Surfactants | Fastest-growing origin; propelled by EU biodegradability mandates and consumer sustainability preferences |
The synthetic-to-bio-based transition is gradual, shaped by feedstock economics, regulatory timelines, and consumer willingness to pay. Bio-based surfactants currently command a price premium of 10–15% over synthetic equivalents, but fermentation-scale economies and palm-kernel-oil processing efficiencies are narrowing the gap.
By Application
| Sub-Segment | Key Trend |
| Household Soap & Detergent | Largest application; driven by population-scale daily consumption and cold-water reformulation |
| Personal Care | Fastest-growing; premiumization, and clean-beauty trends are lifting demand for mild surfactant systems |
| Lubricants & Fuel Additives | Stable industrial demand; automotive and manufacturing sectors drive consumption |
| Industry & Institutional Cleaning | Expanding with healthcare and hospitality infrastructure growth in emerging markets |
| Other Applications | Includes agricultural adjuvants, oilfield chemicals, and textile-processing aids |
Application diversity provides the surfactants industry with a degree of counter-cyclicality: consumer hygiene demand is relatively recession-resistant, while industrial and oilfield applications correlate with commodity-price and capex cycles.
By Geography
| Sub-Segment | Key Trend |
| Asia-Pacific | Dominant and fastest-growing; China's manufacturing scale and India's consumption convergence |
| North America | Oilfield-chemicals and institutional-cleaning demand provide resilience |
| Europe | Regulation-driven reformulation; bio-based adoption leads globally |
| South America | Consumer-goods penetration and agricultural adjuvant demand are expanding |
| Middle East & Africa | Petrochemical feedstock advantage; nascent but growing institutional hygiene demand |
Regional growth trajectories diverge primarily on per-capita consumption headroom and regulatory intensity. Asia-Pacific will maintain its dual status as the largest and fastest-growing region through 2035, while Europe leads the bio-based transition and North America anchors specialty and industrial applications.