Pumps Type Market Segmentation
Pumps Type Outlook (USD Billion, 2018-2030)
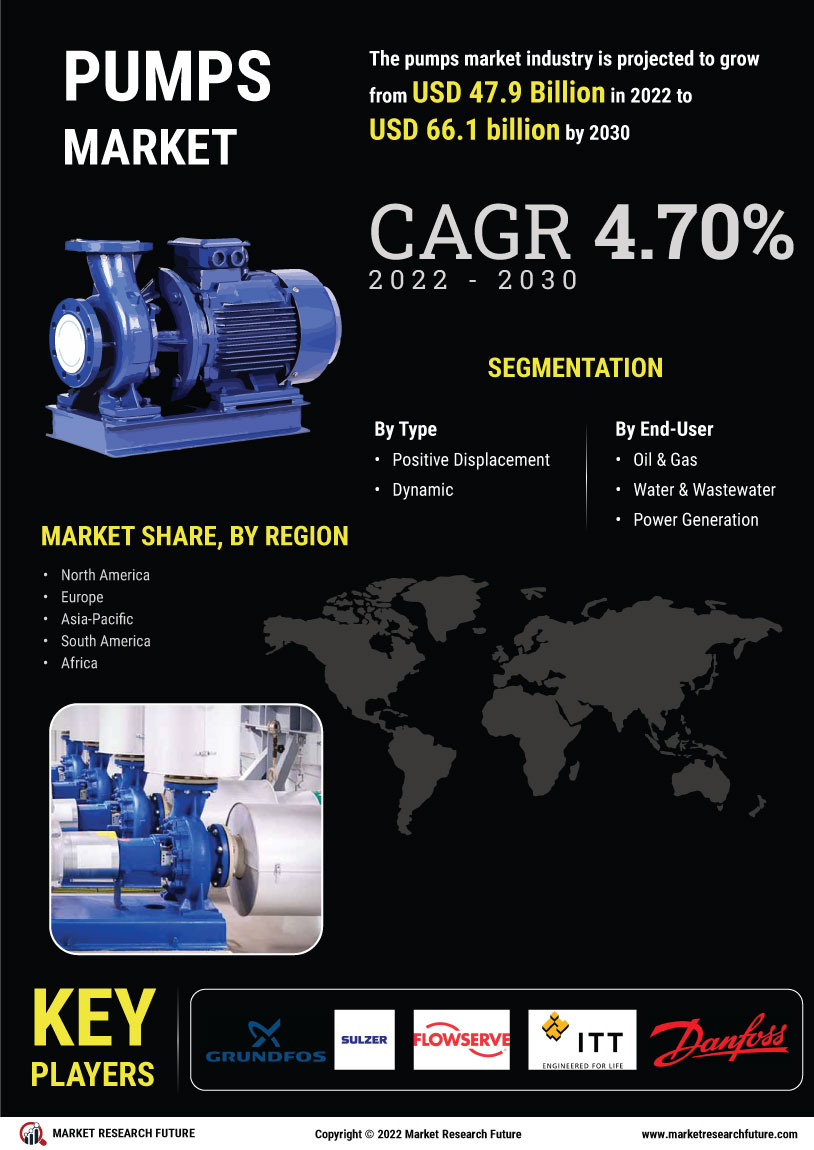
- Positive Displacement
- Dynamic
Pumps End-User Outlook (USD Billion, 2018-2030)
- Oil & Gas
- Water & Wastewater
- Power Generation
- Chemicals
- Pumps Market
- Food & Beverage
- Others
Pumps Regional Outlook (USD Billion, 2018-2030)
North America Outlook (USD Billion, 2018-2030)
- Pumps Market by Type
- Positive Displacement
- Dynamic
- Pumps Market by End-User
- Oil & Gas
- Water & Wastewater
- Power Generation
- Chemicals
- Pumps Market
- Food & Beverage
- Others
US Outlook (USD Billion, 2018-2030)
- Pumps Market by Type
- Positive Displacement
- Dynamic
- Pumps Market by End-User
- Oil & Gas
- Water & Wastewater
- Power Generation
- Chemicals
- Pumps Market
- Food & Beverage
- Others
CANADA Outlook (USD Billion, 2018-2030)
- Pumps Market by Type
- Positive Displacement
- Dynamic
- Pumps Market by End-User
- Oil & Gas
- Water & Wastewater
- Power Generation
- Chemicals
- Pumps Market
- Food & Beverage
- Others
- Pumps Market by Type
Europe Outlook (USD Billion, 2018-2030)
- Pumps Market by Type
- Positive Displacement
- Dynamic
- Pumps Market by End-User
- Oil & Gas
- Water & Wastewater
- Power Generation
- Chemicals
- Pumps Market
- Food & Beverage
- Others
GermanyOutlook (USD Billion, 2018-2030)
- Pumps Market by Type
- Positive Displacement
- Dynamic
- Pumps Market by End-User
- Oil & Gas
- Water & Wastewater
- Power Generation
- Chemicals
- Pumps Market
- Food & Beverage
- Others
France Outlook (USD Billion, 2018-2030)
- Pumps Market by Type
- Positive Displacement
- Dynamic
- Pumps Market by End-User
- Oil & Gas
- Water & Wastewater
- Power Generation
- Chemicals
- Pumps Market
- Food & Beverage
- Others
UK Outlook (USD Billion, 2018-2030)
- Pumps Market by Type
- Positive Displacement
- Dynamic
- Pumps Market by End-User
- Oil & Gas
- Water & Wastewater
- Power Generation
- Chemicals
- Pumps Market
- Food & Beverage
- Others
ITALY Outlook (USD Billion, 2018-2030)
- Pumps Market by Type
- Positive Displacement
- Dynamic
- Pumps Market by End-User
- Oil & Gas
- Water & Wastewater
- Power Generation
- Chemicals
- Pumps Market
- Food & Beverage
- Others
SPAIN Outlook (USD Billion, 2018-2030)
- Pumps Market by Type
- Positive Displacement
- Dynamic
- Pumps Market by End-User
- Oil & Gas
- Water & Wastewater
- Power Generation
- Chemicals
- Pumps Market
- Food & Beverage
- Others
Rest Of Europe Outlook (USD Billion, 2018-2030)
- Pumps Market by Type
- Positive Displacement
- Dynamic
- Pumps Market by End-User
- Oil & Gas
- Water & Wastewater
- Power Generation
- Chemicals
- Pumps Market
- Food & Beverage
- Others
- Pumps Market by Type
Asia-Pacific Outlook (USD Billion, 2018-2030)
- Pumps Market by Type
- Positive Displacement
- Dynamic
- Pumps Market by End-User
- Oil & Gas
- Water & Wastewater
- Power Generation
- Chemicals
- Pumps Market
- Food & Beverage
- Others
China Outlook (USD Billion, 2018-2030)
- Pumps Market by Type
- Positive Displacement
- Dynamic
- Pumps Market by End-User
- Oil & Gas
- Water & Wastewater
- Power Generation
- Chemicals
- Pumps Market
- Food & Beverage
- Others
Japan Outlook (USD Billion, 2018-2030)
- Pumps Market by Type
- Positive Displacement
- Dynamic
- Pumps Market by End-User
- Oil & Gas
- Water & Wastewater
- Power Generation
- Chemicals
- Pumps Market
- Food & Beverage
- Others
India Outlook (USD Billion, 2018-2030)
- Pumps Market by Type
- Positive Displacement
- Dynamic
- Pumps Market by End-User
- Oil & Gas
- Water & Wastewater
- Power Generation
- Chemicals
- Pumps Market
- Food & Beverage
- Others
Australia Outlook (USD Billion, 2018-2030)
- Pumps Market by Type
- Positive Displacement
- Dynamic
- Pumps Market by End-User
- Oil & Gas
- Water & Wastewater
- Power Generation
- Chemicals
- Pumps Market
- Food & Beverage
- Others
Rest of Asia-Pacific Outlook (USD Billion, 2018-2030)
- Pumps Market by Type
- Positive Displacement
- Dynamic
- Pumps Market by End-User
- Oil & Gas
- Water & Wastewater
- Power Generation
- Chemicals
- Pumps Market
- Food & Beverage
- Others
- Pumps Market by Type
Rest of the World Outlook (USD Billion, 2018-2030)
- Pumps Market by Type
- Positive Displacement
- Dynamic
- Pumps Market by End-User
- Oil & Gas
- Water & Wastewater
- Power Generation
- Chemicals
- Pumps Market
- Food & Beverage
- Others
Middle East Outlook (USD Billion, 2018-2030)
- Pumps Market by Type
- Positive Displacement
- Dynamic
- Pumps Market by End-User
- Oil & Gas
- Water & Wastewater
- Power Generation
- Chemicals
- Pumps Market
- Food & Beverage
- Others
Africa Outlook (USD Billion, 2018-2030)
- Pumps Market by Type
- Positive Displacement
- Dynamic
- Pumps Market by End-User
- Oil & Gas
- Water & Wastewater
- Power Generation
- Chemicals
- Pumps Market
- Food & Beverage
- Others
Latin America Outlook (USD Billion, 2018-2030)
- Pumps Market by Type
- Positive Displacement
- Dynamic
- Pumps Market by End-User
- Oil & Gas
- Water & Wastewater
- Power Generation
- Chemicals
- Pumps Market
- Food & Beverage
- Others
- Pumps Market by Type