High Pressure Pumps Market Summary
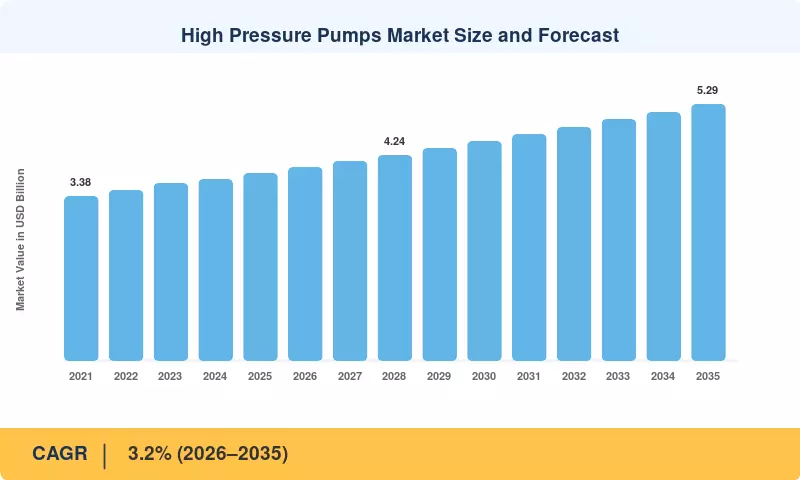
The High Pressure Pumps Market was valued at USD 3.86 billion in 2025. It is projected to reach USD 3.98 billion in 2026 and USD 5.29 billion by 2035, a CAGR of 3.2% over 2026–2035. Two catalysts anchor that trajectory. The first is upstream oil and gas spending, which the IEA estimated at roughly USD 570 billion for 2024 [1]. The second is public water funding, including the USD 55 billion earmarked for water systems under the US Bipartisan Infrastructure Law [5]. Both channels buy equipment rated above 30 bar for injection, descaling, reverse osmosis feed and hydrotesting duties.
Technology inside the installed base is changing. Operators are replacing fixed-speed, belt-driven plunger units on manual maintenance schedules with direct-drive designs. The replacements use variable-frequency drives, ceramic plungers and embedded sensors that flag valve and packing wear before failure. Efficiency rules are speeding up this replacement cycle. The US Department of Energy pump standard has applied to clean-water pumps since January 2020 [7], and the EU Ecodesign for Sustainable Products Regulation, in force since July 2024, broadens product-level performance requirements [8]. Additive manufacturing is also shortening lead times for impellers and manifold blocks.
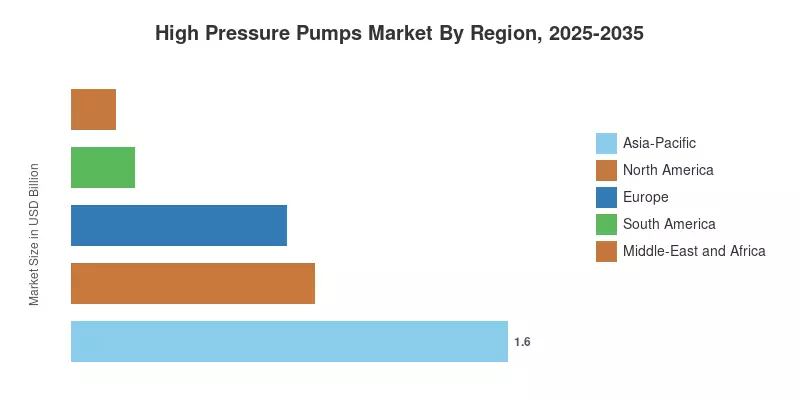
Asia-Pacific leads with a 41.5% share and is also the fastest-growing region. Its growth comes from steel, textiles, food processing and municipal water programmes in China and India. North America ranks second, supported by shale completions, refinery turnarounds and early hydrogen projects. Over the next decade, the High Pressure Pumps Market will favour suppliers that sell hardware together with monitoring and long-term service contracts.
Key Report Takeaways
• By Type
- Positive Displacement holds a 58.5% share of the High Pressure Pumps Market in 2025 because of its flow stability above 100 bar
- Dynamic designs grow faster, at a 3.6% CAGR, helped by multistage units in desalination and boiler feed
• By Pressure
- The 100 bar to 500 bar band holds a 44.0% share and covers most descaling, reverse osmosis and industrial cleaning duties
- Above 500 bar grows at a 4.2% CAGR as waterjet cutting and hydrogen-related compression scale up
• By End-User Industry
- Manufacturing Industries account for a 31.0% share of the High Pressure Pumps Market, led by steel, textiles, food and automotive lines
- Chemicals & Pharmaceuticals expand at a 3.9% CAGR on process intensification and stricter containment rules
• By Region
- Asia-Pacific holds a 41.5% share, with China and India supplying most of the demand
- North America contributes USD 0.89 billion, supported by shale and refinery maintenance
- Middle-East and Africa grows at a 4.1% CAGR as large seawater desalination plants are built
Market Size and Forecast (2021–2035)
Estimates for the High Pressure Pumps Market combine a bottom-up model and a top-down cross-check. The bottom-up model uses unit shipments and average selling prices drawn from manufacturer filings, customs trade data and end-user capital expenditure. The top-down check draws on industrial production indices and energy investment data from the IEA and World Steel Association [1][3]. Primary interviews with OEMs, distributors and plant engineers were used to calibrate pressure-class splits and aftermarket revenue. All values are in constant 2025 US dollars.




 Noah Malgeri
Co-Founder

 Peter Groot koerkamp
Account and Business Manager

 Younghwan Choi
Senior Retail Manager

 Mark Irwin
Management Consultant

 Akif Moroglu
Strategy & Business Development Director

 Guilherme Gomes Martins
Product Management Director

 Joseph Aguayo
Sales Operations & Pricing Manager

 La Terria Dodd
Program Support Specialist

 Rob Kooiker
Group Product Manager HVAC & Fire Protection GMA


