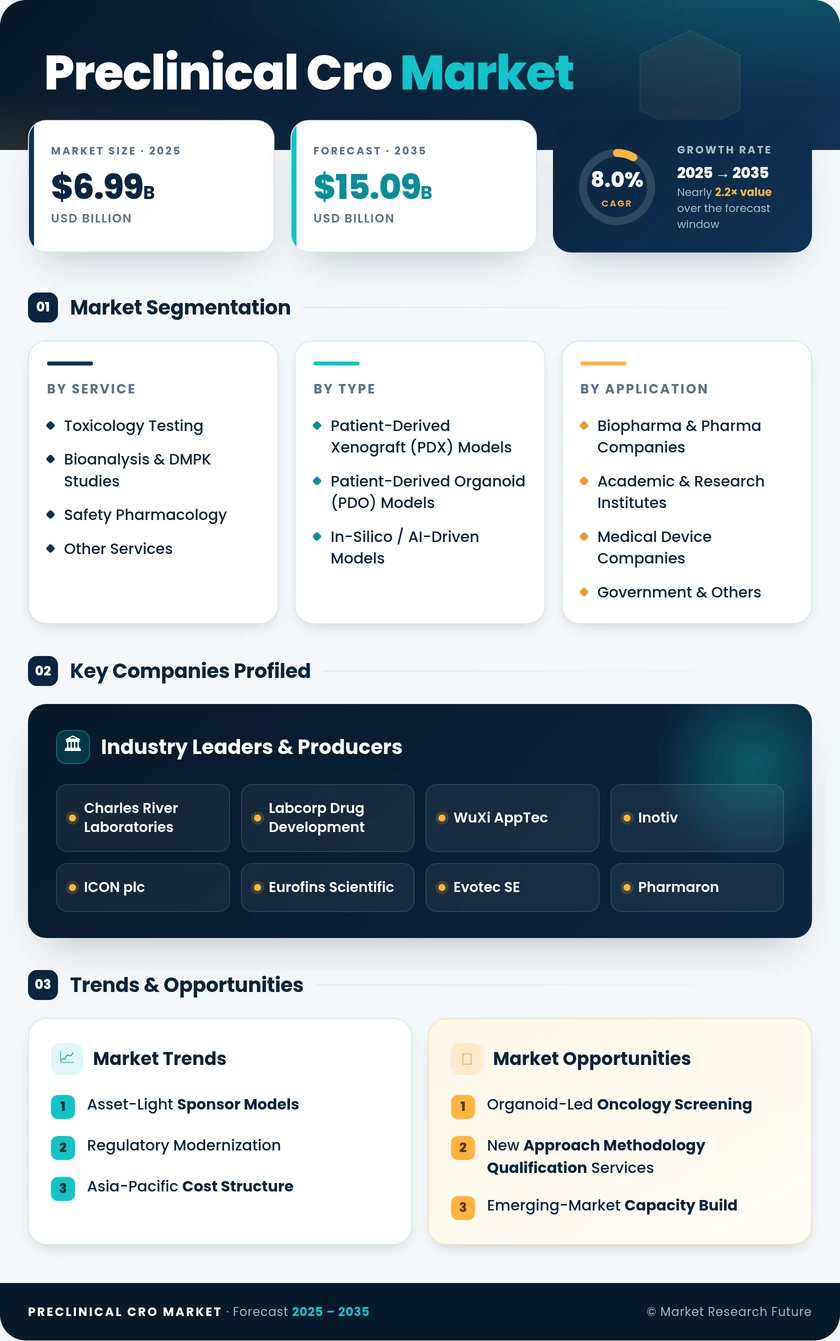
Preclinical CRO Market (2026 - 2035)

Preclinical CRO Market Research Report By Service Type (Biologics Testing, Small Molecule Testing, Toxicology Testing, Pharmacology Testing), By Therapeutic Area (Oncology, Neurology, Cardiology, Infectious Diseases), By Validation Type (In Vivo Studies, In Vitro Studies, Comparative Studies, Regulatory Studies), By End User (Pharmaceutical Companies, Biotechnology Companies, Academic Institutions, Research Organizations) and By Regional (North America, Europe, South America, Asia Pacific, Middle East and Africa) - Growth & Industry Forecast 2025 To 2035

Forecast Period
2026-2035
CAGR
8.0%
2025 Market Size
USD 6.99 Billion
2035 Market Size
USD 15.09 Billion
Healthcare Services ● Updated September 7, 2026 Report ID: MRFR/HS/5807-CR | Pages: 200 | Author: Rahul Gotadki, Nidhi Mandole
  1. 1 Market Summary |
    1. 1.1 Study Assumptions & Market Definition |
    2. 1.2 Scope of the Study |
    3. 1.3 Research Methodology
  2. 2 Key Report Takeaways |
    1. 2.1 By Service |
    2. 2.2 By Model Type and End User |
    3. 2.3 By Geography
  3. 3 Market Size & Forecast (2021–2035) |
    1. 3.1 Historical Market Size (2021–2025) |
    2. 3.2 Current & Forecast Market Size (2026–2035) |
    3. 3.3 Year-over-Year Growth Analysis
  4. 4 Driver Impact Analysis |
    1. 4.1 Asset-Light Sponsor Models |
    2. 4.2 Regulatory Modernization |
    3. 4.3 Asia-Pacific Cost Structure |
    4. 4.4 Safety Pharmacology Intensification
  5. 5 Restraints Impact Analysis |
    1. 5.1 Funding Cycle Sensitivity |
    2. 5.2 Biological Supply and Ethical Pressure |
    3. 5.3 Quality and Compliance Exposure
  6. 6 Opportunities |
    1. 6.1 Organoid-Led Oncology Screening |
    2. 6.2 New Approach Methodology Qualification Services |
    3. 6.3 Emerging-Market Capacity Build |
    4. 6.4 Historical Control Data Monetization |
    5. 6.5 Integrated Discovery-to-IND Packages
  7. 7 Regional Market Share & Country-Level Analysis |
    1. 7.1 North America | |
      1. 7.1.1 US | |
      2. 7.1.2 Canada | |
      3. 7.1.3 Mexico |
    2. 7.2 Europe | |
      1. 7.2.1 Germany | |
      2. 7.2.2 UK | |
      3. 7.2.3 France | |
      4. 7.2.4 Italy | |
      5. 7.2.5 Spain | |
      6. 7.2.6 Nordic Countries | |
      7. 7.2.7 Russia | |
      8. 7.2.8 Rest of Europe |
    3. 7.3 Asia-Pacific | |
      1. 7.3.1 China | |
      2. 7.3.2 India | |
      3. 7.3.3 Japan | |
      4. 7.3.4 South Korea | |
      5. 7.3.5 ASEAN | |
      6. 7.3.6 Rest of Asia-Pacific |
    4. 7.4 South America | |
      1. 7.4.1 Brazil | |
      2. 7.4.2 Argentina | |
      3. 7.4.3 Rest of South America |
    5. 7.5 Middle East & Africa | |
      1. 7.5.1 Saudi Arabia | |
      2. 7.5.2 UAE | |
      3. 7.5.3 South Africa | |
      4. 7.5.4 Egypt | |
      5. 7.5.5 Rest of Middle East & Africa
  8. 8 Future Outlook (2026–2035) |
    1. 8.1 Computational Displacement, Not Replacement |
    2. 8.2 Platform Economics |
    3. 8.3 Modality Shift Toward Advanced Therapies |
    4. 8.4 Sustainability and Animal Welfare Reporting
  9. 9 Market Segmentation Analysis |
    1. 9.1 By Service | |
      1. 9.1.1 Toxicology Testing | |
      2. 9.1.2 Bioanalysis & DMPK Studies | |
      3. 9.1.3 Safety Pharmacology | |
      4. 9.1.4 Other Services |
    2. 9.2 By Model Type | |
      1. 9.2.1 Patient-Derived Xenograft (PDX) Models | |
      2. 9.2.2 Patient-Derived Organoid (PDO) Models | |
      3. 9.2.3 In-Silico / AI-Driven Models |
    3. 9.3 By End User | |
      1. 9.3.1 Biopharma & Pharma Companies | |
      2. 9.3.2 Academic & Research Institutes | |
      3. 9.3.3 Medical Device Companies | |
      4. 9.3.4 Government & Others
  10. 10 Competitive Landscape |
    1. 10.1 Market Share Analysis (2026) |
    2. 10.2 Competitive Benchmarking Matrix |
    3. 10.3 Company Profiles | |
      1. 10.3.1 Charles River Laboratories | |
      2. 10.3.2 Labcorp Drug Development | |
      3. 10.3.3 WuXi AppTec | |
      4. 10.3.4 Inotiv | |
      5. 10.3.5 ICON plc | |
      6. 10.3.6 Eurofins Scientific | |
      7. 10.3.7 Evotec SE | |
      8. 10.3.8 Pharmaron | |
      9. 10.3.9 Frontage Laboratories | |
      10. 10.3.10 Crown Bioscience | |
      11. 10.3.11 Altasciences
  11. 11 Recent News & Developments
  12. 12 Report Scope & Methodology |
    1. 12.1 Study Period & Base Year |
    2. 12.2 Valuation Currency & Conventions |
    3. 12.3 Abbreviations
  13. 13 Detailed Sources & Citations
  14. 14 Frequently Asked Questions
  15. 15 LIST OF TABLES |
  16. TABLE 1 Global Preclinical CRO Market Size & Forecast, by Revenue (USD Billion), 2021–2035 |
  17. TABLE 2 Global Preclinical CRO Market – Year-over-Year Growth Analysis, 2021–2035 |
  18. TABLE 3 Driver Impact Analysis Matrix, 2026–2035 |
  19. TABLE 4 Restraint Impact Analysis Matrix, 2026–2035 |
  20. TABLE 5 Preclinical CRO Market Size, by Region, 2021–2035 (USD Billion) |
  21. TABLE 6 North America Preclinical CRO Market Size, by Country, 2021–2035 (USD Billion) |
  22. TABLE 7 Europe Preclinical CRO Market Size, by Country, 2021–2035 (USD Billion) |
  23. TABLE 8 Asia-Pacific Preclinical CRO Market Size, by Country, 2021–2035 (USD Billion) |
  24. TABLE 9 South America Preclinical CRO Market Size, by Country, 2021–2035 (USD Billion) |
  25. TABLE 10 Middle East & Africa Preclinical CRO Market Size, by Country, 2021–2035 (USD Billion) |
  26. TABLE 11 Preclinical CRO Market Size, by Service, 2021–2035 (USD Billion) |
  27. TABLE 12 Preclinical CRO Market Size, by Model Type, 2021–2035 (USD Billion) |
  28. TABLE 13 Preclinical CRO Market Size, by End User, 2021–2035 (USD Billion) |
  29. TABLE 14 North America Preclinical CRO Market Size, by Service, 2021–2035 (USD Billion) |
  30. TABLE 15 Europe Preclinical CRO Market Size, by Model Type, 2021–2035 (USD Billion) |
  31. TABLE 16 Asia-Pacific Preclinical CRO Market Size, by End User, 2021–2035 (USD Billion) |
  32. TABLE 17 Competitive Benchmarking Matrix, 2026 |
  33. TABLE 18 Company Profiles – Key Players |
  34. TABLE 19 Recent Developments & Strategic Announcements, 2023–2025 |
  35. TABLE 20 Report Scope & Methodology Summary |
  36. TABLE 21 Detailed Sources & Citations Index Source: Market Research Future (MRFR) Analysis
  37. 16 LIST OF FIGURES |
  38. FIGURE 1 Preclinical CRO Market Dynamics – Drivers, Restraints, Opportunities |
  39. FIGURE 2 Industry Value Chain Analysis |
  40. FIGURE 3 Porter's Five Forces Analysis |
  41. FIGURE 4 Global Market Size Trend, 2021–2035 (USD Billion) |
  42. FIGURE 5 Year-over-Year Growth Curve, 2022–2035 |
  43. FIGURE 6 Service Segment Share, 2025 vs 2035 |
  44. FIGURE 7 Model Type Segment Share, 2025 vs 2035 |
  45. FIGURE 8 End User Segment Share, 2025 |
  46. FIGURE 9 Regional Revenue Share, 2025 |
  47. FIGURE 10 Regional CAGR Comparison, 2026–2035 |
  48. FIGURE 11 Country-Level Contribution Heat Map, 2025 |
  49. FIGURE 12 Competitive Landscape Positioning Matrix, 2026 |
  50. FIGURE 13 Top-Five Provider Share Concentration, 2026 |
  51. FIGURE 14 Technology Adoption Curve – In-Silico and Organoid Platforms Source: Market Research Future (MRFR) Analysis

Segmentation Quick Reference

DimensionSub-SegmentsDominant SegmentFastest Growing Segment
By ServiceToxicology Testing; Bioanalysis & DMPK Studies; Safety Pharmacology; Other ServicesToxicology TestingSafety Pharmacology
By Model TypePatient-Derived Organoid (PDO) Models; Patient-Derived Xenograft (PDX) Models; In-Silico / AI-Driven ModelsPatient-Derived Xenograft (PDX) ModelsPatient-Derived Organoid (PDO) Models
By End UserBiopharma & Pharma Companies; Academic & Research Institutes; Medical Device Companies; Government & OthersBiopharma & Pharma CompaniesAcademic & Research Institutes
By GeographyNorth America; Europe; Asia-Pacific; South America; Middle East & AfricaNorth AmericaAsia-Pacific


Market Segmentation Overview

By Service

Sub-SegmentKey Trend
Toxicology TestingDual-track packages pairing classical studies with alternative-method datasets
Bioanalysis & DMPK StudiesLarge-molecule assay demand outpacing small-molecule workload.
Safety PharmacologyProarrhythmia assessment expanding under revised ICH best practice.
Other ServicesEfficacy modeling and formulation support bundled into IND packages


Service mix is shifting toward complexity rather than volume. Sponsors commission fewer, larger, better-documented studies, and providers capable of assembling a complete IND-enabling package are pulling contract value away from single-assay specialists.

By Model Type

Sub-SegmentKey Trend
Patient-Derived Xenograft (PDX) ModelsRetains regulatory precedent advantage in confirmatory oncology work
Patient-Derived Organoid (PDO) ModelsBiobanked donor libraries enabling high-throughput screening tiers
In-Silico / AI-Driven ModelsEarly liability prediction reducing downstream study attrition


Model selection is becoming a portfolio decision rather than a default. Programs increasingly run computational triage first, organoid screening second, and animal confirmation only for candidates that survive both filters.

By End User

Sub-SegmentKey Trend
Biopharma & Pharma CompaniesMaster service agreements replacing project-by-project procurement
Academic & Research InstitutesTranslational grants driving demand for submission-quality data.
Medical Device CompaniesBiocompatibility testing volumes rising with implant innovation.
Government & OthersBiodefense and public health programs sustaining baseline demand


Client composition is broadening. Academic and government buyers bring different contracting cadences and smaller ticket sizes, prompting providers to build lighter-weight service tiers alongside enterprise agreements.

By Geography

Sub-SegmentKey Trend
North AmericaRegulatory proximity sustaining premium pricing despite cost pressure
Europe3Rs compliance pushing providers toward validated alternative platforms
Asia-PacificCost arbitrage plus rising domestic pipeline demand
South AmericaEarly-stage capacity build anchored by Brazilian regulatory modernization.
Middle East & AfricaSovereign strategy funding creating greenfield infrastructure


Geographic strategy now hinges on where each study tier belongs. Screening and exploratory work migrates toward lower-cost geographies, while pivotal submission-grade studies stay close to the reviewing agency.




Download PDF ×

We do not share your information with anyone. However, we may send you emails based on your report interest from time to time. You may contact us at any time to opt-out.