×
  • Cat-intel
  • MedIntelliX
  • Resources
  • About Us
  • Hero Background
    English
    Chinese
    French
    Japanese
    Korean
    German
    Spanish

    Plant-Based Beverages Market Analysis

    ID: MRFR/F-B & N/5054-CR
    131 Pages
    Pradeep Nandi
    February 2021

    Plant-Based Beverages Market Research Report Information By Source (Fruits, Nuts, Vegetables, Soy, and Seeds & Leaves), By Type (RTD Tea & Coffee, Plant-Based Milk, and Juices), By Distribution Channel (Store-Based, and Non-Store Based), And By Region (North America, Europe, Asia-Pacific, And Rest Of The World) – Market Forecast Till 2035

    Share:
    Download PDF ×

    We do not share your information with anyone. However, we may send you emails based on your report interest from time to time. You may contact us at any time to opt-out.

    Plant-Based Beverages Market Infographic
    Purchase Options

    Market Analysis

    In-depth Analysis of Plant-Based Beverages Market Industry Landscape

    Because they are healthier, better for the environment, and less harmful than cheese, plant-based drinks are growing increasingly popular. More individuals being vegan or flexitarian, health and environmental concerns, and innovative plant-based technology influence the plant-based drink industry. More individuals preferring non-dairy products and no animal testing will harm the sector. Eating differently is a growing ethical and environmental trend. The rising frequency of chronic illnesses worldwide will also increase demand for healthful drinks. Health-conscious consumers desire healthy drinks, expanding the industry. Non-dairy beverage sales will rise as more individuals prioritize health and ethics. People are leading healthier lives as plant-based alternatives become more widespread. The relationship between food choices and animal welfare concerns reveals that various factors influence shopping. As chronic illnesses rise, more people prefer healthful drinks. These drinks are essential nowadays. Because of this, these overlapping trends will likely advance the market throughout the review period, changing how consumers drink.

    Plant-based drinks are growing as health-conscious consumers purchase more dairy substitutes. Low-fat plant-based drinks like almond, soy, and oat milk may be healthier. Plant-based meals are helping people eat healthier and more evenly.

    Environmentalism affects costs too. Due to their environmental friendliness, plant-based drinks satisfy green requirements. Plant-based choices are preferred by those worried about greenhouse gas emissions and animal farm land usage. This boosted the market.

    Veganism and flexitarianism are driving plant-based beverage sales. Plant-based drinks are in high demand as more individuals become vegan for moral reasons or to cut less on meat and dairy. This cultural shift is influencing what consumers purchase and forcing corporations to provide more plant-based items to attract customers.

    New plant-based technologies are transforming the market. New methods of handling and preparing plant-based drinks improve their flavor, texture, and nutritional content. With superior flavor and feel, early plant-based choices are more attractive to more individuals.

    Plant-based drinks are heavily impacted by the economy. As manufacturing has increased and economies of scale have set in, they are now simpler to procure and cheaper. More consumers can purchase plant-based goods, expanding the market.

    People not understanding about plant-based drinks' health advantages, rivalry amongst plant sources, and allergy concerns are commercial issues. Food firms are promoting the health advantages of plant-based meals, analyzing their nutritional worth, and offering a range of plant-based drinks to address these issues.

    Author
    Pradeep Nandi
    Senior Research Analyst

    I have a bachelor's degree in mechanical engineering and an MBA. I have more than two years of expertise in the retail, food, and beverage, chemical, and material industries, and hence have developed a sound cross-domain expertise. A firm believer in lifelong learning and sharing of knowledge. Having a proclivity for hatching ideas and trying to absorb as much information as possible in a short amount of time. Introducing corporates to the data and insight, which enables them to move from probability to possibility, has been my key areas of interest. 

    Leave a Comment

    FAQs

    How much is the Plant-Based Beverages market?

    The Plant-Based Beverages Market size to reach at USD 585.0 billion by 2035.

    What is the growth rate of the Plant-Based Beverages market?

    The Plant-Based Beverages Market is projected to grow at a CAGR of 7.97% during the forecast period, 2025-2035.

    Which region held the largest market share in the Plant-Based Beverages market?

    North America had the largest share in the market.

    Who are the key players in the Plant-Based Beverages market?

    The key players in the market are Coca-Cola Company, PepsiCo Inc., Hain Celestial Group, Danone SA, Fresh Del Monte Produce Inc., Campbell Soup Company, Califia Strategies, Koia Keurig Dr Pepper Inc., and SunOpta Inc.

    Which source led the Plant-Based Beverages market?

    The fruits plant-based beverages category dominated the market in 2022.

    Which distribution channel had the largest market share in the Plant-Based Beverages market?

    The store-based had the largest share in the market.

    Market Summary

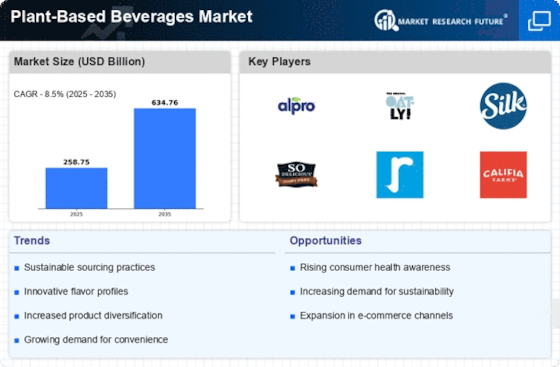
    As per MRFR analysis, the Plant-Based Beverages Market was estimated at 258.75 USD Billion in 2024. The Plant-Based Beverages industry is projected to grow from 280.74 USD Billion in 2025 to 634.76 USD Billion by 2035, exhibiting a compound annual growth rate (CAGR) of 8.5 during the forecast period 2025 - 2035.

    Key Market Trends & Highlights

    The Plant-Based Beverages Market is experiencing robust growth driven by health consciousness and sustainability.

    • The North American market remains the largest, reflecting a strong consumer preference for health and wellness-focused products.
    • In Asia-Pacific, the market is rapidly expanding, driven by increasing awareness of plant-based diets and innovative flavors.
    • Fruits dominate the market as the largest segment, while the nuts segment is emerging as the fastest-growing category.
    • Rising demand for dairy alternatives and environmental concerns are key drivers propelling market growth.

    Market Size & Forecast

    2024 Market Size 258.75 (USD Billion)
    2035 Market Size 634.76 (USD Billion)
    CAGR (2025 - 2035) 8.5%
    Largest Regional Market Share in 2024 North America

    Major Players

    <p>Alpro (BE), Oatly (SE), Silk (US), So Delicious (US), Ripple Foods (US), Califia Farms (US), Mooala (US), Minor Figures (GB), Vitasoy (HK)</p>

    Market Trends

    The Plant-Based Beverages Market is currently experiencing a notable transformation, driven by shifting consumer preferences towards healthier and more sustainable options. This market encompasses a diverse range of products, including plant-based milks, juices, and teas, which are increasingly favored for their perceived health benefits and environmental advantages. As consumers become more health-conscious, the demand for beverages that are free from animal products and artificial additives appears to be on the rise. Additionally, the growing awareness of the environmental impact of traditional dairy and beverage production is prompting a shift towards plant-based alternatives. Moreover, innovation within the Plant-Based Beverages Market is evident, as manufacturers explore new ingredients and flavors to attract a broader audience. The introduction of fortified beverages, which offer added nutritional benefits, seems to resonate well with consumers seeking functional products. Furthermore, the expansion of distribution channels, including online platforms, enhances accessibility, allowing consumers to easily find and purchase these products. Overall, the Plant-Based Beverages Market is poised for continued growth, reflecting a broader trend towards health and sustainability in food and beverage choices.

    Health and Wellness Focus

    The emphasis on health and wellness is a driving force in the Plant-Based Beverages Market. Consumers are increasingly seeking beverages that align with their health goals, leading to a rise in demand for products that are low in sugar, high in nutrients, and free from artificial ingredients.

    Sustainability and Ethical Consumption

    Sustainability plays a crucial role in shaping consumer choices within the Plant-Based Beverages Market. As awareness of environmental issues grows, consumers are more inclined to select products that are produced sustainably, reflecting a commitment to ethical consumption and reducing their carbon footprint.

    Innovation in Flavors and Ingredients

    Innovation is a key trend in the Plant-Based Beverages Market, with manufacturers experimenting with unique flavors and ingredients. This trend not only caters to diverse palates but also introduces consumers to new and exciting beverage options, enhancing the overall market appeal.

    Plant-Based Beverages Market Market Drivers

    Changing Consumer Lifestyles

    The Plant-Based Beverages Market is adapting to the changing lifestyles of consumers, particularly among millennials and Generation Z. These demographics are increasingly prioritizing health, convenience, and sustainability in their purchasing decisions. The rise of on-the-go consumption has led to a demand for ready-to-drink plant-based beverages that fit seamlessly into busy lifestyles. Market Research Future indicates that the convenience segment is projected to grow significantly, with ready-to-drink options becoming a staple in many households. This shift in consumer behavior is prompting brands to innovate and expand their product lines, ensuring that the Plant-Based Beverages Market remains relevant and appealing to a diverse consumer base.

    Increased Retail Availability

    The Plant-Based Beverages Market benefits from increased retail availability, as more retailers recognize the growing consumer demand for plant-based options. Supermarkets, convenience stores, and online platforms are expanding their offerings to include a wider range of plant-based beverages. This trend is supported by market data showing that plant-based beverage sales have seen double-digit growth in recent years. The enhanced visibility and accessibility of these products are likely to drive further adoption among consumers who may have previously been hesitant to try plant-based alternatives. As retail channels continue to evolve, the Plant-Based Beverages Market is poised for sustained growth and expansion.

    Innovative Product Development

    Innovation plays a crucial role in the Plant-Based Beverages Market, as companies continuously explore new flavors, formulations, and health benefits. The introduction of functional beverages, such as those fortified with vitamins, minerals, and probiotics, caters to the evolving preferences of health-conscious consumers. Market data indicates that the functional beverage segment is expected to grow at a compound annual growth rate of over 8 percent in the coming years. This trend not only enhances the appeal of plant-based beverages but also positions them as viable alternatives to traditional drinks. As brands invest in research and development, the Plant-Based Beverages Market is likely to see an influx of diverse and innovative products.

    Rising Demand for Dairy Alternatives

    The Plant-Based Beverages Market experiences a notable surge in demand for dairy alternatives, driven by a growing awareness of lactose intolerance and dairy allergies among consumers. This shift is reflected in market data, indicating that the plant-based milk segment alone is projected to reach a valuation of approximately 20 billion USD by 2026. As consumers increasingly seek healthier options, the appeal of almond, oat, and soy milk continues to rise. This trend is further supported by the increasing availability of these products in mainstream retail channels, making them more accessible to a broader audience. The Plant-Based Beverages Market is thus witnessing a transformation as traditional dairy products face competition from innovative plant-based alternatives.

    Environmental Concerns and Sustainability

    The Plant-Based Beverages Market is significantly influenced by heightened environmental concerns among consumers. The production of plant-based beverages generally requires fewer natural resources compared to traditional dairy farming, leading to a lower carbon footprint. Recent studies suggest that switching to plant-based diets could reduce greenhouse gas emissions by up to 70 percent. This awareness is prompting consumers to opt for beverages that align with their values of sustainability and ethical consumption. As a result, brands that emphasize eco-friendly practices and sustainable sourcing are likely to gain a competitive edge in the Plant-Based Beverages Market, appealing to environmentally conscious consumers.

    Market Segment Insights

    By Source: Fruits (Largest) vs. Nuts (Fastest-Growing)

    <p>In the Plant-Based Beverages Market, the distribution of market share among various sources reveals a clear dominance of fruit-based beverages, recognized for their refreshing taste and versatility. Fruits, such as apples, berries, and tropical varieties, capture a significant share, appealing to health-conscious consumers seeking natural flavors. Meanwhile, nuts-based beverages are rapidly gaining traction, driven by their creamy texture and nutritional benefits, thus positioning themselves as the fastest-growing category within this segment.</p>

    <p>Fruits (Dominant) vs. Nuts (Emerging)</p>

    <p>Fruits hold a dominant position in the Plant-Based Beverages Market due to their widespread acceptance and versatility across various applications, from juices to smoothies. Their natural sweetness and vibrant flavors cater to diverse consumer preferences, contributing to consistent demand. On the other hand, nuts are emerging as a notable segment, with beverages made from almonds, cashews, and other nuts appealing to consumers looking for alternative sources of protein and nutrients. This segment's growth is fueled by increasing interest in lactose-free and vegan diets, making nut-based beverages a strong contender for market share.</p>

    By Type: Plant-Based Milk (Largest) vs. RTD Tea & Coffee (Fastest-Growing)

    <p>Within the Plant-Based Beverages Market, Plant-Based Milk holds the largest share, dominating consumer preferences with its versatility and health benefits. RTD Tea & Coffee follows as a notable contender, capitalizing on the demand for convenient and on-the-go beverage options. Juices, while popular, are growing more steadily and don't boast the same market presence as the top two segments, indicating a significant difference in consumer inclination towards milk alternatives and ready-to-drink solutions.</p>

    <p>Plant-Based Milk (Dominant) vs. RTD Tea & Coffee (Emerging)</p>

    <p>Plant-Based Milk has solidified its position as the dominant player in the segment, appealing to health-conscious consumers with offers of lactose-free, nutrient-rich alternatives. Its wide variety includes almond, soy, oat, and coconut milk, catering to diverse dietary needs and preferences. On the other hand, RTD Tea & Coffee is emerging rapidly, driven by the caffeine consumption trend and the convenience factor for busy lifestyles. This segment's growth can be attributed to innovative flavors and blends, appealing to younger demographics seeking refreshing and energizing options.</p>

    By Distribution Channel: Store-Based (Largest) vs. Non-Store Based (Fastest-Growing)

    <p>In the Plant-Based Beverages Market, store-based distribution channels hold a significant share and dominate retail operations. These channels include supermarkets, health food stores, and convenience stores, where consumers can physically browse and purchase a variety of plant-based beverage options. The convenience of access and the ability to compare products in-person contribute to its substantial market position. In contrast, non-store based channels, which include online retail and direct-to-consumer sales, are rapidly gaining traction due to shifts in consumer purchasing behavior, fueled by increasing digital commerce and convenience preferences. The growth trends within the distribution channel segment reflect a pivotal shift in consumer habits. Online shopping, particularly in the wake of recent global events, has accelerated the adoption of non-store-based channels as consumers seek convenience and safety. Additionally, expanding plant-based product ranges on e-commerce platforms, along with targeted marketing efforts and enhanced delivery services, are driving this segment's rapid growth. These trends suggest a balanced yet competitive dynamic between store-based and non-store based channels in the Plant-Based Beverages Market.</p>

    <p>Distribution Channel: Store-Based (Dominant) vs. Non-Store Based (Emerging)</p>

    <p>Store-based distribution channels represent a dominant presence in the Plant-Based Beverages Market, offering consumers a tactile shopping experience that is hard to replicate online. Typically, these channels boast well-established relationships with suppliers and a diverse array of branded products, allowing customers to easily find their familiar favorites as well as new innovations. On the other hand, non-store based channels, characterized by their rapid expansion, cater to a growing demographic excited by the ease and accessibility of online shopping. These emerging platforms not only provide quicker access to products but often feature exclusive online offerings. The interplay between established store-based outlets and the burgeoning non-store sector paints a vibrant picture of evolving consumer preferences and shopping behaviors in this dynamic market.</p>

    Get more detailed insights about Plant-Based Beverages Market Research Report - Forecast to 2035

    Regional Insights

    By Region, the study provides the market insights into North America, Europe, Asia-Pacific and Rest of the World. North America Plant-Based Beverages market accounted for USD 100.66 billion in 2022 and is expected to exhibit a significant CAGR growth during the study period. The demand for plant-based beverages in North America is driven by health and wellness trends, environmental concerns, and the rise of veganism and vegetarianism. The popularity of plant-based milk alternatives, such as almond milk and soy milk, is also contributing to the growth of the market.

    The region is home to several major plant-based beverage manufacturers, including Silk, So Delicious, and Califia Farms. U.S. being the biggest contributor to the market.

    Further, the major countries studied in the market report are: The U.S, Canada, Germany, France, UK, Italy, Spain, China, Japan, India, Australia, South Korea, and Brazil.

    Figure 3:  PLANT-BASED BEVERAGES MARKET SHARE BY REGION 2022 (%)PLANT-BASED BEVERAGES MARKET SHARE BY REGION 2022Source: Secondary Research, Primary Research, Market Research Future Database and Analyst Review

    Europe Plant-Based Beverages market accounts for the second-largest market share due to the health and wellness trends and environmental concerns. Soy milk and almond milk are the most popular plant-based milk alternatives in Europe. The region is also home to several major plant-based beverage manufacturers, including Alpro, Oatly, and Innocent. Further, the Germany Plant-Based Beverages market held the largest market share, and the UK Plant-Based Beverages market was the fastest growing market in the European region.

    The Asia-Pacific Plant-Based Beverages Market is expected to grow at the fastest CAGR from 2022 to 2030. The Asia-Pacific Plant-Based Beverages market is driven by increasing consumer awareness of the health and environmental benefits of plant-based products. The region is home to several large and emerging markets, including China, Japan, India, and Australia. Soy milk and almond milk are the most popular plant-based milk alternatives in the region, but other types of plant-based beverages, such as coconut milk and rice milk, are also gaining popularity.

    The region is home to several major plant-based beverage manufacturers, including Vitasoy International Holdings Ltd, Sanitarium Health and Wellbeing Company, and Nestle S.A. Moreover, China plant-based beverages market held the largest market share, and the India plant-based beverages market was the fastest growing market in the Asia-Pacific region.

    Key Players and Competitive Insights

    Major market players are spending a lot of money on R&D to increase their product lines, which will help the Plant-Based Beverages market grow even more. Market participants are also taking a range of strategic initiatives to grow their worldwide footprint, with key market developments such as new product launches, contractual agreements, mergers and acquisitions, increased investments, and collaboration with other organizations. Competitors in the Plant-Based Beverages industry must offer healthy items to expand and survive in an increasingly competitive and rising market environment.

    One of the primary business strategies adopted by manufacturers in the Plant-Based Beverages industry to benefit clients and expand the market sector is to manufacture locally to reduce operating costs. In recent years, Plant-Based Beverages industry has provided innovative products with some of the most significant benefits. The Plant-Based Beverages market major player such as Coca-Cola Company, PepsiCo Inc., Hain Celestial Group, Danone SA, Fresh Del Monte Produce Inc., Campbell Soup Company, Califia Strategies, Koia Keurig Dr Pepper Inc., SunOpta Inc. and others are working to expand the market demand by investing in research and development activities.

    PepsiCo is a multinational food and beverage company headquartered in New York. The company was founded in 1965 through the merger of Pepsi-Cola and Frito-Lay. PepsiCo has since expanded to become one of the world's largest food and beverage companies, with a portfolio of over 22 brands. PepsiCo's product portfolio includes a wide range of food and beverage products, including soft drinks, sports drinks, juices, snacks, and breakfast foods. The company operates in more than 200 countries and has a workforce of over 300,000 employees.

    In June 2021, PepsiCo and Beyond Meat announced a joint venture called The PLANeT Partnership to develop, produce, and market plant-based snacks and beverages.

    Danone SA is a multinational food and beverage company based in France. The company was founded in 1919 and has since expanded to become one of the largest dairy and plant-based food companies in the world. Danone's product portfolio includes a range of dairy products, such as yogurt and cheese, as well as plant-based alternatives, including soy, almond, and oat milk, among others. In November 2020, Danone and Biospringer, a producer of yeast-based ingredients, partnered to develop and market plant-based food products.

    Key Companies in the Plant-Based Beverages Market market include

    Industry Developments

    January 2019: Coca-Cola launched a line of plant-based dairy alternatives under its AdeZ brand, made from a blend of almonds, rice, and oats.

    March 2021: Silk launched a line of protein-packed plant-based milk alternatives made from a blend of pea protein and oat milk.

    May 2019: Nestle acquired a majority stake in Terrafertil, a leading producer of organic and plant-based foods, including beverages.

    October 2020: Danone acquired Earth Island, the maker of Follow Your Heart brand plant-based foods and beverages, including plant-based milk and mayonnaise.

    April 2021: PepsiCo announced the acquisition of Health Warrior, a plant-based snack and beverage company that produces products such as plant-based protein bars and smoothie bowls.

    Future Outlook

    Plant-Based Beverages Market Future Outlook

    <p>The Plant-Based Beverages Market is projected to grow at an 8.5% CAGR from 2024 to 2035, driven by health consciousness, sustainability trends, and innovation in product offerings.</p>

    New opportunities lie in:

    • <p>Expansion into emerging markets with tailored product lines.</p>
    • <p>Development of subscription-based delivery services for convenience.</p>
    • <p>Investment in sustainable packaging solutions to enhance brand loyalty.</p>

    <p>By 2035, the market is expected to solidify its position as a leader in the beverage industry.</p>

    Market Segmentation

    Plant-Based Beverages Market Type Outlook

    • RTD Tea & Coffee
    • Plant-Based Milk
    • Juices

    Plant-Based Beverages Market Source Outlook

    • Fruits
    • Nuts
    • Vegetables
    • Soy
    • Seeds & Leaves

    Plant-Based Beverages Market Distribution Channel Outlook

    • Store-Based
    • Non-Store Based

    Report Scope

    MARKET SIZE 2024258.75(USD Billion)
    MARKET SIZE 2025280.74(USD Billion)
    MARKET SIZE 2035634.76(USD Billion)
    COMPOUND ANNUAL GROWTH RATE (CAGR)8.5% (2024 - 2035)
    REPORT COVERAGERevenue Forecast, Competitive Landscape, Growth Factors, and Trends
    BASE YEAR2024
    Market Forecast Period2025 - 2035
    Historical Data2019 - 2024
    Market Forecast UnitsUSD Billion
    Key Companies ProfiledMarket analysis in progress
    Segments CoveredMarket segmentation analysis in progress
    Key Market OpportunitiesGrowing consumer demand for sustainable and health-conscious alternatives in the Plant-Based Beverages Market.
    Key Market DynamicsRising consumer preference for health-conscious options drives innovation and competition in the Plant-Based Beverages Market.
    Countries CoveredNorth America, Europe, APAC, South America, MEA

    FAQs

    How much is the Plant-Based Beverages market?

    The Plant-Based Beverages Market size to reach at USD 585.0 billion by 2035.

    What is the growth rate of the Plant-Based Beverages market?

    The Plant-Based Beverages Market is projected to grow at a CAGR of 7.97% during the forecast period, 2025-2035.

    Which region held the largest market share in the Plant-Based Beverages market?

    North America had the largest share in the market.

    Who are the key players in the Plant-Based Beverages market?

    The key players in the market are Coca-Cola Company, PepsiCo Inc., Hain Celestial Group, Danone SA, Fresh Del Monte Produce Inc., Campbell Soup Company, Califia Strategies, Koia Keurig Dr Pepper Inc., and SunOpta Inc.

    Which source led the Plant-Based Beverages market?

    The fruits plant-based beverages category dominated the market in 2022.

    Which distribution channel had the largest market share in the Plant-Based Beverages market?

    The store-based had the largest share in the market.

    1. SECTION I: EXECUTIVE SUMMARY AND KEY HIGHLIGHTS
      1. | 1.1 EXECUTIVE SUMMARY
      2. | | 1.1.1 Market Overview
      3. | | 1.1.2 Key Findings
      4. | | 1.1.3 Market Segmentation
      5. | | 1.1.4 Competitive Landscape
      6. | | 1.1.5 Challenges and Opportunities
      7. | | 1.1.6 Future Outlook
    2. SECTION II: SCOPING, METHODOLOGY AND MARKET STRUCTURE
      1. | 2.1 MARKET INTRODUCTION
      2. | | 2.1.1 Definition
      3. | | 2.1.2 Scope of the study
      4. | | | 2.1.2.1 Research Objective
      5. | | | 2.1.2.2 Assumption
      6. | | | 2.1.2.3 Limitations
      7. | 2.2 RESEARCH METHODOLOGY
      8. | | 2.2.1 Overview
      9. | | 2.2.2 Data Mining
      10. | | 2.2.3 Secondary Research
      11. | | 2.2.4 Primary Research
      12. | | | 2.2.4.1 Primary Interviews and Information Gathering Process
      13. | | | 2.2.4.2 Breakdown of Primary Respondents
      14. | | 2.2.5 Forecasting Model
      15. | | 2.2.6 Market Size Estimation
      16. | | | 2.2.6.1 Bottom-Up Approach
      17. | | | 2.2.6.2 Top-Down Approach
      18. | | 2.2.7 Data Triangulation
      19. | | 2.2.8 Validation
    3. SECTION III: QUALITATIVE ANALYSIS
      1. | 3.1 MARKET DYNAMICS
      2. | | 3.1.1 Overview
      3. | | 3.1.2 Drivers
      4. | | 3.1.3 Restraints
      5. | | 3.1.4 Opportunities
      6. | 3.2 MARKET FACTOR ANALYSIS
      7. | | 3.2.1 Value chain Analysis
      8. | | 3.2.2 Porter's Five Forces Analysis
      9. | | | 3.2.2.1 Bargaining Power of Suppliers
      10. | | | 3.2.2.2 Bargaining Power of Buyers
      11. | | | 3.2.2.3 Threat of New Entrants
      12. | | | 3.2.2.4 Threat of Substitutes
      13. | | | 3.2.2.5 Intensity of Rivalry
      14. | | 3.2.3 COVID-19 Impact Analysis
      15. | | | 3.2.3.1 Market Impact Analysis
      16. | | | 3.2.3.2 Regional Impact
      17. | | | 3.2.3.3 Opportunity and Threat Analysis
    4. SECTION IV: QUANTITATIVE ANALYSIS
      1. | 4.1 Food, Beverages & Nutrition, BY Source (USD Billion)
      2. | | 4.1.1 Fruits
      3. | | 4.1.2 Nuts
      4. | | 4.1.3 Vegetables
      5. | | 4.1.4 Soy
      6. | | 4.1.5 Seeds & Leaves
      7. | 4.2 Food, Beverages & Nutrition, BY Type (USD Billion)
      8. | | 4.2.1 RTD Tea & Coffee
      9. | | 4.2.2 Plant-Based Milk
      10. | | 4.2.3 Juices
      11. | 4.3 Food, Beverages & Nutrition, BY Distribution Channel (USD Billion)
      12. | | 4.3.1 Store-Based
      13. | | 4.3.2 Non-Store Based
      14. | 4.4 Food, Beverages & Nutrition, BY Region (USD Billion)
      15. | | 4.4.1 North America
      16. | | | 4.4.1.1 US
      17. | | | 4.4.1.2 Canada
      18. | | 4.4.2 Europe
      19. | | | 4.4.2.1 Germany
      20. | | | 4.4.2.2 UK
      21. | | | 4.4.2.3 France
      22. | | | 4.4.2.4 Russia
      23. | | | 4.4.2.5 Italy
      24. | | | 4.4.2.6 Spain
      25. | | | 4.4.2.7 Rest of Europe
      26. | | 4.4.3 APAC
      27. | | | 4.4.3.1 China
      28. | | | 4.4.3.2 India
      29. | | | 4.4.3.3 Japan
      30. | | | 4.4.3.4 South Korea
      31. | | | 4.4.3.5 Malaysia
      32. | | | 4.4.3.6 Thailand
      33. | | | 4.4.3.7 Indonesia
      34. | | | 4.4.3.8 Rest of APAC
      35. | | 4.4.4 South America
      36. | | | 4.4.4.1 Brazil
      37. | | | 4.4.4.2 Mexico
      38. | | | 4.4.4.3 Argentina
      39. | | | 4.4.4.4 Rest of South America
      40. | | 4.4.5 MEA
      41. | | | 4.4.5.1 GCC Countries
      42. | | | 4.4.5.2 South Africa
      43. | | | 4.4.5.3 Rest of MEA
    5. SECTION V: COMPETITIVE ANALYSIS
      1. | 5.1 Competitive Landscape
      2. | | 5.1.1 Overview
      3. | | 5.1.2 Competitive Analysis
      4. | | 5.1.3 Market share Analysis
      5. | | 5.1.4 Major Growth Strategy in the Food, Beverages & Nutrition
      6. | | 5.1.5 Competitive Benchmarking
      7. | | 5.1.6 Leading Players in Terms of Number of Developments in the Food, Beverages & Nutrition
      8. | | 5.1.7 Key developments and growth strategies
      9. | | | 5.1.7.1 New Product Launch/Service Deployment
      10. | | | 5.1.7.2 Merger & Acquisitions
      11. | | | 5.1.7.3 Joint Ventures
      12. | | 5.1.8 Major Players Financial Matrix
      13. | | | 5.1.8.1 Sales and Operating Income
      14. | | | 5.1.8.2 Major Players R&D Expenditure. 2023
      15. | 5.2 Company Profiles
      16. | | 5.2.1 Alpro (BE)
      17. | | | 5.2.1.1 Financial Overview
      18. | | | 5.2.1.2 Products Offered
      19. | | | 5.2.1.3 Key Developments
      20. | | | 5.2.1.4 SWOT Analysis
      21. | | | 5.2.1.5 Key Strategies
      22. | | 5.2.2 Oatly (SE)
      23. | | | 5.2.2.1 Financial Overview
      24. | | | 5.2.2.2 Products Offered
      25. | | | 5.2.2.3 Key Developments
      26. | | | 5.2.2.4 SWOT Analysis
      27. | | | 5.2.2.5 Key Strategies
      28. | | 5.2.3 Silk (US)
      29. | | | 5.2.3.1 Financial Overview
      30. | | | 5.2.3.2 Products Offered
      31. | | | 5.2.3.3 Key Developments
      32. | | | 5.2.3.4 SWOT Analysis
      33. | | | 5.2.3.5 Key Strategies
      34. | | 5.2.4 So Delicious (US)
      35. | | | 5.2.4.1 Financial Overview
      36. | | | 5.2.4.2 Products Offered
      37. | | | 5.2.4.3 Key Developments
      38. | | | 5.2.4.4 SWOT Analysis
      39. | | | 5.2.4.5 Key Strategies
      40. | | 5.2.5 Ripple Foods (US)
      41. | | | 5.2.5.1 Financial Overview
      42. | | | 5.2.5.2 Products Offered
      43. | | | 5.2.5.3 Key Developments
      44. | | | 5.2.5.4 SWOT Analysis
      45. | | | 5.2.5.5 Key Strategies
      46. | | 5.2.6 Califia Farms (US)
      47. | | | 5.2.6.1 Financial Overview
      48. | | | 5.2.6.2 Products Offered
      49. | | | 5.2.6.3 Key Developments
      50. | | | 5.2.6.4 SWOT Analysis
      51. | | | 5.2.6.5 Key Strategies
      52. | | 5.2.7 Mooala (US)
      53. | | | 5.2.7.1 Financial Overview
      54. | | | 5.2.7.2 Products Offered
      55. | | | 5.2.7.3 Key Developments
      56. | | | 5.2.7.4 SWOT Analysis
      57. | | | 5.2.7.5 Key Strategies
      58. | | 5.2.8 Minor Figures (GB)
      59. | | | 5.2.8.1 Financial Overview
      60. | | | 5.2.8.2 Products Offered
      61. | | | 5.2.8.3 Key Developments
      62. | | | 5.2.8.4 SWOT Analysis
      63. | | | 5.2.8.5 Key Strategies
      64. | | 5.2.9 Vitasoy (HK)
      65. | | | 5.2.9.1 Financial Overview
      66. | | | 5.2.9.2 Products Offered
      67. | | | 5.2.9.3 Key Developments
      68. | | | 5.2.9.4 SWOT Analysis
      69. | | | 5.2.9.5 Key Strategies
      70. | 5.3 Appendix
      71. | | 5.3.1 References
      72. | | 5.3.2 Related Reports
    6. LIST OF FIGURES
      1. | 6.1 MARKET SYNOPSIS
      2. | 6.2 NORTH AMERICA MARKET ANALYSIS
      3. | 6.3 US MARKET ANALYSIS BY SOURCE
      4. | 6.4 US MARKET ANALYSIS BY TYPE
      5. | 6.5 US MARKET ANALYSIS BY DISTRIBUTION CHANNEL
      6. | 6.6 CANADA MARKET ANALYSIS BY SOURCE
      7. | 6.7 CANADA MARKET ANALYSIS BY TYPE
      8. | 6.8 CANADA MARKET ANALYSIS BY DISTRIBUTION CHANNEL
      9. | 6.9 EUROPE MARKET ANALYSIS
      10. | 6.10 GERMANY MARKET ANALYSIS BY SOURCE
      11. | 6.11 GERMANY MARKET ANALYSIS BY TYPE
      12. | 6.12 GERMANY MARKET ANALYSIS BY DISTRIBUTION CHANNEL
      13. | 6.13 UK MARKET ANALYSIS BY SOURCE
      14. | 6.14 UK MARKET ANALYSIS BY TYPE
      15. | 6.15 UK MARKET ANALYSIS BY DISTRIBUTION CHANNEL
      16. | 6.16 FRANCE MARKET ANALYSIS BY SOURCE
      17. | 6.17 FRANCE MARKET ANALYSIS BY TYPE
      18. | 6.18 FRANCE MARKET ANALYSIS BY DISTRIBUTION CHANNEL
      19. | 6.19 RUSSIA MARKET ANALYSIS BY SOURCE
      20. | 6.20 RUSSIA MARKET ANALYSIS BY TYPE
      21. | 6.21 RUSSIA MARKET ANALYSIS BY DISTRIBUTION CHANNEL
      22. | 6.22 ITALY MARKET ANALYSIS BY SOURCE
      23. | 6.23 ITALY MARKET ANALYSIS BY TYPE
      24. | 6.24 ITALY MARKET ANALYSIS BY DISTRIBUTION CHANNEL
      25. | 6.25 SPAIN MARKET ANALYSIS BY SOURCE
      26. | 6.26 SPAIN MARKET ANALYSIS BY TYPE
      27. | 6.27 SPAIN MARKET ANALYSIS BY DISTRIBUTION CHANNEL
      28. | 6.28 REST OF EUROPE MARKET ANALYSIS BY SOURCE
      29. | 6.29 REST OF EUROPE MARKET ANALYSIS BY TYPE
      30. | 6.30 REST OF EUROPE MARKET ANALYSIS BY DISTRIBUTION CHANNEL
      31. | 6.31 APAC MARKET ANALYSIS
      32. | 6.32 CHINA MARKET ANALYSIS BY SOURCE
      33. | 6.33 CHINA MARKET ANALYSIS BY TYPE
      34. | 6.34 CHINA MARKET ANALYSIS BY DISTRIBUTION CHANNEL
      35. | 6.35 INDIA MARKET ANALYSIS BY SOURCE
      36. | 6.36 INDIA MARKET ANALYSIS BY TYPE
      37. | 6.37 INDIA MARKET ANALYSIS BY DISTRIBUTION CHANNEL
      38. | 6.38 JAPAN MARKET ANALYSIS BY SOURCE
      39. | 6.39 JAPAN MARKET ANALYSIS BY TYPE
      40. | 6.40 JAPAN MARKET ANALYSIS BY DISTRIBUTION CHANNEL
      41. | 6.41 SOUTH KOREA MARKET ANALYSIS BY SOURCE
      42. | 6.42 SOUTH KOREA MARKET ANALYSIS BY TYPE
      43. | 6.43 SOUTH KOREA MARKET ANALYSIS BY DISTRIBUTION CHANNEL
      44. | 6.44 MALAYSIA MARKET ANALYSIS BY SOURCE
      45. | 6.45 MALAYSIA MARKET ANALYSIS BY TYPE
      46. | 6.46 MALAYSIA MARKET ANALYSIS BY DISTRIBUTION CHANNEL
      47. | 6.47 THAILAND MARKET ANALYSIS BY SOURCE
      48. | 6.48 THAILAND MARKET ANALYSIS BY TYPE
      49. | 6.49 THAILAND MARKET ANALYSIS BY DISTRIBUTION CHANNEL
      50. | 6.50 INDONESIA MARKET ANALYSIS BY SOURCE
      51. | 6.51 INDONESIA MARKET ANALYSIS BY TYPE
      52. | 6.52 INDONESIA MARKET ANALYSIS BY DISTRIBUTION CHANNEL
      53. | 6.53 REST OF APAC MARKET ANALYSIS BY SOURCE
      54. | 6.54 REST OF APAC MARKET ANALYSIS BY TYPE
      55. | 6.55 REST OF APAC MARKET ANALYSIS BY DISTRIBUTION CHANNEL
      56. | 6.56 SOUTH AMERICA MARKET ANALYSIS
      57. | 6.57 BRAZIL MARKET ANALYSIS BY SOURCE
      58. | 6.58 BRAZIL MARKET ANALYSIS BY TYPE
      59. | 6.59 BRAZIL MARKET ANALYSIS BY DISTRIBUTION CHANNEL
      60. | 6.60 MEXICO MARKET ANALYSIS BY SOURCE
      61. | 6.61 MEXICO MARKET ANALYSIS BY TYPE
      62. | 6.62 MEXICO MARKET ANALYSIS BY DISTRIBUTION CHANNEL
      63. | 6.63 ARGENTINA MARKET ANALYSIS BY SOURCE
      64. | 6.64 ARGENTINA MARKET ANALYSIS BY TYPE
      65. | 6.65 ARGENTINA MARKET ANALYSIS BY DISTRIBUTION CHANNEL
      66. | 6.66 REST OF SOUTH AMERICA MARKET ANALYSIS BY SOURCE
      67. | 6.67 REST OF SOUTH AMERICA MARKET ANALYSIS BY TYPE
      68. | 6.68 REST OF SOUTH AMERICA MARKET ANALYSIS BY DISTRIBUTION CHANNEL
      69. | 6.69 MEA MARKET ANALYSIS
      70. | 6.70 GCC COUNTRIES MARKET ANALYSIS BY SOURCE
      71. | 6.71 GCC COUNTRIES MARKET ANALYSIS BY TYPE
      72. | 6.72 GCC COUNTRIES MARKET ANALYSIS BY DISTRIBUTION CHANNEL
      73. | 6.73 SOUTH AFRICA MARKET ANALYSIS BY SOURCE
      74. | 6.74 SOUTH AFRICA MARKET ANALYSIS BY TYPE
      75. | 6.75 SOUTH AFRICA MARKET ANALYSIS BY DISTRIBUTION CHANNEL
      76. | 6.76 REST OF MEA MARKET ANALYSIS BY SOURCE
      77. | 6.77 REST OF MEA MARKET ANALYSIS BY TYPE
      78. | 6.78 REST OF MEA MARKET ANALYSIS BY DISTRIBUTION CHANNEL
      79. | 6.79 KEY BUYING CRITERIA OF FOOD, BEVERAGES & NUTRITION
      80. | 6.80 RESEARCH PROCESS OF MRFR
      81. | 6.81 DRO ANALYSIS OF FOOD, BEVERAGES & NUTRITION
      82. | 6.82 DRIVERS IMPACT ANALYSIS: FOOD, BEVERAGES & NUTRITION
      83. | 6.83 RESTRAINTS IMPACT ANALYSIS: FOOD, BEVERAGES & NUTRITION
      84. | 6.84 SUPPLY / VALUE CHAIN: FOOD, BEVERAGES & NUTRITION
      85. | 6.85 FOOD, BEVERAGES & NUTRITION, BY SOURCE, 2024 (% SHARE)
      86. | 6.86 FOOD, BEVERAGES & NUTRITION, BY SOURCE, 2024 TO 2035 (USD Billion)
      87. | 6.87 FOOD, BEVERAGES & NUTRITION, BY TYPE, 2024 (% SHARE)
      88. | 6.88 FOOD, BEVERAGES & NUTRITION, BY TYPE, 2024 TO 2035 (USD Billion)
      89. | 6.89 FOOD, BEVERAGES & NUTRITION, BY DISTRIBUTION CHANNEL, 2024 (% SHARE)
      90. | 6.90 FOOD, BEVERAGES & NUTRITION, BY DISTRIBUTION CHANNEL, 2024 TO 2035 (USD Billion)
      91. | 6.91 BENCHMARKING OF MAJOR COMPETITORS
    7. LIST OF TABLES
      1. | 7.1 LIST OF ASSUMPTIONS
      2. | | 7.1.1
      3. | 7.2 North America MARKET SIZE ESTIMATES; FORECAST
      4. | | 7.2.1 BY SOURCE, 2025-2035 (USD Billion)
      5. | | 7.2.2 BY TYPE, 2025-2035 (USD Billion)
      6. | | 7.2.3 BY DISTRIBUTION CHANNEL, 2025-2035 (USD Billion)
      7. | 7.3 US MARKET SIZE ESTIMATES; FORECAST
      8. | | 7.3.1 BY SOURCE, 2025-2035 (USD Billion)
      9. | | 7.3.2 BY TYPE, 2025-2035 (USD Billion)
      10. | | 7.3.3 BY DISTRIBUTION CHANNEL, 2025-2035 (USD Billion)
      11. | 7.4 Canada MARKET SIZE ESTIMATES; FORECAST
      12. | | 7.4.1 BY SOURCE, 2025-2035 (USD Billion)
      13. | | 7.4.2 BY TYPE, 2025-2035 (USD Billion)
      14. | | 7.4.3 BY DISTRIBUTION CHANNEL, 2025-2035 (USD Billion)
      15. | 7.5 Europe MARKET SIZE ESTIMATES; FORECAST
      16. | | 7.5.1 BY SOURCE, 2025-2035 (USD Billion)
      17. | | 7.5.2 BY TYPE, 2025-2035 (USD Billion)
      18. | | 7.5.3 BY DISTRIBUTION CHANNEL, 2025-2035 (USD Billion)
      19. | 7.6 Germany MARKET SIZE ESTIMATES; FORECAST
      20. | | 7.6.1 BY SOURCE, 2025-2035 (USD Billion)
      21. | | 7.6.2 BY TYPE, 2025-2035 (USD Billion)
      22. | | 7.6.3 BY DISTRIBUTION CHANNEL, 2025-2035 (USD Billion)
      23. | 7.7 UK MARKET SIZE ESTIMATES; FORECAST
      24. | | 7.7.1 BY SOURCE, 2025-2035 (USD Billion)
      25. | | 7.7.2 BY TYPE, 2025-2035 (USD Billion)
      26. | | 7.7.3 BY DISTRIBUTION CHANNEL, 2025-2035 (USD Billion)
      27. | 7.8 France MARKET SIZE ESTIMATES; FORECAST
      28. | | 7.8.1 BY SOURCE, 2025-2035 (USD Billion)
      29. | | 7.8.2 BY TYPE, 2025-2035 (USD Billion)
      30. | | 7.8.3 BY DISTRIBUTION CHANNEL, 2025-2035 (USD Billion)
      31. | 7.9 Russia MARKET SIZE ESTIMATES; FORECAST
      32. | | 7.9.1 BY SOURCE, 2025-2035 (USD Billion)
      33. | | 7.9.2 BY TYPE, 2025-2035 (USD Billion)
      34. | | 7.9.3 BY DISTRIBUTION CHANNEL, 2025-2035 (USD Billion)
      35. | 7.10 Italy MARKET SIZE ESTIMATES; FORECAST
      36. | | 7.10.1 BY SOURCE, 2025-2035 (USD Billion)
      37. | | 7.10.2 BY TYPE, 2025-2035 (USD Billion)
      38. | | 7.10.3 BY DISTRIBUTION CHANNEL, 2025-2035 (USD Billion)
      39. | 7.11 Spain MARKET SIZE ESTIMATES; FORECAST
      40. | | 7.11.1 BY SOURCE, 2025-2035 (USD Billion)
      41. | | 7.11.2 BY TYPE, 2025-2035 (USD Billion)
      42. | | 7.11.3 BY DISTRIBUTION CHANNEL, 2025-2035 (USD Billion)
      43. | 7.12 Rest of Europe MARKET SIZE ESTIMATES; FORECAST
      44. | | 7.12.1 BY SOURCE, 2025-2035 (USD Billion)
      45. | | 7.12.2 BY TYPE, 2025-2035 (USD Billion)
      46. | | 7.12.3 BY DISTRIBUTION CHANNEL, 2025-2035 (USD Billion)
      47. | 7.13 APAC MARKET SIZE ESTIMATES; FORECAST
      48. | | 7.13.1 BY SOURCE, 2025-2035 (USD Billion)
      49. | | 7.13.2 BY TYPE, 2025-2035 (USD Billion)
      50. | | 7.13.3 BY DISTRIBUTION CHANNEL, 2025-2035 (USD Billion)
      51. | 7.14 China MARKET SIZE ESTIMATES; FORECAST
      52. | | 7.14.1 BY SOURCE, 2025-2035 (USD Billion)
      53. | | 7.14.2 BY TYPE, 2025-2035 (USD Billion)
      54. | | 7.14.3 BY DISTRIBUTION CHANNEL, 2025-2035 (USD Billion)
      55. | 7.15 India MARKET SIZE ESTIMATES; FORECAST
      56. | | 7.15.1 BY SOURCE, 2025-2035 (USD Billion)
      57. | | 7.15.2 BY TYPE, 2025-2035 (USD Billion)
      58. | | 7.15.3 BY DISTRIBUTION CHANNEL, 2025-2035 (USD Billion)
      59. | 7.16 Japan MARKET SIZE ESTIMATES; FORECAST
      60. | | 7.16.1 BY SOURCE, 2025-2035 (USD Billion)
      61. | | 7.16.2 BY TYPE, 2025-2035 (USD Billion)
      62. | | 7.16.3 BY DISTRIBUTION CHANNEL, 2025-2035 (USD Billion)
      63. | 7.17 South Korea MARKET SIZE ESTIMATES; FORECAST
      64. | | 7.17.1 BY SOURCE, 2025-2035 (USD Billion)
      65. | | 7.17.2 BY TYPE, 2025-2035 (USD Billion)
      66. | | 7.17.3 BY DISTRIBUTION CHANNEL, 2025-2035 (USD Billion)
      67. | 7.18 Malaysia MARKET SIZE ESTIMATES; FORECAST
      68. | | 7.18.1 BY SOURCE, 2025-2035 (USD Billion)
      69. | | 7.18.2 BY TYPE, 2025-2035 (USD Billion)
      70. | | 7.18.3 BY DISTRIBUTION CHANNEL, 2025-2035 (USD Billion)
      71. | 7.19 Thailand MARKET SIZE ESTIMATES; FORECAST
      72. | | 7.19.1 BY SOURCE, 2025-2035 (USD Billion)
      73. | | 7.19.2 BY TYPE, 2025-2035 (USD Billion)
      74. | | 7.19.3 BY DISTRIBUTION CHANNEL, 2025-2035 (USD Billion)
      75. | 7.20 Indonesia MARKET SIZE ESTIMATES; FORECAST
      76. | | 7.20.1 BY SOURCE, 2025-2035 (USD Billion)
      77. | | 7.20.2 BY TYPE, 2025-2035 (USD Billion)
      78. | | 7.20.3 BY DISTRIBUTION CHANNEL, 2025-2035 (USD Billion)
      79. | 7.21 Rest of APAC MARKET SIZE ESTIMATES; FORECAST
      80. | | 7.21.1 BY SOURCE, 2025-2035 (USD Billion)
      81. | | 7.21.2 BY TYPE, 2025-2035 (USD Billion)
      82. | | 7.21.3 BY DISTRIBUTION CHANNEL, 2025-2035 (USD Billion)
      83. | 7.22 South America MARKET SIZE ESTIMATES; FORECAST
      84. | | 7.22.1 BY SOURCE, 2025-2035 (USD Billion)
      85. | | 7.22.2 BY TYPE, 2025-2035 (USD Billion)
      86. | | 7.22.3 BY DISTRIBUTION CHANNEL, 2025-2035 (USD Billion)
      87. | 7.23 Brazil MARKET SIZE ESTIMATES; FORECAST
      88. | | 7.23.1 BY SOURCE, 2025-2035 (USD Billion)
      89. | | 7.23.2 BY TYPE, 2025-2035 (USD Billion)
      90. | | 7.23.3 BY DISTRIBUTION CHANNEL, 2025-2035 (USD Billion)
      91. | 7.24 Mexico MARKET SIZE ESTIMATES; FORECAST
      92. | | 7.24.1 BY SOURCE, 2025-2035 (USD Billion)
      93. | | 7.24.2 BY TYPE, 2025-2035 (USD Billion)
      94. | | 7.24.3 BY DISTRIBUTION CHANNEL, 2025-2035 (USD Billion)
      95. | 7.25 Argentina MARKET SIZE ESTIMATES; FORECAST
      96. | | 7.25.1 BY SOURCE, 2025-2035 (USD Billion)
      97. | | 7.25.2 BY TYPE, 2025-2035 (USD Billion)
      98. | | 7.25.3 BY DISTRIBUTION CHANNEL, 2025-2035 (USD Billion)
      99. | 7.26 Rest of South America MARKET SIZE ESTIMATES; FORECAST
      100. | | 7.26.1 BY SOURCE, 2025-2035 (USD Billion)
      101. | | 7.26.2 BY TYPE, 2025-2035 (USD Billion)
      102. | | 7.26.3 BY DISTRIBUTION CHANNEL, 2025-2035 (USD Billion)
      103. | 7.27 MEA MARKET SIZE ESTIMATES; FORECAST
      104. | | 7.27.1 BY SOURCE, 2025-2035 (USD Billion)
      105. | | 7.27.2 BY TYPE, 2025-2035 (USD Billion)
      106. | | 7.27.3 BY DISTRIBUTION CHANNEL, 2025-2035 (USD Billion)
      107. | 7.28 GCC Countries MARKET SIZE ESTIMATES; FORECAST
      108. | | 7.28.1 BY SOURCE, 2025-2035 (USD Billion)
      109. | | 7.28.2 BY TYPE, 2025-2035 (USD Billion)
      110. | | 7.28.3 BY DISTRIBUTION CHANNEL, 2025-2035 (USD Billion)
      111. | 7.29 South Africa MARKET SIZE ESTIMATES; FORECAST
      112. | | 7.29.1 BY SOURCE, 2025-2035 (USD Billion)
      113. | | 7.29.2 BY TYPE, 2025-2035 (USD Billion)
      114. | | 7.29.3 BY DISTRIBUTION CHANNEL, 2025-2035 (USD Billion)
      115. | 7.30 Rest of MEA MARKET SIZE ESTIMATES; FORECAST
      116. | | 7.30.1 BY SOURCE, 2025-2035 (USD Billion)
      117. | | 7.30.2 BY TYPE, 2025-2035 (USD Billion)
      118. | | 7.30.3 BY DISTRIBUTION CHANNEL, 2025-2035 (USD Billion)
      119. | 7.31 PRODUCT LAUNCH/PRODUCT DEVELOPMENT/APPROVAL
      120. | | 7.31.1
      121. | 7.32 ACQUISITION/PARTNERSHIP
      122. | | 7.32.1

    Plant-Based Beverages Market Segmentation

    Market Segmentation Overview

    • Detailed segmentation data will be available in the full report
    • Comprehensive analysis by multiple parameters
    • Regional and country-level breakdowns
    • Market size forecasts by segment
    Infographic

    Free Sample Request

    Kindly complete the form below to receive a free sample of this Report

    Get Free Sample

    Customer Strories

    “I am very pleased with how market segments have been defined in a relevant way for my purposes (such as "Portable Freezers & refrigerators" and "last-mile"). In general the report is well structured. Thanks very much for your efforts.”

    Victoria Milne

    Founder
    Case Study
    Chemicals and Materials

    Compare Licence

    ×
    Features License Type
    Single User Multiuser License Enterprise User
    Price $4,950 $5,950 $7,250
    Maximum User Access Limit 1 User Upto 10 Users Unrestricted Access Throughout the Organization
    Free Customization
    Direct Access to Analyst
    Deliverable Format
    Platform Access
    Discount on Next Purchase 10% 15% 15%
    Printable Versions