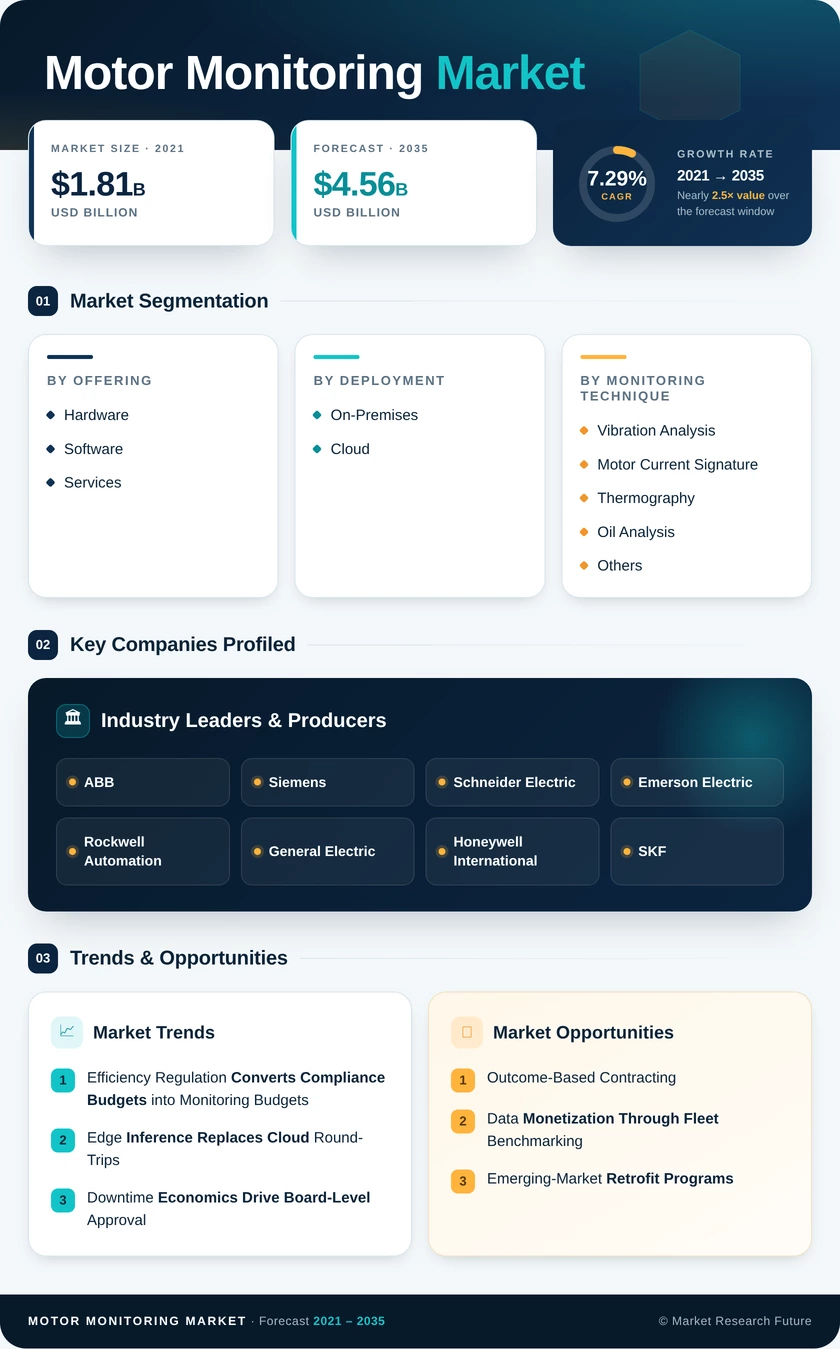
Motor Monitoring Market (2026 - 2035)

ID: MRFR/EnP/27024-HCR 111 Pages Priya Nagrale Last Updated: October 17, 2026
Motor Monitoring Market Research Report By Offering (Hardware, Software, Services), By Deployment (On-Premises, Cloud), By Monitoring Technique (Vibration Analysis, Motor Current Signature, Thermography, Oil Analysis, Others), By End-User Industry (Oil and Gas, Energy and Power, Metals and Mining, Chemicals, Automotive, Water and Wastewater, Renewable Energy, Others), By Motor Type (AC Motors, DC Motors, Servo and Stepper Motors) - Forecast to 2035
Motor Monitoring Market
Market Size
Forecast Period2026-2035
CAGR (2026-2035)7.29%
2025 Market SizeUSD 2.26 Billion
2035 Market SizeUSD 4.56 Billion
Key Players
ABB
Siemens
Schneider Electric
Emerson Electric
Rockwell Automation
General Electric
Opportunities
  • Outcome-Based Contracting
  • Data Monetization Through Fleet Benchmarking
  • Emerging-Market Retrofit Programs
  1. 1 Market Summary | |
    1. 1.1 Study Assumptions & Market Definition | |
    2. 1.2 Scope of the Study | |
    3. 1.3 Research Methodology | |
  2. 2 Key Report Takeaways | |
    1. 2.1 By Technology | |
    2. 2.2 By Sector | |
    3. 2.3 By Region | |
  3. 3 Market Size & Forecast (2021–2035) | |
    1. 3.1 Historical Market Size (2021–2024) | |
    2. 3.2 Base Year Assessment (2025) | |
    3. 3.3 Forecast Market Size (2026–2035) | |
    4. 3.4 Year-over-Year Growth Analysis | |
  4. 4 Driver Impact Analysis | |
    1. 4.1 Efficiency Regulation Converts Compliance Budgets into Monitoring Budgets | |
    2. 4.2 Edge Inference Replaces Cloud Round-Trips | |
    3. 4.3 Downtime Economics Drive Board-Level Approval | |
    4. 4.4 Thin Reliability Teams Force Automation | |
  5. 5 Restraints Impact Analysis | |
    1. 5.1 Brownfield Wiring Is the Real Cost | |
    2. 5.2 Security Review Slows Procurement | |
    3. 5.3 The Long Tail of Small Motors Stays Dark | |
  6. 6 Opportunities | |
    1. 6.1 Outcome-Based Contracting | |
    2. 6.2 Data Monetization Through Fleet Benchmarking | |
    3. 6.3 Emerging-Market Retrofit Programs | |
    4. 6.4 Renewable Drivetrain Coverage | |
    5. 6.5 Integration with Energy Management Reporting | |
  7. 7 Regional Market Share & Country-Level Analysis | |
    1. 7.1 North America | | |
      1. 7.1.1 US | | |
      2. 7.1.2 Canada | | |
      3. 7.1.3 Mexico | |
    2. 7.2 Europe | | |
      1. 7.2.1 Germany | | |
      2. 7.2.2 UK | | |
      3. 7.2.3 France | | |
      4. 7.2.4 Italy | | |
      5. 7.2.5 Spain | | |
      6. 7.2.6 Nordic Countries | | |
      7. 7.2.7 Russia | | |
      8. 7.2.8 Rest of Europe | |
    3. 7.3 Asia-Pacific | | |
      1. 7.3.1 China | | |
      2. 7.3.2 India | | |
      3. 7.3.3 Japan | | |
      4. 7.3.4 South Korea | | |
      5. 7.3.5 ASEAN | | |
      6. 7.3.6 Rest of Asia-Pacific | |
    4. 7.4 South America | | |
      1. 7.4.1 Brazil | | |
      2. 7.4.2 Argentina | | |
      3. 7.4.3 Rest of South America | |
    5. 7.5 Middle East & Africa | | |
      1. 7.5.1 Saudi Arabia | | |
      2. 7.5.2 UAE | | |
      3. 7.5.3 South Africa | | |
      4. 7.5.4 Egypt | | |
      5. 7.5.5 Rest of Middle East & Africa | |
  8. 8 Future Outlook (2026–2035) | |
    1. 8.1 Autonomous Diagnostics Displace Analyst Review | |
    2. 8.2 Platform Economics Reshape Margins | |
    3. 8.3 Electrification Supercycle Expands the Asset Base | |
    4. 8.4 Sustainability Reporting Becomes a Second Buyer | |
  9. 9 Segmentation Analysis | |
    1. 9.1 By Offering | | |
      1. 9.1.1 Hardware | | |
      2. 9.1.2 Software | | |
      3. 9.1.3 Services | |
    2. 9.2 By Deployment | | |
      1. 9.2.1 On-Premises | | |
      2. 9.2.2 Cloud | |
    3. 9.3 By Monitoring Technique | | |
      1. 9.3.1 Vibration Analysis | | |
      2. 9.3.2 Motor Current Signature | | |
      3. 9.3.3 Thermography | | |
      4. 9.3.4 Oil Analysis | | |
      5. 9.3.5 Others | |
    4. 9.4 By End-User Industry | | |
      1. 9.4.1 Oil and Gas | | |
      2. 9.4.2 Energy and Power | | |
      3. 9.4.3 Metals and Mining | | |
      4. 9.4.4 Chemicals | | |
      5. 9.4.5 Automotive | | |
      6. 9.4.6 Water and Wastewater | | |
      7. 9.4.7 Renewable Energy | | |
      8. 9.4.8 Others | |
    5. 9.5 By Motor Type | | |
      1. 9.5.1 AC Motors | | |
      2. 9.5.2 DC Motors | | |
      3. 9.5.3 Servo and Stepper Motors | |
  10. 10 Competitive Landscape | |
    1. 10.1 Market Concentration Analysis (2026) | |
    2. 10.2 Competitive Benchmarking Matrix | |
    3. 10.3 Company Profiles | | |
      1. 10.3.1 ABB | | |
      2. 10.3.2 Siemens | | |
      3. 10.3.3 Schneider Electric | | |
      4. 10.3.4 Emerson Electric | | |
      5. 10.3.5 Rockwell Automation | | |
      6. 10.3.6 General Electric | | |
      7. 10.3.7 Honeywell International | | |
      8. 10.3.8 SKF | | |
      9. 10.3.9 Fluke Reliability | | |
      10. 10.3.10 National Instruments | |
  11. 11 Recent News & Developments | |
  12. 12 Report Scope & Methodology | |
    1. 12.1 Study Period & Base Year | |
    2. 12.2 Data Sources & Citations | |
    3. 12.3 Abbreviations | |
  13. 13 Detailed Sources & Citations | |
  14. 14 Frequently Asked Questions | | LIST OF TABLES | |
  15. TABLE 1 Global Motor Monitoring Market Size & Forecast, by Revenue (USD Billion), 2021–2035 | |
  16. TABLE 2 Global Motor Monitoring Market – Year-over-Year Growth Analysis, 2021–2035 | |
  17. TABLE 3 Driver Impact Analysis Matrix, 2026–2035 | |
  18. TABLE 4 Restraint Impact Analysis Matrix, 2026–2035 | |
  19. TABLE 5 Global Motor Monitoring Market Size, by Region, 2021–2035 (USD Billion) | |
  20. TABLE 6 North America Motor Monitoring Market Size, by Country, 2021–2035 (USD Billion) | |
  21. TABLE 7 Europe Motor Monitoring Market Size, by Country, 2021–2035 (USD Billion) | |
  22. TABLE 8 Asia-Pacific Motor Monitoring Market Size, by Country, 2021–2035 (USD Billion) | |
  23. TABLE 9 South America Motor Monitoring Market Size, by Country, 2021–2035 (USD Billion) | |
  24. TABLE 10 Middle East & Africa Motor Monitoring Market Size, by Country, 2021–2035 (USD Billion) | |
  25. TABLE 11 Global Motor Monitoring Market Size, by Offering, 2021–2035 (USD Billion) | |
  26. TABLE 12 Global Motor Monitoring Market Size, by Deployment, 2021–2035 (USD Billion) | |
  27. TABLE 13 Global Motor Monitoring Market Size, by Monitoring Technique, 2021–2035 (USD Billion) | |
  28. TABLE 14 Global Motor Monitoring Market Size, by End-User Industry, 2021–2035 (USD Billion) | |
  29. TABLE 15 Global Motor Monitoring Market Size, by Motor Type, 2021–2035 (USD Billion) | |
  30. TABLE 16 North America Motor Monitoring Market Size, by Offering and Monitoring Technique, 2021–2035 (USD Billion) | |
  31. TABLE 17 Europe Motor Monitoring Market Size, by End-User Industry, 2021–2035 (USD Billion) | |
  32. TABLE 18 Asia-Pacific Motor Monitoring Market Size, by Motor Type, 2021–2035 (USD Billion) | |
  33. TABLE 19 Competitive Benchmarking Matrix – Global Motor Monitoring Market, 2026 | |
  34. TABLE 20 Company Profiles – Key Players, Global Motor Monitoring Market | |
  35. TABLE 21 Recent Developments & Strategic Announcements, 2023–2025 | |
  36. TABLE 22 Report Scope & Methodology Summary | |
  37. TABLE 23 Detailed Sources & Citations Index | | LIST OF FIGURES | |
  38. FIGURE 1 Global Motor Monitoring Market Dynamics – Drivers, Restraints & Opportunities | |
  39. FIGURE 2 Industry Value Chain Analysis – Sensors to Diagnostic Services | |
  40. FIGURE 3 Porter's Five Forces Analysis | |
  41. FIGURE 4 Global Market Size Trend & Forecast, 2021–2035 (USD Billion) | |
  42. FIGURE 5 Year-over-Year Growth Trajectory, 2022–2035 | |
  43. FIGURE 6 Market Share by Offering, 2025 vs 2035 | |
  44. FIGURE 7 Market Share by Deployment, 2025 vs 2035 | |
  45. FIGURE 8 Market Share by Monitoring Technique, 2025 | |
  46. FIGURE 9 Market Share by End-User Industry, 2025 | |
  47. FIGURE 10 Market Share by Motor Type, 2025 vs 2035 | |
  48. FIGURE 11 Regional Revenue Share, 2025 | |
  49. FIGURE 12 Regional CAGR Comparison, 2026–2035 | |
  50. FIGURE 13 North America Country-Level Share, 2025 | |
  51. FIGURE 14 Asia-Pacific Country-Level Growth Comparison, 2026–2035 | |
  52. FIGURE 15 Competitive Landscape – Revenue Share Positioning, 2026 | |
  53. FIGURE 16 Vendor Strategic Positioning Matrix

Segmentation Quick Reference

DimensionSub-SegmentsDominant SegmentFastest Growing Segment
By OfferingHardware, Software, ServicesHardwareServices
By DeploymentOn-Premises, CloudOn-PremisesCloud
By Monitoring TechniqueVibration Analysis, Motor Current Signature, Thermography, Oil Analysis, OthersVibration AnalysisOil Analysis
By End-User IndustryOil and Gas, Energy and Power, Metals and Mining, Chemicals, Automotive, Water and Wastewater, Renewable Energy, OthersOil and GasRenewable Energy
By Motor TypeAC Motors, DC Motors, Servo and Stepper MotorsAC MotorsServo and Stepper Motors
By RegionNorth America, Europe, Asia-Pacific, South America, Middle East & AfricaNorth AmericaAsia-Pacific


Market Segmentation Overview

By Offering

Sub-SegmentKey Trend
HardwareSensor bill-of-materials cost falling while installed points per plant rise
SoftwareConsolidation from point dashboards toward fleet-wide asset performance suites
ServicesShift from project engineering to recurring managed diagnostics contracts


Offering mix is migrating from a hardware-led purchase toward a hardware-plus-subscription structure. Buyers increasingly evaluate total three-year cost rather than device price, which favours vendors able to bundle instrumentation, analytics, and expert interpretation under one commercial agreement.

By Deployment

Sub-SegmentKey Trend
On-PremisesPreferred where OT security policy or data residency rules restrict external transfer
CloudAdopted for multi-site benchmarking, remote expert access, and lower IT overhead


Deployment choice is becoming less binary. Hybrid designs run inference at the edge while syncing metadata centrally, satisfying security teams without sacrificing the cross-plant comparison that makes fleet analytics valuable.

By Monitoring Technique

Sub-SegmentKey Trend
Vibration AnalysisPermanent wireless nodes replacing route-based handheld collection
Motor Current SignatureRetrofit-friendly sensing at the motor control centre without machine access
ThermographyFixed-point cameras supplementing periodic walkdown inspections
Oil AnalysisInline sensors trending contamination continuously instead of lab sampling
OthersAcoustic emission, flux, and partial discharge broadening fault coverage


Multi-technique fusion is the defining trend. Combining vibration with current and thermal inputs sharply reduces false positives, and vendors now market fused diagnostics as their principal accuracy differentiator.

By End-User Industry

Sub-SegmentKey Trend
Oil and GasStandards written into EPC specifications for new downstream capacity
Energy and PowerAuxiliary system coverage expanding alongside grid reliability mandates
Metals and MiningGrinding mill and conveyor drives prioritized on outage cost
ChemicalsContinuous-process plants extending coverage to secondary pump fleets
AutomotiveLine-side servo monitoring tied to takt-time protection
Water and WastewaterRegulated availability targets funding pump station instrumentation
Renewable EnergyRemote drivetrain access cost driving permanent instrumentation
OthersFood, pharmaceutical, and logistics automation adopting entry-tier packages


Vertical adoption tracks the cost of failure rather than motor population. Sectors where a single stoppage halts an entire production chain instrument first and most densely.

By Motor Type

Sub-SegmentKey Trend
AC MotorsLargest installed base; induction motor diagnostics remain the reference case
DC MotorsLegacy process and traction assets monitored to extend service life
Servo and Stepper MotorsPrecision automation growth driving demand for high-resolution diagnostics


AC induction machines anchor the installed base and the diagnostic knowledge library. Servo and stepper coverage grows fastest as robotics and precision assembly expand, though these assets require higher sampling rates and different fault signatures than conventional industrial motors.




Download PDF ×

We do not share your information with anyone. However, we may send you emails based on your report interest from time to time. You may contact us at any time to opt-out.