ID: MRFR/ICT/2998-HCR | February 2021 | Region: Global | 100 pages
Market Synopsis of Mobile Analytics Market:
Market Scenario:
IBM a prominent player in mobile analytics market. The company has designed a cloud platform as a service known as bluemix to get detail analysis of app performance, monitor application performance from tablet or any other mobile device without any queries or technical issues.
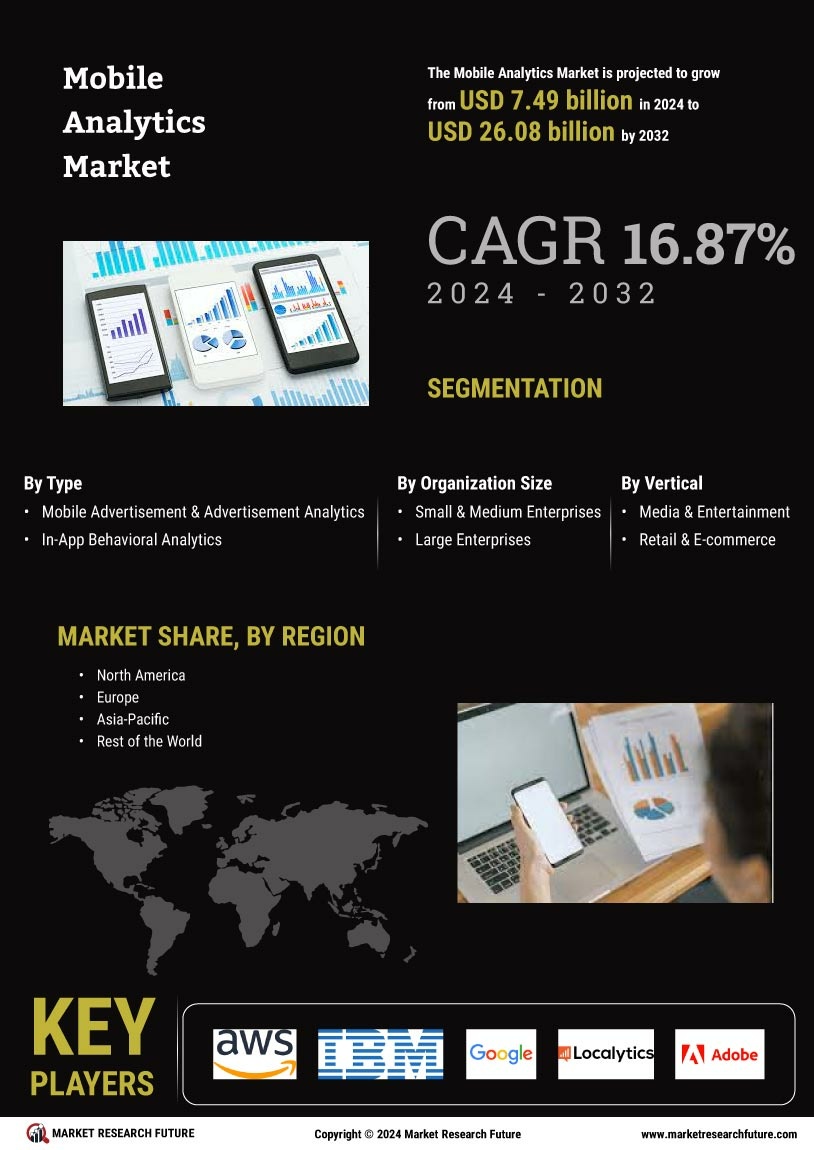
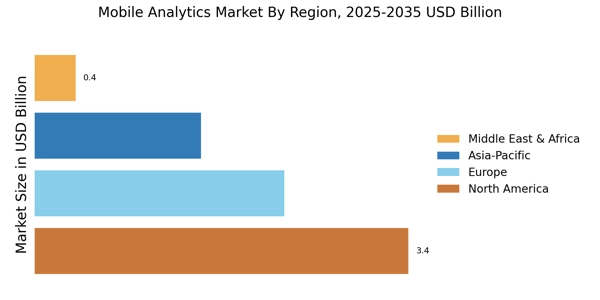
The regional analysis of mobile analytics market is being studied for region such as Asia Pacific, North America, Europe and Rest of the World. North America region is expected to be largest revenue generator in mobile analytics market. Asia-Pacific region is expected to be fastest growing region in mobile analytics market owing to huge investment in mobile advertising. The market growth in North America region is mainly due to contribution by develop countries in building network connectivity, growing number of mobile users, increasing usage of 3G and 4G network and increasing mobile analytics popularity among enterprises.
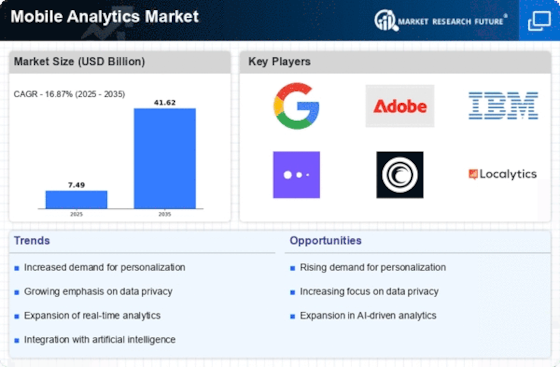
The key trends in mobile analytics market include location based analytics, invention of latest technology that are convenient for users, emergence of innovation ideas that are going to benefit users, proficient use of smartphone to generate money, mobile as a device helps in bridging the gap with real world, consumers are increasing by using multiple channels and devices and security and privacy policies. Location based analytics is a direct analytics technique opted by enterprises, by using location based application to make consumers alert about the offering by nearby business. Location based analytics is used to bridge the gap between online and physical customer acquaintance and benefit by promoting ample of purchase. Enterprises which are adopting LBM strategies should take care about security concerns of consumers through strong security measures and safeguard techniques. The technologies such as secured payment gateways, quick response codes and near field communication stickers have made money transferring deals easy for consumers and generated faith in them.
Mobile analytics market is segmented on the basis of type, organization size and vertical. Mobile analytics market consists of location based Analytics. In location based Analytics, location-enabled activities are often directly associated to consumer related behavior. If consumers are looking for a good place to have a drink or searching for a specific product in a retail store, customers rely on their mobile devices as prime sources of information on which they make an increasing number of decisions regarding spending their time and money.
The mobile analytics market is expected to grow at approximately USD 5 Billion by 2023, at 24% of CAGR between 2017 and 2023.
Mobile Analytics Market
Key Players:
The prominent players in the mobile analytics market are – Amazon Web Services (Aws) (U.S.), IBM (U.S.), Google Inc. (U.S.), Localytics (U.S.), Adobe Systems Incorporated (U.S.), Webtrends (U.S.), Comscore (U.S.), Flurry (U.S.), Microsoft Corporation (U.S.), Mixpanel (U.S.) among others.
Segments:
Mobile Analytics market for segment on the basis of User-type, Solution and Vertical
Mobile Analytics Market by Type:
In-App Behavioral Analytics
Application Performance Analytics
Mobile Analytics Market by Organization Size:
Mobile Analytics Market by Vertical:
Intended Audience
Frequently Asked Questions (FAQ) :
Asia Pacific, North America, Europe and the Rest of the World are the key regions included in the regional analysis of the market.
North America region is leading the market by contribution by developed countries in building network connectivity, rising number of mobile users and usage of 3G and 4G network as well as mounting mobile analytics popularity among enterprises.
The key trends in the mobile analytics market are location based analytics, the invention of the latest technology that is convenient for users, the advent of innovation ideas, proficient use of a smartphone to generate money, consumers are growing by using multiple channels and devices and security and privacy policies.
The market will be gaining a valuation of USD 5 Billion by 2023.
The market will be expanding during the years from 2017 to 2023.
TABLE OF CONTENTS
1 MARKET INTRODUCTION
1.1 INTRODUCTION
1.2 SCOPE OF STUDY
1.2.1 RESEARCH OBJECTIVE
1.2.2 ASSUMPTIONS
1.2.3 LIMITATIONS
1.3 MARKET STRUCTURE
2 RESEARCH METHODOLOGY
2.1 RESEARCH TYPE
2.2 PRIMARY RESEARCH
2.3 SECONDARY RESEARCH
2.4 FORECAST MODEL
2.4.1 MARKET DATA COLLECTION, ANALYSIS & FORECAST
2.4.2 MARKET SIZE ESTIMATION
3 MARKET DYNAMICS
3.1 INTRODUCTION
3.2 MARKET DRIVERS
3.3 MARKET CHALLENGES
3.4 MARKET OPPORTUNITIES
3.5 MARKET RESTRAINTS
4 EXECUTIVE SUMMARY
5. MARKET FACTOR ANALYSIS
5.1 PORTER’S FIVE FORCES ANALYSIS
5.2 SUPPLY CHAIN ANALYSIS
6 MOBILE ANALYTICS MARKET, BY SEGMENTS
6.1 INTRODUCTION
6.2 MARKET STATISTICS
6.2.1 BY TYPE
6.2.1.1 MOBILE ADVERTISEMENT & ADVERTISEMENT ANALYTICS
6.2.1.1.1 CAMPAIGN ANALYTICS
6.2.1.1.2 AD ATTRIBUTION ANALYSIS
6.2.1.1.3 CONVERSION FUNNEL ANALYSIS
6.2.1.2 IN-APP BEHAVIOURAL ANALYTICS
6.2.1.2.1 TOUCH HEATMAPS
6.2.1.2.2 EVENT TRACKING
6.2.1.2.3 USER PROFILING AND DEMOGRAPHICS
6.2.1.3 APPLICATION PERFORMANCE ANALYTICS
6.2.1.3.1 CROSS PLATFORM ANALYSIS
6.2.1.3.2 MOBILE A/B TESTING
6.2.1.4 OTHERS
6.2.2 BY ORGANIZATION SIZE
6.2.2.1 SMALL & MEDIUM ENTERPRISET
6.2.2.2 LARGE ENTERPRISE
6.2.3 BY VERTICAL
6.2.3.1 RETAIL AND E-COMMERCE
6.2.3.2 MEDIA & ENTERTAINMENT
6.2.3.3 TRAVEL & LOGISTICS
6.2.3.4 HEALTHCARE
6.2.3.5 GOVERNMENT
6.2.3.6 BFSI
6.2.3.7 AUTOMOTIVE
6.2.3.8 IT & TELECOMMUNICATION
6.2.3.9 OTHERS
6.2.4 BY GEOGRAPHY
6.2.4.1 NORTH AMERICA
6.2.4.1.1 U.S.
6.2.4.1.2 CANADA
6.2.4.1.3 MEXICO
6.2.4.2 EUROPE
6.2.4.2.1 GERMANY
6.2.4.2.2 U.K.
6.2.4.2.3 FRANCE
6.2.4.2.4 ITALY
6.2.4.2.5 REST OF EUROPE
6.2.4.3 ASIA-PACIFIC
6.2.4.3.1 CHINA
6.2.4.3.2 JAPAN
6.2.4.3.3 INDIA
6.2.4.3.5 SOUTH KOREA
6.2.4.3.6 REST OF ASIA-PACIFIC
6.2.4.4 REST OF THE WORLD
7 COMPETITIVE ANALYSIS
7.1 MARKET SHARE ANALYSIS
7.2 COMPANY PROFILES
7.2.1 AMAZON WEB SERVICES (AWS) (U.S.)
7.2.2 IBM (U.S.)
7.2.3 GOOGLE INC. (U.S.)
7.2.4 LOCALYTICS (U.S.)
7.2.5 ADOBE SYSTEMS INCORPORATED (U.S.)
7.2.6 WEBTRENDS (U.S.)
7.2.7 COMSCORE (U.S.)
7.2.8 FLURRY (U.S.)
7.2.9 MICROSOFT CORPORATION (U.S.)
7.2.10 MIXPANEL (U.S.)
7.2.11 OTHERS
LIST OF TABLES
TABLE 1 MOBILE ANALYTICS MARKET, BY TYPE
TABLE 2 MOBILE ANALYTICS MARKET, BY ORGANIZATION SIZE
TABLE 3 MOBILE ANALYTICS MARKET, BY VERTICAL
TABLE 4 MOBILE ANALYTICS MARKET, BY REGION
TABLE 5 NORTH AMERICA MOBILE ANALYTICS MARKET, BY TYPE
TABLE 6 NORTH AMERICA MOBILE ANALYTICS MARKET, BY ORGANIZATION SIZE
TABLE 7 NORTH AMERICA MOBILE ANALYTICS MARKET, BY VERTICAL
TABLE 8 U.S. MOBILE ANALYTICS MARKET, BY TYPE
TABLE 9 U.S. MOBILE ANALYTICS MARKET, BY ORGANIZATION SIZE
TABLE 10 U.S. MOBILE ANALYTICS MARKET, BY VERTICAL
TABLE 11 CANADA MOBILE ANALYTICS MARKET, BY TYPE
TABLE 12 CANADA MOBILE ANALYTICS MARKET, BY ORGANIZATION SIZE
TABLE 13 CANADA MOBILE ANALYTICS MARKET, BY VERTICAL
TABLE 14 MEXICO MOBILE ANALYTICS MARKET, BY TYPE
TABLE 15 MEXICO MOBILE ANALYTICS MARKET, BY ORGANIZATION SIZE
TABLE 16 MEXICO MOBILE ANALYTICS MARKET, BY VERTICAL
TABLE 17 EUROPE MOBILE ANALYTICS MARKET, BY TYPE
TABLE 18 EUROPE MOBILE ANALYTICS MARKET, BY ORGANIZATION SIZE
TABLE 19 EUROPE MOBILE ANALYTICS MARKET, BY VERTICAL
TABLE 20 GERMANY MOBILE ANALYTICS MARKET, BY TYPE
TABLE 21 GERMANY MOBILE ANALYTICS MARKET, BY ORGANIZATION SIZE
TABLE 22 GERMANY MOBILE ANALYTICS MARKET, BY VERTICAL
TABLE 24 FRANCE MOBILE ANALYTICS MARKET, BY TYPE
TABLE 25 FRANCE MOBILE ANALYTICS MARKET, BY ORGANIZATION SIZE
TABLE 26 FRANCE MOBILE ANALYTICS MARKET, BY VERTICAL
TABLE 27 U.K. MOBILE ANALYTICS MARKET, BY TYPE
TABLE 28 U.K. MOBILE ANALYTICS MARKET, BY ORGANIZATION SIZE
TABLE 29 U.K. MOBILE ANALYTICS MARKET, BY VERTICAL
TABLE 30 ITALY MOBILE ANALYTICS MARKET, BY TYPE
TABLE 31 ITALY MOBILE ANALYTICS MARKET, BY ORGANIZATION SIZE
TABLE 32 ITALY MOBILE ANALYTICS MARKET, BY VERTICAL
TABLE 33 REST OF EUROPE MOBILE ANALYTICS MARKET, BY TYPE
TABLE 34 REST OF EUROPE MOBILE ANALYTICS MARKET, BY ORGANIZATION SIZE
TABLE 35 REST OF EUROPE MOBILE ANALYTICS MARKET, BY VERTICAL
TABLE 36 ASIA-PACIFIC MOBILE ANALYTICS MARKET, BY TYPE
TABLE 37 ASIA-PACIFIC MOBILE ANALYTICS MARKET, BY ORGANIZATION SIZE
TABLE 38 ASIA-PACIFIC MOBILE ANALYTICS MARKET, BY VERTICAL
TABLE 39 CHINA MOBILE ANALYTICS MARKET, BY TYPE
TABLE 40 CHINA MOBILE ANALYTICS MARKET, BY ORGANIZATION SIZE
TABLE 41 CHINA MOBILE ANALYTICS MARKET, BY VERTICAL
TABLE 42 JAPAN MOBILE ANALYTICS MARKET, BY TYPE
TABLE 43 JAPAN MOBILE ANALYTICS MARKET, BY ORGANIZATION SIZE
TABLE 44 JAPAN MOBILE ANALYTICS MARKET, BY VERTICAL
TABLE 45 INDIA MOBILE ANALYTICS MARKET, BY TYPE
TABLE 46 INDIA MOBILE ANALYTICS MARKET, BY ORGANIZATION SIZE
TABLE 47 INDIA MOBILE ANALYTICS MARKET, BY VERTICAL
TABLE 48 SOUTH KOREA MOBILE ANALYTICS MARKET, BY TYPE
TABLE 49 SOUTH KOREA MOBILE ANALYTICS MARKET, BY ORGANIZATION SIZE
TABLE 50 SOUTH KOREA MOBILE ANALYTICS MARKET, BY VERTICAL
TABLE 51 REST OF ASIA-PACIFIC MOBILE ANALYTICS MARKET, BY TYPE
TABLE 52 REST OF ASIA-PACIFIC MOBILE ANALYTICS MARKET, BY ORGANIZATION SIZE
TABLE 53 REST OF ASIA-PACIFIC MOBILE ANALYTICS MARKET, BY VERTICAL
TABLE 54 REST OF THE WORLD MOBILE ANALYTICS MARKET, BY TYPE
TABLE 55 REST OF THE WORLD MOBILE ANALYTICS MARKET, BY ORGANIZATION SIZE
TABLE 56 REST OF THE WORLD MOBILE ANALYTICS MARKET, BY VERTICAL
LIST OF FIGURES
FIGURE 1 RESEARCH TYPE
FIGURE 2 MOBILE ANALYTICS MARKET: BY TYPE (%)
FIGURE 3 MOBILE ANALYTICS MARKET: BY ORGANIZATION SIZE (%)
FIGURE 4 MOBILE ANALYTICS MARKET: BY VERTICAL (%)
FIGURE 5 NORTH AMERICA MOBILE ANALYTICS MARKET, BY TYPE (%)
FIGURE 6 NORTH AMERICA MOBILE ANALYTICS MARKET, BY ORGANIZATION SIZE (%)
FIGURE 7 NORTH AMERICA MOBILE ANALYTICS MARKET, BY VERTICAL (%)
FIGURE 8 U.S. MOBILE ANALYTICS MARKET, BY TYPE (%)
FIGURE 9 U.S. MOBILE ANALYTICS MARKET, BY ORGANIZATION SIZE (%)
FIGURE 10 U.S. MOBILE ANALYTICS MARKET, BY VERTICAL (%)
FIGURE 11 CANADA MOBILE ANALYTICS MARKET, BY TYPE (%)
FIGURE 12 CANADA MOBILE ANALYTICS MARKET, BY ORGANIZATION SIZE (%)
FIGURE 13 CANADA MOBILE ANALYTICS MARKET, BY VERTICAL (%)
FIGURE 14 MEXICO MOBILE ANALYTICS MARKET, BY TYPE (%)
FIGURE 15 MEXICO MOBILE ANALYTICS MARKET, BY ORGANIZATION SIZE (%)
FIGURE 16 MEXICO MOBILE ANALYTICS MARKET, BY VERTICAL (%)
FIGURE 17 EUROPE MOBILE ANALYTICS MARKET, BY TYPE (%)
FIGURE 18 EUROPE MOBILE ANALYTICS MARKET, BY ORGANIZATION SIZE (%)
FIGURE 19 EUROPE MOBILE ANALYTICS MARKET, BY VERTICAL (%)
FIGURE 20 GERMANY MOBILE ANALYTICS MARKET, BY ORGANIZATION SIZE (%)
FIGURE 21 GERMANY MOBILE ANALYTICS MARKET, BY VERTICAL (%)
FIGURE 22 FRANCE MOBILE ANALYTICS MARKET, BY TYPE (%)
FIGURE 23 FRANCE MOBILE ANALYTICS MARKET, BY ORGANIZATION SIZE (%)
FIGURE 24 FRANCE MOBILE ANALYTICS MARKET, BY VERTICAL (%)
FIGURE 25 U.K. MOBILE ANALYTICS MARKET, BY TYPE (%)
FIGURE 26 U.K. MOBILE ANALYTICS MARKET, BY ORGANIZATION SIZE (%)
FIGURE 27 U.K. MOBILE ANALYTICS MARKET, BY VERTICAL (%)
FIGURE 28 ITALY MOBILE ANALYTICS MARKET, BY TYPE (%)
FIGURE 29 ITALY MOBILE ANALYTICS MARKET, BY ORGANIZATION SIZE (%)
FIGURE 30 ITALY MOBILE ANALYTICS MARKET, BY VERTICAL (%)
FIGURE 31 REST OF EUROPE MOBILE ANALYTICS MARKET, BY TYPE (%)
FIGURE 32 REST OF EUROPE MOBILE ANALYTICS MARKET, BY ORGANIZATION SIZE (%)
FIGURE 33 REST OF EUROPE MOBILE ANALYTICS MARKET, BY VERTICAL (%)
FIGURE 34 ASIA-PACIFIC MOBILE ANALYTICS MARKET BY TYPE (%)
FIGURE 35 ASIA-PACIFIC MOBILE ANALYTICS MARKET, BY ORGANIZATION SIZE (%)
FIGURE 36 ASIA-PACIFIC MOBILE ANALYTICS MARKET, BY VERTICAL (%)
FIGURE 37 CHINA MOBILE ANALYTICS MARKET, BY TYPE (%)
FIGURE 38 CHINA MOBILE ANALYTICS MARKET, BY ORGANIZATION SIZE (%)
FIGURE 39 CHINA MOBILE ANALYTICS MARKET, BY VERTICAL (%)
FIGURE 40 JAPAN MOBILE ANALYTICS MARKET, BY TYPE (%)
FIGURE 41 JAPAN MOBILE ANALYTICS MARKET, BY ORGANIZATION SIZE (%)
FIGURE 42 JAPAN MOBILE ANALYTICS MARKET, BY VERTICAL (%)
FIGURE 42 INDIA MOBILE ANALYTICS MARKET, BY TYPE (%)
FIGURE 43 INDIA MOBILE ANALYTICS MARKET, BY ORGANIZATION SIZE (%)
FIGURE 44 INDIA MOBILE ANALYTICS MARKET, BY VERTICAL (%)
FIGURE 45 SOUTH KOREA MOBILE ANALYTICS MARKET, BY TYPE (%)
FIGURE 46 SOUTH KOREA MOBILE ANALYTICS MARKET, BY ORGANIZATION SIZE (%)
FIGURE 47 SOUTH KOREA MOBILE ANALYTICS MARKET, BY VERTICAL (%)
FIGURE 48 REST OF ASIA-PACIFIC MOBILE ANALYTICS MARKET, BY TYPE (%)
FIGURE 49 REST OF ASIA-PACIFIC MOBILE ANALYTICS MARKET, BY ORGANIZATION SIZE (%)
FIGURE 50 REST OF ASIA-PACIFIC MOBILE ANALYTICS MARKET, BY VERTICAL (%)
FIGURE 51 ROW MOBILE ANALYTICS MARKET, BY TYPE (%)
FIGURE 52 ROW MOBILE ANALYTICS MARKET, BY ORGANIZATION SIZE (%)
FIGURE 53 ROW MOBILE ANALYTICS MARKET, BY VERTICAL (%)