Request Free Sample ×

Kindly complete the form below to receive a free sample of this Report

* Please use a valid business email

Leading companies partner with us for data-driven Insights

clients tt-cursor
Hero Background

India Dental Insurance Market

ID: MRFR/MED/50566-HCR
200 Pages
Vikita Thakur
Last Updated: February 06, 2026

India Dental Insurance Market Research Report: Size, Share, Trend Analysis By Plan Type (Indemnity Plans, Preferred Provider Organizations, Health Maintenance Organizations, Discount Plans), By Coverage Type (Preventive, Restorative, Orthodontic, Basic), By Target Audience (Individuals, Families, Employers, Seniors) and By Distribution Channel (Direct Sales, Brokers, Agents, Online Platforms) - Growth Outlook & Industry Forecast 2025 To 2035

Share:
Download PDF ×

We do not share your information with anyone. However, we may send you emails based on your report interest from time to time. You may contact us at any time to opt-out.

India Dental Insurance Market Infographic
Purchase Options
  1. 1 SECTION I: EXECUTIVE SUMMARY AND KEY HIGHLIGHTS
    1. 1.1 EXECUTIVE SUMMARY
      1. 1.1.1 Market Overview
      2. 1.1.2 Key Findings
      3. 1.1.3 Market Segmentation
      4. 1.1.4 Competitive Landscape
      5. 1.1.5 Challenges and Opportunities
      6. 1.1.6 Future Outlook
  2. 2 SECTION II: SCOPING, METHODOLOGY AND MARKET STRUCTURE
    1. 2.1 MARKET INTRODUCTION
      1. 2.1.1 Definition
      2. 2.1.2 Scope of the study
        1. 2.1.2.1 Research Objective
        2. 2.1.2.2 Assumption
        3. 2.1.2.3 Limitations
    2. 2.2 RESEARCH METHODOLOGY
      1. 2.2.1 Overview
      2. 2.2.2 Data Mining
      3. 2.2.3 Secondary Research
      4. 2.2.4 Primary Research
        1. 2.2.4.1 Primary Interviews and Information Gathering Process
        2. 2.2.4.2 Breakdown of Primary Respondents
      5. 2.2.5 Forecasting Model
      6. 2.2.6 Market Size Estimation
        1. 2.2.6.1 Bottom-Up Approach
        2. 2.2.6.2 Top-Down Approach
      7. 2.2.7 Data Triangulation
      8. 2.2.8 Validation
  3. 3 SECTION III: QUALITATIVE ANALYSIS
    1. 3.1 MARKET DYNAMICS
      1. 3.1.1 Overview
      2. 3.1.2 Drivers
      3. 3.1.3 Restraints
      4. 3.1.4 Opportunities
    2. 3.2 MARKET FACTOR ANALYSIS
      1. 3.2.1 Value chain Analysis
      2. 3.2.2 Porter's Five Forces Analysis
        1. 3.2.2.1 Bargaining Power of Suppliers
        2. 3.2.2.2 Bargaining Power of Buyers
        3. 3.2.2.3 Threat of New Entrants
        4. 3.2.2.4 Threat of Substitutes
        5. 3.2.2.5 Intensity of Rivalry
      3. 3.2.3 COVID-19 Impact Analysis
        1. 3.2.3.1 Market Impact Analysis
        2. 3.2.3.2 Regional Impact
        3. 3.2.3.3 Opportunity and Threat Analysis
  4. 4 SECTION IV: QUANTITATIVE ANALYSIS
    1. 4.1 Chemicals and Materials, BY Plan Type (USD Billion)
      1. 4.1.1 Indemnity Plans
      2. 4.1.2 Preferred Provider Organizations
      3. 4.1.3 Health Maintenance Organizations
      4. 4.1.4 Discount Plans
    2. 4.2 Chemicals and Materials, BY Coverage Type (USD Billion)
      1. 4.2.1 Preventive
      2. 4.2.2 Restorative
      3. 4.2.3 Orthodontic
      4. 4.2.4 Basic
    3. 4.3 Chemicals and Materials, BY Target Audience (USD Billion)
      1. 4.3.1 Individuals
      2. 4.3.2 Families
      3. 4.3.3 Employers
      4. 4.3.4 Seniors
    4. 4.4 Chemicals and Materials, BY Distribution Channel (USD Billion)
      1. 4.4.1 Direct Sales
      2. 4.4.2 Brokers
      3. 4.4.3 Agents
      4. 4.4.4 Online Platforms
  5. 5 SECTION V: COMPETITIVE ANALYSIS
    1. 5.1 Competitive Landscape
      1. 5.1.1 Overview
      2. 5.1.2 Competitive Analysis
      3. 5.1.3 Market share Analysis
      4. 5.1.4 Major Growth Strategy in the Chemicals and Materials
      5. 5.1.5 Competitive Benchmarking
      6. 5.1.6 Leading Players in Terms of Number of Developments in the Chemicals and Materials
      7. 5.1.7 Key developments and growth strategies
        1. 5.1.7.1 New Product Launch/Service Deployment
        2. 5.1.7.2 Merger & Acquisitions
        3. 5.1.7.3 Joint Ventures
      8. 5.1.8 Major Players Financial Matrix
        1. 5.1.8.1 Sales and Operating Income
        2. 5.1.8.2 Major Players R&D Expenditure. 2023
    2. 5.2 Company Profiles
      1. 5.2.1 Delta Dental (US)
        1. 5.2.1.1 Financial Overview
        2. 5.2.1.2 Products Offered
        3. 5.2.1.3 Key Developments
        4. 5.2.1.4 SWOT Analysis
        5. 5.2.1.5 Key Strategies
      2. 5.2.2 Aetna (US)
        1. 5.2.2.1 Financial Overview
        2. 5.2.2.2 Products Offered
        3. 5.2.2.3 Key Developments
        4. 5.2.2.4 SWOT Analysis
        5. 5.2.2.5 Key Strategies
      3. 5.2.3 Cigna (US)
        1. 5.2.3.1 Financial Overview
        2. 5.2.3.2 Products Offered
        3. 5.2.3.3 Key Developments
        4. 5.2.3.4 SWOT Analysis
        5. 5.2.3.5 Key Strategies
      4. 5.2.4 MetLife (US)
        1. 5.2.4.1 Financial Overview
        2. 5.2.4.2 Products Offered
        3. 5.2.4.3 Key Developments
        4. 5.2.4.4 SWOT Analysis
        5. 5.2.4.5 Key Strategies
      5. 5.2.5 UnitedHealthcare (US)
        1. 5.2.5.1 Financial Overview
        2. 5.2.5.2 Products Offered
        3. 5.2.5.3 Key Developments
        4. 5.2.5.4 SWOT Analysis
        5. 5.2.5.5 Key Strategies
      6. 5.2.6 Guardian Life (US)
        1. 5.2.6.1 Financial Overview
        2. 5.2.6.2 Products Offered
        3. 5.2.6.3 Key Developments
        4. 5.2.6.4 SWOT Analysis
        5. 5.2.6.5 Key Strategies
      7. 5.2.7 Humana (US)
        1. 5.2.7.1 Financial Overview
        2. 5.2.7.2 Products Offered
        3. 5.2.7.3 Key Developments
        4. 5.2.7.4 SWOT Analysis
        5. 5.2.7.5 Key Strategies
      8. 5.2.8 Blue Cross Blue Shield (US)
        1. 5.2.8.1 Financial Overview
        2. 5.2.8.2 Products Offered
        3. 5.2.8.3 Key Developments
        4. 5.2.8.4 SWOT Analysis
        5. 5.2.8.5 Key Strategies
    3. 5.3 Appendix
      1. 5.3.1 References
      2. 5.3.2 Related Reports
  6. 6 LIST OF FIGURES
    1. 6.1 MARKET SYNOPSIS
    2. 6.2 INDIA MARKET ANALYSIS BY PLAN TYPE
    3. 6.3 INDIA MARKET ANALYSIS BY COVERAGE TYPE
    4. 6.4 INDIA MARKET ANALYSIS BY TARGET AUDIENCE
    5. 6.5 INDIA MARKET ANALYSIS BY DISTRIBUTION CHANNEL
    6. 6.6 KEY BUYING CRITERIA OF CHEMICALS AND MATERIALS
    7. 6.7 RESEARCH PROCESS OF MRFR
    8. 6.8 DRO ANALYSIS OF CHEMICALS AND MATERIALS
    9. 6.9 DRIVERS IMPACT ANALYSIS: CHEMICALS AND MATERIALS
    10. 6.10 RESTRAINTS IMPACT ANALYSIS: CHEMICALS AND MATERIALS
    11. 6.11 SUPPLY / VALUE CHAIN: CHEMICALS AND MATERIALS
    12. 6.12 CHEMICALS AND MATERIALS, BY PLAN TYPE, 2024 (% SHARE)
    13. 6.13 CHEMICALS AND MATERIALS, BY PLAN TYPE, 2024 TO 2035 (USD Billion)
    14. 6.14 CHEMICALS AND MATERIALS, BY COVERAGE TYPE, 2024 (% SHARE)
    15. 6.15 CHEMICALS AND MATERIALS, BY COVERAGE TYPE, 2024 TO 2035 (USD Billion)
    16. 6.16 CHEMICALS AND MATERIALS, BY TARGET AUDIENCE, 2024 (% SHARE)
    17. 6.17 CHEMICALS AND MATERIALS, BY TARGET AUDIENCE, 2024 TO 2035 (USD Billion)
    18. 6.18 CHEMICALS AND MATERIALS, BY DISTRIBUTION CHANNEL, 2024 (% SHARE)
    19. 6.19 CHEMICALS AND MATERIALS, BY DISTRIBUTION CHANNEL, 2024 TO 2035 (USD Billion)
    20. 6.20 BENCHMARKING OF MAJOR COMPETITORS
  7. 7 LIST OF TABLES
    1. 7.1 LIST OF ASSUMPTIONS
  8. 7.1.1
    1. 7.2 India MARKET SIZE ESTIMATES; FORECAST
      1. 7.2.1 BY PLAN TYPE, 2025-2035 (USD Billion)
      2. 7.2.2 BY COVERAGE TYPE, 2025-2035 (USD Billion)
      3. 7.2.3 BY TARGET AUDIENCE, 2025-2035 (USD Billion)
      4. 7.2.4 BY DISTRIBUTION CHANNEL, 2025-2035 (USD Billion)
    2. 7.3 PRODUCT LAUNCH/PRODUCT DEVELOPMENT/APPROVAL
  9. 7.3.1
    1. 7.4 ACQUISITION/PARTNERSHIP
  10. 7.4.1

India Chemicals and Materials Market Segmentation

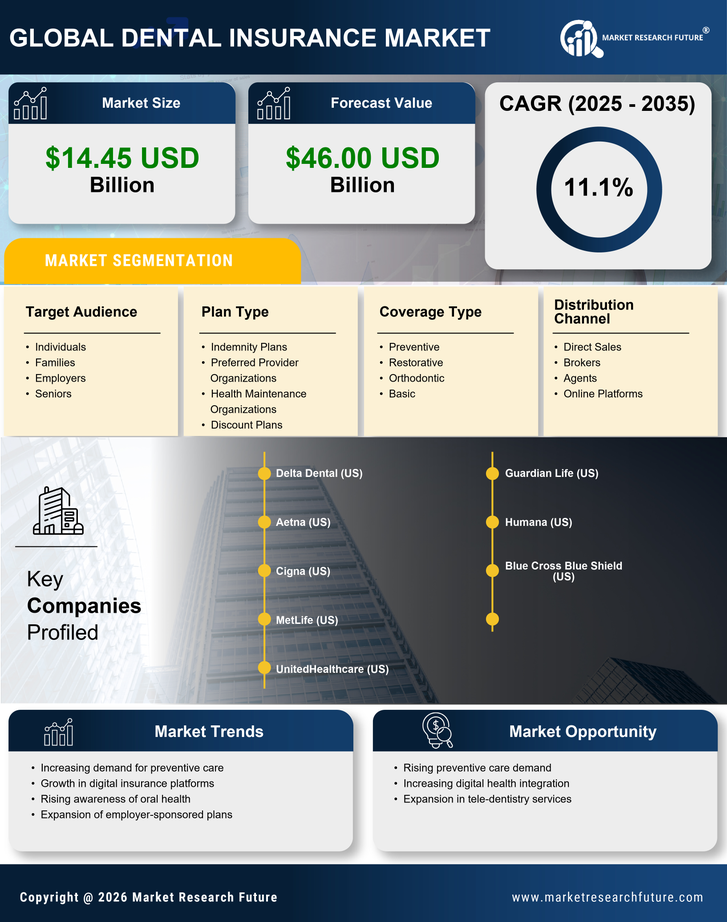
Chemicals and Materials By Plan Type (USD Billion, 2025-2035)

  • Indemnity Plans
  • Preferred Provider Organizations
  • Health Maintenance Organizations
  • Discount Plans

Chemicals and Materials By Coverage Type (USD Billion, 2025-2035)

  • Preventive
  • Restorative
  • Orthodontic
  • Basic

Chemicals and Materials By Target Audience (USD Billion, 2025-2035)

  • Individuals
  • Families
  • Employers
  • Seniors

Chemicals and Materials By Distribution Channel (USD Billion, 2025-2035)

  • Direct Sales
  • Brokers
  • Agents
  • Online Platforms

Compare Licence

×
Features License Type
Single User Multiuser License Enterprise User
Price $4,950 $5,950 $7,250
Maximum User Access Limit 1 User Upto 10 Users Unrestricted Access Throughout the Organization
Free Customization
Direct Access to Analyst
Deliverable Format
Platform Access
Discount on Next Purchase 10% 15% 15%
Printable Versions