High Pressure Pumps Market (2026 - 2035)

ID: MRFR/Equip/1348-HCR 111 Pages Priya Nagrale Last Updated: October 07, 2026
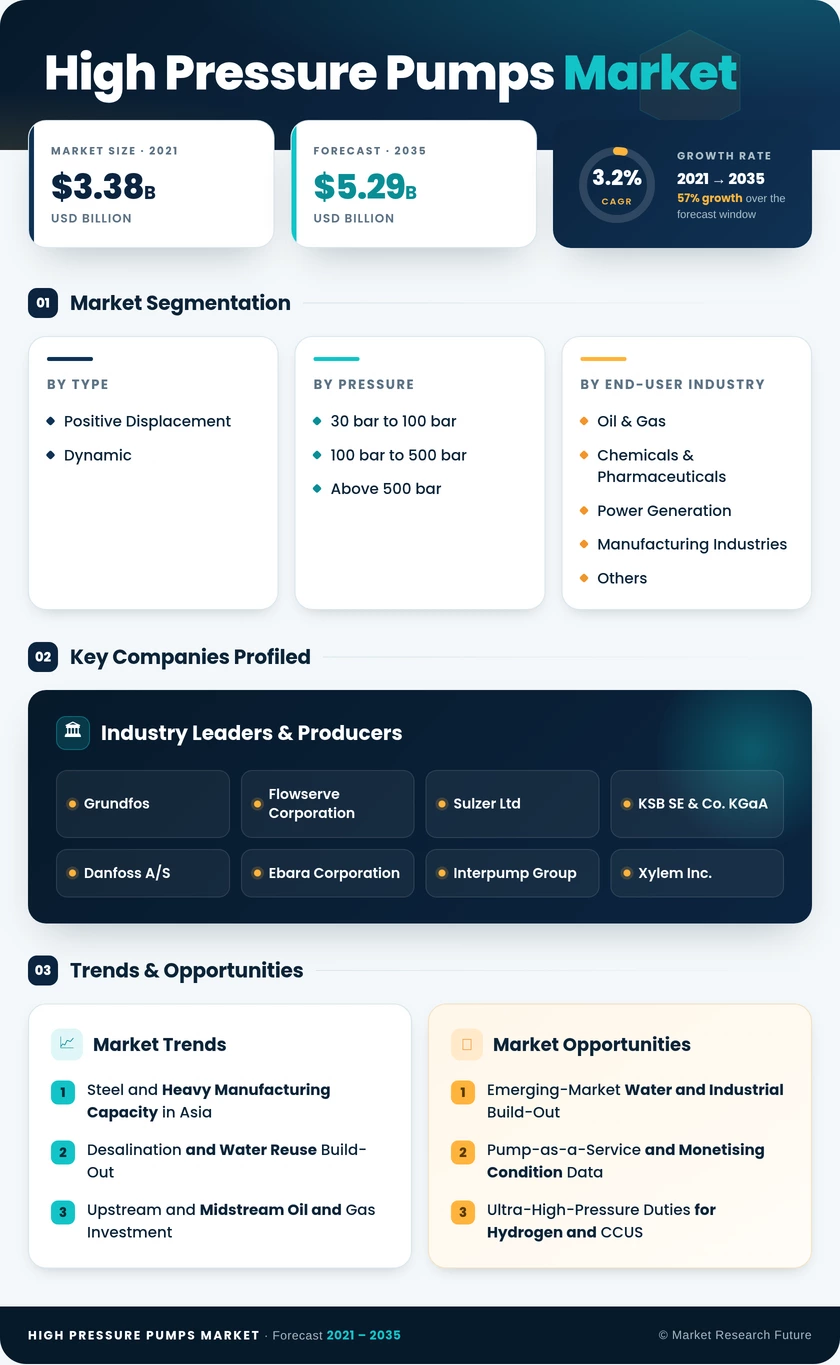
High Pressure Pumps Market Research Report By Type (Positive Displacement, Dynamic), By Pressure (30 bar to 100 bar, 100 bar to 500 bar, Above 500 bar), By End-User Industry (Oil & Gas, Chemicals & Pharmaceuticals, Power Generation, Manufacturing Industries, Others) - Forecast to 2035
High Pressure Pumps Market
Market Size
Forecast Period2026-2035
CAGR (2026-2035)3.2%
2025 Market SizeUSD 3.86 Billion
2035 Market SizeUSD 5.29 Billion
Key Players
Grundfos
Flowserve Corporation
Sulzer Ltd
KSB SE & Co. KGaA
Danfoss A/S
Ebara Corporation
Opportunities
  • Emerging-Market Water and Industrial Build-Out
  • Pump-as-a-Service and Monetising Condition Data
  • Ultra-High-Pressure Duties for Hydrogen and CCUS
  1. 1 Market Summary | |
  2. 2 Key Report Takeaways | |
    1. 2.1 By Type | |
    2. 2.2 By Pressure | |
    3. 2.3 By End-User Industry | |
    4. 2.4 By Region | |
  3. 3 Market Size and Forecast (2021–2035) | |
  4. 4 Driver Impact Analysis | |
    1. 4.1 Steel and Heavy Manufacturing Capacity in Asia | |
    2. 4.2 Desalination and Water Reuse Build-Out | |
    3. 4.3 Upstream and Midstream Oil and Gas Investment | |
    4. 4.4 Public Water Infrastructure Spending | |
    5. 4.5 Energy-Efficiency Regulation | |
    6. 4.6 Hydrogen, CCUS and Energy Transition Duties | |
    7. 4.7 Additive Manufacturing and Digital Design | |
  5. 5 Restraints Impact Analysis | |
    1. 5.1 High Capital and Lifecycle Costs | |
    2. 5.2 Oil Price Volatility and Capex Cycles | |
    3. 5.3 Raw Material Price Volatility | |
    4. 5.4 Wear-Part and Sealing Failures | |
    5. 5.5 Price Pressure from Low-Cost Manufacturers | |
  6. 6 Opportunities | |
    1. 6.1 Emerging-Market Water and Industrial Build-Out | |
    2. 6.2 Pump-as-a-Service and Monetising Condition Data | |
    3. 6.3 Ultra-High-Pressure Duties for Hydrogen and CCUS | |
    4. 6.4 Additive-Manufactured Aftermarket and Retrofit Kits | |
    5. 6.5 Waterjet Cutting and Industrial Cleaning | |
  7. 7 Regional Market Share and Country-Level Analysis | |
    1. 7.1 North America | | |
      1. 7.1.1 US | | |
      2. 7.1.2 Canada | | |
      3. 7.1.3 Mexico | |
    2. 7.2 Europe | | |
      1. 7.2.1 Germany | | |
      2. 7.2.2 UK | | |
      3. 7.2.3 France | | |
      4. 7.2.4 Italy | | |
      5. 7.2.5 Spain | | |
      6. 7.2.6 Nordic Countries | | |
      7. 7.2.7 Russia | | |
      8. 7.2.8 Rest of Europe | |
    3. 7.3 Asia-Pacific | | |
      1. 7.3.1 China | | |
      2. 7.3.2 India | | |
      3. 7.3.3 Japan | | |
      4. 7.3.4 South Korea | | |
      5. 7.3.5 ASEAN | | |
      6. 7.3.6 Rest of Asia-Pacific | |
    4. 7.4 South America | | |
      1. 7.4.1 Brazil | | |
      2. 7.4.2 Argentina | | |
      3. 7.4.3 Rest of South America | |
    5. 7.5 Middle-East and Africa | | |
      1. 7.5.1 Saudi Arabia | | |
      2. 7.5.2 UAE | | |
      3. 7.5.3 South Africa | | |
      4. 7.5.4 Egypt | | |
      5. 7.5.5 Rest of MEA | |
  8. 8 Future Outlook (2026–2035) | |
    1. 8.1 Predictive Maintenance and Autonomous Operation | |
    2. 8.2 Water Scarcity and the Desalination Supercycle | |
    3. 8.3 Energy Transition Duties | |
    4. 8.4 Efficiency, ESG Reporting and Drive Electrification | |
  9. 9 Segmentation Analysis | |
    1. 9.1 By Type | | |
      1. 9.1.1 Positive Displacement | | |
      2. 9.1.2 Dynamic | |
    2. 9.2 By Pressure | | |
      1. 9.2.1 30 bar to 100 bar | | |
      2. 9.2.2 100 bar to 500 bar | | |
      3. 9.2.3 Above 500 bar | |
    3. 9.3 By End-User Industry | | |
      1. 9.3.1 Oil & Gas | | |
      2. 9.3.2 Chemicals & Pharmaceuticals | | |
      3. 9.3.3 Power Generation | | |
      4. 9.3.4 Manufacturing Industries | | |
      5. 9.3.5 Others | |
  10. 10 Competitive Landscape | |
  11. 11 Recent News & Developments | |
  12. 12 Report Scope and Methodology | |
  13. 13 Detailed Sources and Citations | |
  14. 14 Frequently Asked Questions (FAQs) | | LIST OF TABLES | |
  15. TABLE 1 High Pressure Pumps Market Summary Snapshot, 2025–2035 | |
  16. TABLE 2 Global Market Size & Forecast, by Revenue (USD Billion), 2021–2035 | |
  17. TABLE 3 Driver Impact Analysis on CAGR, 2026–2035 | |
  18. TABLE 4 Restraints Impact Analysis on CAGR, 2026–2035 | |
  19. TABLE 5 Regional Summary, 2025 | |
  20. TABLE 6 North America Market, by Country, 2025 | |
  21. TABLE 7 Europe Market, by Country, 2025 | |
  22. TABLE 8 Asia-Pacific Market, by Country, 2025 | |
  23. TABLE 9 South America Market, by Country, 2025 | |
  24. TABLE 10 Middle-East and Africa Market, by Country, 2025 | |
  25. TABLE 11 Market Segmentation, by Type, 2025 | |
  26. TABLE 12 Market Segmentation, by Pressure, 2025 | |
  27. TABLE 13 Market Segmentation, by End-User Industry, 2025 | |
  28. TABLE 14 Competitive Benchmarking Matrix, 2025 | |
  29. TABLE 15 Report Scope and Methodology | |
  30. TABLE 16 Detailed Sources and Citations | |
  31. TABLE 17 Segmentation Quick Reference | | LIST OF FIGURES | |
  32. FIGURE 1 Market Dynamics Overview (Drivers, Restraints, Opportunities) | |
  33. FIGURE 2 Industry Value Chain Analysis | |
  34. FIGURE 3 Porter's Five Forces Analysis | |
  35. FIGURE 4 Global Market Size Trend, 2021–2035 (USD Billion) | |
  36. FIGURE 5 Market Share, by Type, 2025 | |
  37. FIGURE 6 Market Share, by Pressure, 2025 | |
  38. FIGURE 7 Market Share, by End-User Industry, 2025 | |
  39. FIGURE 8 Regional Market Share, 2025 | |
  40. FIGURE 9 Country-Level Market Share within Each Region, 2025 | |
  41. FIGURE 10 Competitive Landscape — Estimated Revenue Share Ranges, 2025

Segmentation Quick Reference

DimensionSub-SegmentsDominant SegmentFastest Growing Segment
By TypePositive Displacement, DynamicPositive Displacement (58.5% share)Dynamic (3.6% CAGR)
By Pressure30 bar to 100 bar, 100 bar to 500 bar, Above 500 bar100 bar to 500 bar (44.0% share)Above 500 bar (4.2% CAGR)
By End-User IndustryOil & Gas, Chemicals & Pharmaceuticals, Power Generation, Manufacturing Industries, OthersManufacturing Industries (31.0% share)Chemicals & Pharmaceuticals (3.9% CAGR)
By RegionNorth America, Europe, Asia-Pacific, South America, Middle-East and AfricaAsia-Pacific (41.5% share)Asia-Pacific (41.5% share)


Market Segmentation Overview

By Type

Sub-SegmentKey Trend
Positive DisplacementCeramic plungers, direct-drive and sensor-equipped valve blocks extend service intervals
DynamicMultistage designs with energy recovery win large SWRO and boiler-feed contracts


Positive Displacement leads because plunger, piston and diaphragm designs hold near-constant flow at discharge pressures above 100 bar, which descaling, injection and waterjet duties require. Dynamic grows faster as multistage designs take large desalination and boiler-feed orders, where high flow and fewer wear parts lower lifecycle cost. Variable-speed drives are narrowing the efficiency gap between the two.

By Pressure

Sub-SegmentKey Trend
30 bar to 100 barPrice competition from Asian OEMs in RO feed and boiler duties
100 bar to 500 barSteel descaling and oilfield injection anchor volumes
Above 500 barWaterjet machining and hydrostatic testing expand into new industries


The 100 bar to 500 bar band leads because it covers steel-mill descaling, oilfield water injection and most industrial cleaning. Above 500 bar grows fastest as waterjet cutting reaches composites and battery electrodes and as hydrogen-related duties emerge. The 30 bar to 100 bar class faces the sharpest pricing pressure from low-cost suppliers.

By End-User Industry

Sub-SegmentKey Trend
Oil & GasInjection and fracturing demand follows upstream budgets
Chemicals & PharmaceuticalsContinuous-flow reactors and homogenisers replace batch processes
Power GenerationSteady boiler-feed replacement and nuclear maintenance
Manufacturing IndustriesAsian steel, textile and food plants drive new installations
OthersWater utilities and mining provide booster and slurry duties


Manufacturing Industries lead on the strength of steel descaling in China and India, together with textile, food and automotive washing lines. Chemicals & Pharmaceuticals grows fastest as producers adopt high pressure homogenisation and continuous processing under stricter containment rules. Oil & Gas remains the second-largest buyer, but its orders swing with crude prices.




Download PDF ×

We do not share your information with anyone. However, we may send you emails based on your report interest from time to time. You may contact us at any time to opt-out.