Expense Management Software Market (2026 - 2035)

Expense Management Software Market Size, Share and Research Report By Solution Type (Cloud Expense-Management Platforms, Mobile-First Applications), By Enterprise Size (Large Enterprises, Small and Medium Enterprises), By Application (Travel and Entertainment Management, Employee Reimbursement, Telecom Expense Management, Others), By End-Use Industry (BFSI, IT and Telecom, Healthcare, Others) - Industry Forecast to 2035
ID: MRFR/ICT/5549-CR
147 Pages
Kiran Jinkalwad, Aarti Dhapte
Last Updated: June 25, 2026
Expense Management Software Market

Market Size

Forecast Period2026-2035
CAGR (2026-2035)10.90%
2020 Market Size8.18 USD Billion
2021 Market Size23.03 USD Billion

Key Players

SAP Concur
Coupa Software
Emburse
Brex
Navan
Ramp
Opportunities
  • AI-Driven Predictive Spend Analytics
  • Emerging-Market SMB Digitization
  • Embedded ESG and Carbon Reporting

Expense Management Software Market Summary

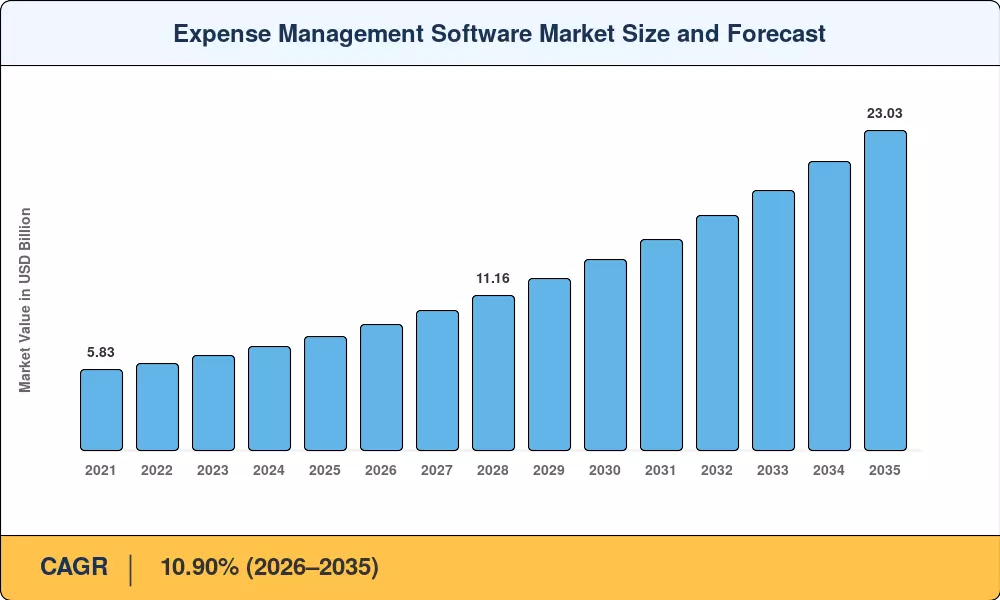
The Expense Management Software Market reached USD 8.18 billion in 2025 and is on course to hit USD 23.03 billion by 2035, registering a 10.90% CAGR across the 2026–2035 forecast window. Two catalysts are bending the growth curve upward: the European Union's mandatory e-invoicing directive—set to cover all B2B transactions by 2028—and a sustained push by CFOs to collapse multi-tool finance stacks into unified platforms [1]. Global corporate travel spending rebounded past USD 1.5 trillion in 2024, and every dollar of that spend now flows through approval workflows that enterprises expect to be instant, mobile, and policy-aware [2].

AI-driven auditing powered by cloud-native suites is replacing legacy spreadsheet-based processes and on-premises expenditure solutions. anticipates that less than 18% of midmarket enterprises still use manual expenditure reconciliation, down from 42% in 2020 [3]. Venture-backed companies like Ramp and Brex have raised more than USD 2 billion since 2022, further increasing card-linked data collecting and real-time policy enforcement that older systems cannot match [4].


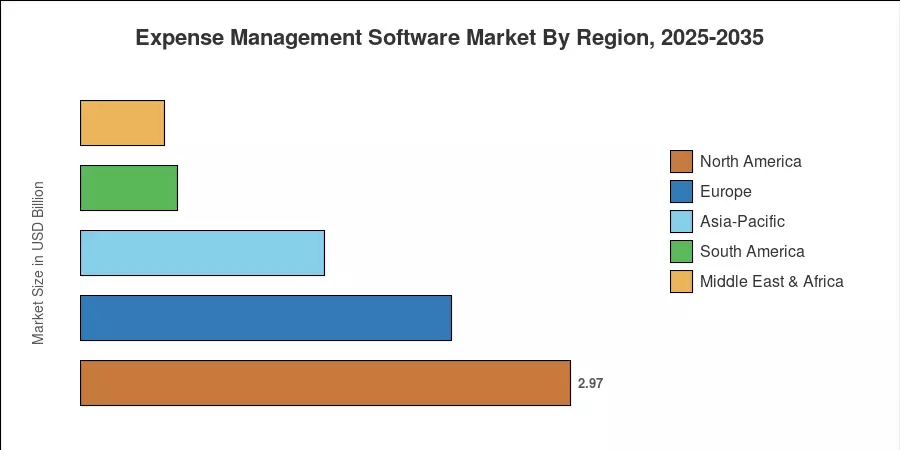
North America dominated the Expense Management Software Market with a share of 36.3% in 2025 due to high penetration among Fortune 500 companies. Asia-Pacific is the fastest-growing market with an 18.1% CAGR due to India’s GST e-invoicing deployment and China’s burgeoning SaaS ecosystem [5]. Europe is the second largest area, with $2.25 billion in revenues driven by corporate expenditure tracking mandates in the EU’s ViDA (VAT in the Digital Age) package. This market will evolve from cost-center tooling to a strategic finance-intelligence layer over the next decade.


Key Report Takeaways

• By Solution Type

  • Cloud expense-management platforms captured 69.0% of the Expense Management Software Market in 2025, driven by seamless ERP integrations and zero-infrastructure deployment.
  • Mobile-first applications are forecast to record the fastest CAGR of 15.8% through 2035 as field workers and gig-economy contractors demand on-device receipt capture.

• By End-Use Sector

  • Banking, financial services, and insurance (BFSI) organizations accounted for 27.2% of industry adoption in 2025, thanks to stringent audit-trail regulations.
  • The IT and telecom vertical is advancing at a 15.7% CAGR, reflecting rising telecom expense complexity across hybrid work environments.

• By Geography

  • North America retained the dominant share of the Expense Management Software Market at 36.3% in 2025.
  • Asia-Pacific is set to grow at 18.1% CAGR through 2035, with India and China as primary accelerators.


Market Size and Forecast (2021–2035)

Market Research Future (MRFR) has also used audited vendor revenues, spending trackers, and publicly filed financial statements for deriving the historical values. Forecast forecasts are based on a bottom-up methodology calibrated against macroeconomic data, regulatory timeframes and enterprise technology adoption curves.

Expense Management Software Market Size and Forecast
Our Impact
Enabled $4.3B Revenue Impact for Fortune 500 and Leading Multinationals
Partnering with 2000+ Global Organizations Each Year
30K+ Citations by Top-Tier Firms in the Industry

Driver Impact Analysis

Driver ~% Impact on CAGR Geographic Relevance Impact Timeline
Mandatory e-invoicing regulations +2.3% Europe, India, LATAM Short-term (≤2 yr)
CFO-led finance automation programs +2.0% Global Medium-term (2–4 yr)
Cloud and SaaS migration +1.8% North America, Europe Short-term (≤2 yr)
AI-powered audit and anomaly detection +1.5% Global Medium-term (2–4 yr)
Embedded-finance corporate card programs +1.2% North America, APAC Short-term (≤2 yr)
Hybrid/remote work policy enforcement +1.0% Global Long-term (≥4 yr)
SMB adoption driven by freemium models +0.8% APAC, LATAM Long-term (≥4 yr)


Mandatory E-Invoicing Regulations

The EU's ViDA directive will require structured e-invoicing for all intra-community B2B transactions by 2028, affecting an estimated 16 million businesses [1]. India's GST e-invoice mandate—already mandatory for firms above INR 5 crore turnover—has processed over 3.5 billion invoices since launch [11]. These regulatory deadlines force enterprises onto compliant platforms, creating a natural upgrade cycle for the Expense Management Software Market that vendors are racing to capture with pre-built tax-engine integrations.

CFO-Led Finance Automation Programs

A 2024 survey found that 73% of CFOs plan to increase spending on finance-process automation over the next two years, with expense management cited as the second-highest-priority workflow behind accounts payable [8]. Fortune 500 firms report cutting expense-cycle times from 14 days to under 3 days after deploying integrated suites. This executive sponsorship turns expense platforms from departmental tools into enterprise-wide cost-intelligence hubs.

AI-Powered Audit and Anomaly Detection

Machine-learning models can now flag duplicate receipts, out-of-policy submissions, and potential fraud across 100% of expense reports—up from the 10–15% sample audits that human teams traditionally managed [6]. SAP Concur reported a 40% reduction in non-compliant claims within six months of enabling its AI audit engine [12]. As these capabilities mature, they create measurable ROI that justifies platform investment even in cost-conscious environments.

Embedded-Finance Corporate Card Programs

Card-linked expense platforms eliminate manual data entry by streaming enriched merchant-category data directly into approval queues. Brex, Ramp, and Navan collectively issued over 4 million corporate cards by mid-2025 [4]. Embedded-card programs cut reimbursement lag to near zero and produce transaction-level spend intelligence that strengthens the value proposition of the Expense Management Software Market.


Restraints Impact Analysis

Restraint ~% Impact on CAGR Geographic Relevance Impact Timeline
Data privacy and cross-border compliance −0.9% Europe, APAC Long-term (≥4 yr)
Integration complexity with legacy ERPs −0.7% Global Medium-term (2–4 yr)
Vendor lock-in and switching costs −0.6% North America, Europe Medium-term (2–4 yr)
Budget constraints in SMBs −0.5% LATAM, MEA Short-term (≤2 yr)
Cybersecurity risks in cloud platforms −0.4% Global Long-term (≥4 yr)


Data Privacy and Cross-Border Compliance

GDPR, India's DPDP Act, and China's PIPL create a patchwork of data-residency requirements that complicate multi-country deployments [13]. Multinationals must ensure that receipt images, employee PII, and transaction logs reside in approved jurisdictions—adding infrastructure cost and slowing rollouts. estimates that 30% of global expense-platform procurement cycles in 2024 included a dedicated data-sovereignty evaluation phase [3].

Integration Complexity with Legacy ERPs

Enterprises running SAP ECC, Oracle E-Business Suite, or other on-premises ERPs face 6–12-month integration timelines when connecting modern cloud expense tools [14]. Custom middleware and API mapping raise the total cost of ownership and delay time-to-value. This friction particularly affects the Expense Management Software Market in industries such as manufacturing and energy, where ERP modernization lags behind the finance-services sector.

Vendor Lock-In and Switching Costs

Multi-year contracts, proprietary data formats, and embedded card dependencies create material switching costs. A 2024 study found that 41% of enterprises cited migration risk as their top barrier to changing expense platforms [15]. This inertia slows competitive churn and can dampen overall market growth by discouraging new entrants from reaching scaled adoption.


Expense Management Software Market Opportunities

AI-Driven Predictive Spend Analytics

Beyond anomaly detection, next-generation platforms will forecast departmental budgets, flag category overspend before month-end, and recommend preferred-vendor alternatives in real time. Early movers that package predictive analytics into standard tiers stand to capture premium pricing power across the Expense Management Software Market.

Emerging-Market SMB Digitization

India, Brazil, and Southeast Asia collectively house over 120 million SMBs, yet software penetration for expense management sits below 8% [10]. Freemium and pay-per-transaction pricing models—pioneered by travel expense automation platforms in India—lower barriers and open a vast greenfield opportunity.

Embedded ESG and Carbon Reporting

Regulators in the EU and California now require scope-3 emissions disclosure, and business travel is a material contributor. Expense platforms that tag transactions with carbon-intensity data can serve as the system of record for ESG reporting, adding a compliance-driven value layer [17].

Data Monetization Through Benchmarking Services

Aggregated, anonymized spend data across thousands of companies enables vendors to sell category-level benchmarking insights back to CFOs. This SaaS-adjacent revenue stream carries near-100% gross margins and deepens platform stickiness [18].

Unified Procure-to-Pay Platform Convergence

Merging expense, procurement, and accounts payable workflows into a single control plane is the next frontier. Coupa and SAP are already pursuing this strategy, and the convergence unlocks cross-sell revenue while reducing total vendor count for buyers in the Expense Management Software Market.


Expense Management Software Market Future Outlook

Autonomous Finance Operations

By 2030, AI agents are expected to handle end-to-end expense processing—from receipt ingestion and policy checking to journal entry and payment—without human intervention for routine transactions. projects that autonomous finance workflows could eliminate 60–70% of manual touchpoints in corporate back offices by 2032 [21]. This shift will redefine vendor value propositions around exception handling and strategic analytics rather than data capture.

Platform Consolidation and Ecosystem Economics

The Expense Management Software Market is converging with broader procure-to-pay and corporate-card ecosystems. Strategic acquirers like Visa, Mastercard, and ERP giants are assembling end-to-end spend platforms through targeted M&A. By 2028, Market Research Future (MRFR) expects the top five vendors to control over 45% of global revenue, up from an estimated 35% today [22].

Real-Time Compliance Engines

Tax authorities in over 60 countries are moving toward continuous transaction controls (CTCs) that require real-time invoice reporting. Platforms that embed multi-jurisdiction tax logic and connect directly to government portals will become indispensable infrastructure. The OECD's Tax Administration 3.0 framework accelerates this trajectory [23].

Sustainability-Linked Spend Intelligence

Corporate net-zero commitments are turning expense data into an ESG reporting asset. Platforms that calculate carbon footprints per trip, per vendor, and per category will unlock a new buying criterion. The Science Based Targets initiative (SBTi) now covers over 7,000 companies, and many require granular scope-3 data that only transaction-level systems can provide [17].


Expense Management Software Market Segmentation

By Solution Type

Segment Key Metric Primary Demand Driver
Cloud Expense-Management Platforms 69.0% share (2025) ERP integration and scalability
Mobile-First Applications 15.8% CAGR (2026–2035) Field-worker and gig-economy capture


Cloud expense-management platforms dominate the Expense Management Software Market because they offer centralized policy engines, automated approval routing, and real-time dashboards accessible from any browser. Enterprises migrating to SAP S/4HANA or Oracle Fusion Cloud are bundling expense modules to reduce point-solution sprawl. Mobile-first applications, meanwhile, are carving out the fastest growth lane. Workers in logistics, healthcare, and construction submit receipts within seconds of a purchase, and OCR accuracy now exceeds 97% on smartphone cameras [6].

By Enterprise Size

Segment Key Metric Primary Demand Driver
Large Enterprises 62.0% share (2025) Multi-entity, multi-currency requirements
Small and Medium Enterprises USD 3.11 Billion (2025) Freemium onboarding and self-serve UX


Large enterprises remain the revenue backbone of the Expense Management Software Market, spending heavily on global deployments that span dozens of legal entities and currencies. SMBs represent the volume growth engine: platforms like Expensify and Zoho Expense offer free tiers that convert users to paid plans once headcount or transaction volumes cross defined thresholds [10].

By Application

Segment Key Metric Primary Demand Driver
Travel and Entertainment Management 39.4% share (2025) Post-pandemic travel rebound
Employee Reimbursement USD 2.18 Billion (2025) Remote-work stipend management
Telecom Expense Management 16.3% CAGR (2026–2035) 5G device and SaaS license proliferation


Travel and entertainment management retains the largest application share as global corporate travel surpasses pre-2020 volumes. Telecom expense management is emerging as the fastest-growing niche because enterprises now manage thousands of mobile devices, SaaS licenses, and IoT connectivity subscriptions—costs that were historically buried in departmental budgets [14].

By End-Use Industry

Segment Key Metric Primary Demand Driver
BFSI 27.2% share (2025) Regulatory audit requirements
IT and Telecom 15.7% CAGR (2026–2035) Distributed workforce complexity
Healthcare USD 0.94 Billion (2025) HIPAA-compliant spend tracking


BFSI institutions lead adoption because regulators demand detailed, auditable transaction trails for every reimbursement. IT and telecom firms—operating with highly distributed, travel-heavy workforces—are adopting integrated suites at the fastest pace, driving double-digit growth through 2035 [9].


Regional Market Share Analysis

Region Key Metric Primary Investment Themes
North America 36.3% share (2025) Suite consolidation, embedded-card adoption
Europe USD 2.25 Billion (2025) ViDA e-invoicing, GDPR-compliant platforms
Asia-Pacific 18.1% CAGR (2026–2035) SMB digitization, GST compliance
South America 7.2% share (2025) Tax-reform-driven modernization
Middle East & Africa USD 0.51 Billion (2025) Vision 2030 digital finance programs
Total USD 8.18 Billion (2025)

The Expense Management Software Market displays a pronounced regional gradient, with mature Western markets dominating current revenue and high-growth economies closing the gap at double-digit CAGRs.


North America

Country Key Metric Key Driver
United States 78.4% of regional share Fortune 500 platform consolidation
Canada 11.2% CAGR (2026–2035) Public-sector digital transformation
Mexico USD 0.18 Billion (2025) CFDI electronic-invoice mandate


The United States accounts for over three-quarters of North American spending, anchored by early enterprise adoption of SAP Concur, Coupa, and card-linked challengers. Canada's federal government earmarked CAD 2.5 billion for back-office digitization in Budget 2024, directly benefiting expense-platform vendors [19]. Mexico's CFDI regime has pushed even mid-sized firms toward compliant digital solutions.

Europe

Country Key Metric Key Driver
Germany 23.1% of regional share Industry 4.0 finance integration
United Kingdom 12.3% CAGR (2026–2035) Post-Brexit regulatory divergence
France USD 0.34 Billion (2025) Factur-X mandate
Italy 14.8% of regional share SDI e-invoicing maturity
Spain 11.8% CAGR (2026–2035) Crea y Crece e-invoice law
Nordic Countries USD 0.22 Billion (2025) High digital-payment penetration
Russia 4.2% of regional share Domestic platform development
Rest of Europe 11.0% CAGR (2026–2035) EU cohesion fund digital grants


Germany's manufacturing heavyweights are integrating expense workflows into SAP S/4HANA migration projects, while Italy's mature SDI system has made structured e-invoicing the norm. The UK is charting an independent path on digital tax reporting through the Making Tax Digital initiative, creating demand for platforms that can serve both EU and UK compliance regimes concurrently [7].

Asia-Pacific

Country Key Metric Key Driver
China 29.5% of regional share Domestic SaaS leaders (Hose, Fenbeitong)
India 19.8% CAGR (2026–2035) GST e-invoicing expansion
Japan USD 0.28 Billion (2025) Invoice-qualified system (Peppol JP)
South Korea 14.6% CAGR (2026–2035) K-Digital voucher program
ASEAN 17.3% CAGR (2026–2035) Cross-border trade digitization
Rest of Asia-Pacific USD 0.09 Billion (2025) Early-stage cloud adoption


India's GST Network processed over 3.5 billion e-invoices by early 2025, creating an infrastructure backbone that expense platforms can plug into for automated tax reconciliation [11]. Local players dominate China's market, though SAP and Oracle maintain footholds among multinationals. Japan's adoption of the Peppol-based qualified-invoice system in October 2023 triggered a fresh procurement cycle for compliant expense solutions.

South America

Country Key Metric Key Driver
Brazil 62.8% of regional share Nota Fiscal Eletrônica (NF-e) mandate
Argentina 11.5% CAGR (2026–2035) Inflation-driven expense-control urgency
Rest of South America USD 0.13 Billion (2025) Gradual digital-tax adoption


Brazil's NF-e system is one of the world's most advanced e-invoicing frameworks, and its extension to services (NFS-e) is propelling cloud expense-platform adoption. Argentina's persistent inflation pushes CFOs to tighten real-time spend controls, making automated policy enforcement a high-priority investment.

Middle East & Africa

Country Key Metric Key Driver
Saudi Arabia 31.4% of regional share Vision 2030 public-sector digitization
UAE 13.9% CAGR (2026–2035) DAFZA free-zone tech incentives
South Africa USD 0.06 Billion (2025) SARS modernization program
Egypt 15.2% CAGR (2026–2035) Mandatory e-receipt rollout
Rest of MEA 4.8% of regional share Early-stage market development


Saudi Arabia's Vision 2030 has earmarked SAR 6.4 billion for government e-services, and expense digitization is a stated priority within the Financial Sector Development Program [20]. Egypt's Tax Authority mandated electronic receipts for B2C transactions in 2023 and is extending the framework to B2B, creating compliance-driven demand across the Expense Management Software Market.


Expense Management Software Market By Region, 2025-2035

Competitive Benchmarking

The Expense Management Software Market is somewhat concentrated, with the Herfindahl-Hirschman Index (HHI) of the top five players expected to be less than 1,200 and the combined share of the top five players in the market to be around 35-40%. The landscape is divided between traditional ERP embedded players, card-connected disruptors and vertical experts. M&A activity increased in 2023–2025 as private-equity sponsors and payments networks sought end-to-end expenditure platforms [22].

Company Est. Revenue Share Range Key Offerings Strategic Positioning
SAP Concur ~12–16% Concur Expense, Concur Travel, Concur Invoice ERP-integrated global suite leader
Coupa Software ~7–10% Coupa BSM Platform, Coupa Pay Procure-to-pay convergence play
Emburse ~5–8% Chrome River, Certify, Abacus, Tallie Multi-brand portfolio for all segments
Brex ~4–7% Brex corporate cards, Brex Empower Card-first spend management disruptor
Navan ~4–6% Navan Expense, Navan Travel Integrated travel-and-expense platform
Ramp ~3–6% Ramp corporate cards, Ramp Intelligence AI-driven savings automation
Expensify ~3–5% Expensify Expense, Expensify Card SMB-focused self-serve platform
Zoho Corporation ~2–4% Zoho Expense, Zoho Books integration Affordable multi-app ecosystem
Fyle Technologies ~1–3% Fyle real-time expense management Credit-card-feed native architecture
Payhawk ~1–3% Payhawk cards, Payhawk Expense European mid-market specialist


Recent News & Developments


  • Ramp (November 2024): Ramp raised $750 million in June 2026 at a $44 billion valuation; previous funding and valuation figures cited for 2024–2025.
  • European Council (July 2024): The ViDA (VAT in the Digital Age) package was formally adopted by the Council of the European Union on March 11, 2025.


  • Coupa Software (February 2023): Completed its USD 8 billion take-private transaction with Thoma Bravo, signaling private-equity confidence in spend-management consolidation [22].


Expense Management Software Market Report Scope

Parameter Detail
Market Scope Global Expense Management Software Market
Study Period 2021–2035
CAGR (Forecast Period) 10.90% (2026–2035)
Base Year 2025 — USD 8.18 Billion
Forecast Endpoint 2035 — USD 23.03 Billion
Fastest Growing Segment Mobile-First Applications (15.8% CAGR)
Companies Profiled 10 (SAP Concur, Coupa, Emburse, Brex, Navan, Ramp, Expensify, Zoho, Fyle, Payhawk)
Valuation Currency USD Billion


FAQs

How long does a typical Expense Management Software Market platform implementation take for a 5,000-employee company?

Most cloud deployments complete in 8–14 weeks, including ERP connector setup and policy configuration. Phased rollouts by region or business unit reduce disruption and accelerate user adoption [14].

What ROI benchmarks should procurement teams expect from expense automation?

Enterprises typically recover 3–5× their annual subscription cost through reduced processing labor, fewer duplicate payments, and faster audit cycles. Payback periods average under 12 months [8].

How does the Expense Management Software Market address multi-currency reimbursement for global workforces?

Leading platforms pull real-time exchange rates from central-bank feeds and apply company-defined hedging rules at the transaction level. This eliminates manual FX reconciliation across subsidiaries [5].

What differentiates card-linked platforms from traditional reimbursement-based expense tools?

Card-linked tools capture transaction data at the point of sale, removing receipt-upload steps entirely. Traditional tools reimburse after submission, creating lag and higher error rates [4].

Are there industry-specific compliance certifications buyers should require from Expense Management Software Market vendors?

Healthcare buyers should verify HIPAA BAA coverage; BFSI organizations need SOC 2 Type II and PCI-DSS attestations. Region-specific certifications like ISO 27701 address data-privacy mandates [16].

How will generative AI reshape expense-policy design over the next five years?

Generative models will draft and refine spend policies based on historical violation patterns and peer benchmarks. CFOs will shift from manual rule-writing to approving AI-suggested guardrails [21].

What integration standards should buyers prioritize when evaluating vendors?

Prioritize platforms offering pre-built connectors for major ERPs (SAP, Oracle, NetSuite) alongside open APIs using REST and OAuth 2.0 standards. Native SFTP and webhook support ensures flexibility [14].    
Author
Author
Author Profile
Kiran Jinkalwad LinkedIn
Research Associate Level - II
Kiran Jinkalwad brings over four years of experience in market research, specializing in the ICT and Semiconductor sectors. She has worked on 50+ projects, including custom studies for companies like Microsoft and Huawei, addressing complex business challenges. With a background in Electronics and Telecommunication, Kiran excels in market estimation, forecasting, and strategic analysis. His sharp analytical skills and industry knowledge consistently deliver actionable insights for diverse clients.
Co-Author
Co-Author Profile
Aarti Dhapte LinkedIn
AVP - Research
A consulting professional focused on helping businesses navigate complex markets through structured research and strategic insights. I partner with clients to solve high-impact business problems across market entry strategy, competitive intelligence, and opportunity assessment. Over the course of my experience, I have led and contributed to 100+ market research and consulting engagements, delivering insights across multiple industries and geographies, and supporting strategic decisions linked to $500M+ market opportunities. My core expertise lies in building robust market sizing, forecasting, and commercial models (top-down and bottom-up), alongside deep-dive competitive and industry analysis. I have played a key role in shaping go-to-market strategies, investment cases, and growth roadmaps, enabling clients to make confident, data-backed decisions in dynamic markets.

Research Approach


Secondary Research

The secondary research process involved comprehensive analysis of regulatory filings, enterprise software industry databases, SaaS market intelligence reports, and authoritative financial technology publications. Key sources included the U.S. Securities and Exchange Commission (SEC) EDGAR Database, Financial Industry Regulatory Authority (FINRA), Internal Revenue Service (IRS) Digital Business Guidelines, European Banking Authority (EBA) ICT Risk Guidelines, UK HM Revenue & Customs (HMRC) Making Tax Digital (MTD) Standards, Payment Card Industry Security Standards Council (PCI SSC), International Organization for Standardization (ISO/IEC 27001 Cloud Security Standards), Association for Financial Professionals (AFP), Institute of Finance and Management (IOFM), Gartner Research (Magic Quadrant for Expense Management Software), IDC Worldwide SaaS and Cloud Software Trackers, Forrester Wave Reports, OICA (Organisation for Economic Co-operation and Development) Digital Economy Outlooks, and national fintech regulatory sandboxes from key markets. These sources were used to collect enterprise adoption statistics, regulatory compliance requirements (SOX, GDPR, VAT e-invoicing mandates), cloud security protocols, pricing benchmarks, and competitive landscape analysis for cloud-based SaaS, on-premise deployments, and hybrid expense management solutions across large enterprises and SME segments.


Primary Research

Qualitative and quantitative insights were obtained by interviewing supply-side and demand-side stakeholders during the primary research process. Supply-side sources encompassed Chief Executive Officers, Chief Technology Officers, Chief Product Officers, and Heads of GTM (Go-to-Market) Strategy from prominent expense management SaaS providers, corporate card issuers with integrated software platforms, and legacy ERP/OEM vendors that were expanding into expense automation. Demand-side sources included Chief Financial Officers, VPs of Finance, Corporate Controllers, Accounting Directors, Procurement Managers, and Travel & Expense (T&E) Administrators from Fortune 500 enterprises, mid-market companies, and high-growth startups in the BFSI, IT & Telecom, Manufacturing, and Healthcare verticals. Primary research verified market segmentation (Cloud vs. On-premise, Integrated vs. Standalone solutions), confirmed product roadmap timelines, and collected insights on enterprise procurement cycles, pricing elasticity, integration capabilities with ERP systems (SAP, Oracle, NetSuite), and compliance automation adoption patterns.

Primary Respondent Breakdown:

By Designation: C-level Primaries (30%), Director Level (35%), Others (35%)

By Region: North America (40%), Europe (25%), Asia-Pacific (25%), Rest of World (10%)


Market Size Estimation

Global market valuation was derived through revenue mapping and enterprise adoption rate analysis. The methodology included:

Identification of 35+ key software vendors and fintech platforms across North America, Europe, Asia-Pacific, and Latin America, including pure-play expense management providers, corporate card platforms with software capabilities, and incumbent ERP suites with native T&E modules

Product mapping across cloud-based SaaS (multi-tenant and single-tenant), on-premise licensed software, and hybrid deployment models, with further segmentation by enterprise size (Large Enterprise >1,000 employees vs. SME <1,000 employees) and industry vertical (BFSI, IT & Telecom, Manufacturing, Retail, Healthcare, Energy)

Analysis of reported annual recurring revenue (ARR) and total revenue specific to expense management portfolios, including disclosed figures from public companies (SAP, Oracle, Coupa) and modeled estimates for high-growth private entities (Brex, Ramp, Navan, Expensify)

Coverage of vendors representing 65-70% of global market share in 2024, with triangulation against disclosed total transaction volumes (GTV) processed through platforms and average revenue per user (ARPU) benchmarks

Extrapolation using bottom-up (number of enterprises by country × adoption rate × ARPU by segment) and top-down (vendor revenue validation against total cloud spend and SaaS penetration rates) approaches to derive segment-specific valuations, with additional validation against IT spending forecasts from Gartner and IDC

Download Free Sample

Kindly complete the form below to receive a free sample of this Report

Download PDF ×

We do not share your information with anyone. However, we may send you emails based on your report interest from time to time. You may contact us at any time to opt-out.