ePharmacy Market (2026 - 2035)

ID: MRFR/HCIT/5152-HCR 148 Pages Rahul Gotadki Last Updated: September 15, 2026
ePharmacy Market Research Report By Product Type (Prescription Medications, Over-the-Counter Medications, Health Supplements, Personal Care Products), By End User (Individuals, Healthcare Professionals, Caregivers), By Device Type (Mobile Applications, Web Platforms, Telehealth Services), By Prescription Method (Electronic Prescriptions, Traditional Prescriptions) and By Regional (North America, Europe, South America, Asia Pacific, Middle East and Africa) - Growth & Industry Forecast 2025 To 2035
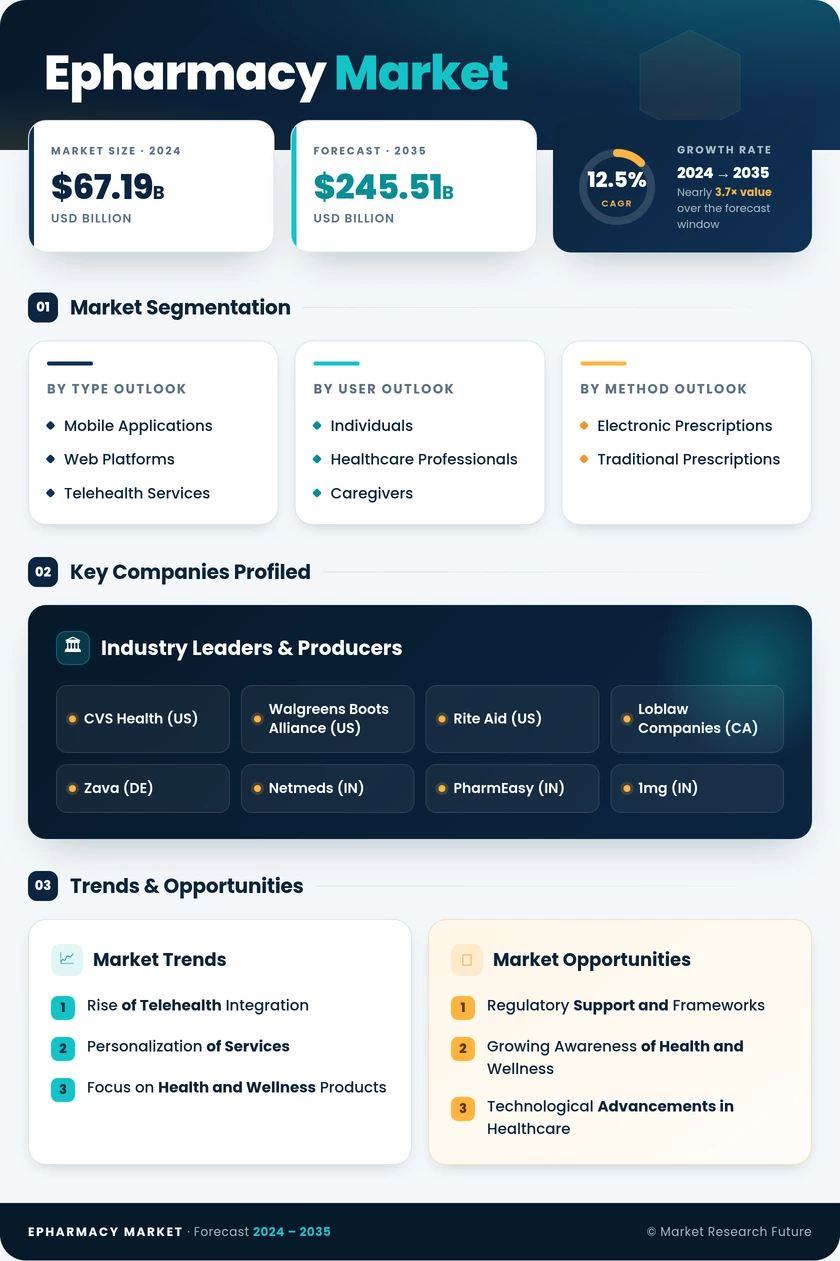
ePharmacy Market
Market Size
Forecast Period2026-2035
CAGR (2026-2035)18.9%
2025 Market SizeUSD 99.49 Billion
2035 Market SizeUSD 566.28 Billion
Key Players
Amazon Pharmacy
CVS Health
Cigna
JD Health
Alibaba Health
Walgreens Boots Alliance
Opportunities
  • Chronic-Care Subscription Conversion
  • Emerging-Market White Space
  • Data Monetization and Real-World Evidence
  1. 1 Market Summary |
    1. 1.1 Study Assumptions & Market Definition |
    2. 1.2 Scope of the Study |
    3. 1.3 Research Methodology
  2. 2 Key Report Takeaways |
    1. 2.1 By Drug Type & Platform |
    2. 2.2 By Product & Therapeutic Area |
    3. 2.3 By Geography
  3. 3 Market Size & Forecast (2021–2035) |
    1. 3.1 Historical Market Size (2021–2025) |
    2. 3.2 Current & Forecast Market Size (2026–2035) |
    3. 3.3 Market Size by Revenue (USD Billion) |
    4. 3.4 Year-over-Year Growth Analysis
  4. 4 Driver Impact Analysis |
    1. 4.1 Electronic Prescription Mandates |
    2. 4.2 Retail Closures and Access Deserts |
    3. 4.3 Super-App Storefront Embedding |
    4. 4.4 Cold-Chain and High-Value Therapy Mix
  5. 5 Restraints Impact Analysis |
    1. 5.1 Regulatory Fragmentation |
    2. 5.2 Rogue Website Proliferation |
    3. 5.3 Controlled-Substance Constraints
  6. 6 Opportunities |
    1. 6.1 Chronic-Care Subscription Conversion |
    2. 6.2 Emerging-Market White Space |
    3. 6.3 Data Monetization and Real-World Evidence |
    4. 6.4 Manufacturer Direct Channels |
    5. 6.5 Cold-Chain-as-a-Service |
    6. 6.6 Industry Value Chain Analysis |
    7. 6.7 Porter's Five Forces Analysis
  7. 7 Regional Market Share & Country-Level Analysis |
    1. 7.1 North America | |
      1. 7.1.1 United States | |
      2. 7.1.2 Canada | |
      3. 7.1.3 Mexico |
    2. 7.2 Europe | |
      1. 7.2.1 Germany | |
      2. 7.2.2 United Kingdom | |
      3. 7.2.3 France | |
      4. 7.2.4 Italy | |
      5. 7.2.5 Spain | |
      6. 7.2.6 Nordic Countries | |
      7. 7.2.7 Russia | |
      8. 7.2.8 Rest of Europe |
    3. 7.3 Asia-Pacific | |
      1. 7.3.1 China | |
      2. 7.3.2 India | |
      3. 7.3.3 Japan | |
      4. 7.3.4 South Korea | |
      5. 7.3.5 ASEAN | |
      6. 7.3.6 Rest of Asia-Pacific |
    4. 7.4 South America | |
      1. 7.4.1 Brazil | |
      2. 7.4.2 Argentina | |
      3. 7.4.3 Rest of South America |
    5. 7.5 Middle East & Africa | |
      1. 7.5.1 Saudi Arabia | |
      2. 7.5.2 UAE | |
      3. 7.5.3 South Africa | |
      4. 7.5.4 Egypt | |
      5. 7.5.5 Rest of Middle East & Africa
  8. 8 Future Outlook (2026–2035) |
    1. 8.1 Algorithmic Adherence Management |
    2. 8.2 Care-Delivery Convergence |
    3. 8.3 Specialty and Biologic Migration |
    4. 8.4 Trust Infrastructure and Verification
  9. 9 Market Segmentation Analysis |
    1. 9.1 By Drug Type | |
      1. 9.1.1 Prescription Drugs | |
      2. 9.1.2 Over-the-Counter Drugs |
    2. 9.2 By Product Type | |
      1. 9.2.1 Cold and Flu Remedies | |
      2. 9.2.2 Vitamins and Dietary Supplements | |
      3. 9.2.3 Skin Care | |
      4. 9.2.4 Weight Loss Products | |
      5. 9.2.5 Dental Products | |
      6. 9.2.6 Others |
    3. 9.3 By Therapeutic Area | |
      1. 9.3.1 Diabetes | |
      2. 9.3.2 Cardiovascular | |
      3. 9.3.3 Respiratory | |
      4. 9.3.4 Gastrointestinal Disorders | |
      5. 9.3.5 Oncology | |
      6. 9.3.6 Dermatology | |
      7. 9.3.7 Others |
    4. 9.4 By Platform | |
      1. 9.4.1 Mobile Users | |
      2. 9.4.2 Desktop Users
  10. 10 Competitive Landscape |
    1. 10.1 Market Share Analysis (2026) |
    2. 10.2 Competitive Benchmarking Matrix |
    3. 10.3 Company Profiles | |
      1. 10.3.1 Amazon Pharmacy | |
      2. 10.3.2 CVS Health | |
      3. 10.3.3 Cigna (Express Scripts) | |
      4. 10.3.4 JD Health | |
      5. 10.3.5 Alibaba Health | |
      6. 10.3.6 Walgreens Boots Alliance | |
      7. 10.3.7 Redcare Pharmacy | |
      8. 10.3.8 DocMorris | |
      9. 10.3.9 Apollo 24 7 | |
      10. 10.3.10 Tata 1mg | |
      11. 10.3.11 Hims & Hers Health | |
      12. 10.3.12 PharmEasy (API Holdings)
  11. 11 Recent News & Developments
  12. 12 Report Scope & Methodology |
    1. 12.1 Study Period & Base Year |
    2. 12.2 Data Sources & Triangulation |
    3. 12.3 Abbreviations
  13. 13 Detailed Sources & Citations
  14. 14 Frequently Asked Questions
  15. 15 LIST OF TABLES |
  16. TABLE 1 Global ePharmacy Market Size & Forecast, by Revenue (USD Billion), 2021–2035 |
  17. TABLE 2 Global ePharmacy Market – Year-over-Year Growth Analysis, 2021–2035 |
  18. TABLE 3 Driver Impact Analysis Matrix, 2026–2035 |
  19. TABLE 4 Restraint Impact Analysis Matrix, 2026–2035 |
  20. TABLE 5 Global ePharmacy Market Size, by Drug Type, 2021–2035 (USD Billion) |
  21. TABLE 6 Global ePharmacy Market Size, by Product Type, 2021–2035 (USD Billion) |
  22. TABLE 7 Global ePharmacy Market Size, by Therapeutic Area, 2021–2035 (USD Billion) |
  23. TABLE 8 Global ePharmacy Market Size, by Platform, 2021–2035 (USD Billion) |
  24. TABLE 9 Global ePharmacy Market Size, by Region, 2021–2035 (USD Billion) |
  25. TABLE 10 North America ePharmacy Market Size, by Country, 2021–2035 (USD Billion) |
  26. TABLE 11 Europe ePharmacy Market Size, by Country, 2021–2035 (USD Billion) |
  27. TABLE 12 Asia-Pacific ePharmacy Market Size, by Country, 2021–2035 (USD Billion) |
  28. TABLE 13 South America ePharmacy Market Size, by Country, 2021–2035 (USD Billion) |
  29. TABLE 14 Middle East & Africa ePharmacy Market Size, by Country, 2021–2035 (USD Billion) |
  30. TABLE 15 North America ePharmacy Market Size, by Drug Type, 2021–2035 (USD Billion) |
  31. TABLE 16 North America ePharmacy Market Size, by Therapeutic Area, 2021–2035 (USD Billion) |
  32. TABLE 17 North America ePharmacy Market Size, by Platform, 2021–2035 (USD Billion) |
  33. TABLE 18 Europe ePharmacy Market Size, by Drug Type, 2021–2035 (USD Billion) |
  34. TABLE 19 Europe ePharmacy Market Size, by Product Type, 2021–2035 (USD Billion) |
  35. TABLE 20 Europe ePharmacy Market Size, by Platform, 2021–2035 (USD Billion) |
  36. TABLE 21 Asia-Pacific ePharmacy Market Size, by Drug Type, 2021–2035 (USD Billion) |
  37. TABLE 22 Asia-Pacific ePharmacy Market Size, by Therapeutic Area, 2021–2035 (USD Billion) |
  38. TABLE 23 Asia-Pacific ePharmacy Market Size, by Platform, 2021–2035 (USD Billion) |
  39. TABLE 24 South America ePharmacy Market Size, by Drug Type, 2021–2035 (USD Billion) |
  40. TABLE 25 South America ePharmacy Market Size, by Product Type, 2021–2035 (USD Billion) |
  41. TABLE 26 Middle East & Africa ePharmacy Market Size, by Drug Type, 2021–2035 (USD Billion) |
  42. TABLE 27 Middle East & Africa ePharmacy Market Size, by Therapeutic Area, 2021–2035 (USD Billion) |
  43. TABLE 28 United States ePharmacy Market Size, by Segment, 2021–2035 (USD Billion) |
  44. TABLE 29 Germany ePharmacy Market Size, by Segment, 2021–2035 (USD Billion) |
  45. TABLE 30 China ePharmacy Market Size, by Segment, 2021–2035 (USD Billion) |
  46. TABLE 31 India ePharmacy Market Size, by Segment, 2021–2035 (USD Billion) |
  47. TABLE 32 Brazil ePharmacy Market Size, by Segment, 2021–2035 (USD Billion) |
  48. TABLE 33 Saudi Arabia ePharmacy Market Size, by Segment, 2021–2035 (USD Billion) |
  49. TABLE 34 Competitive Benchmarking Matrix – Global ePharmacy Market, 2026 |
  50. TABLE 35 Company Profiles – Key Players, Global ePharmacy Market |
  51. TABLE 36 Recent Developments & Strategic Announcements, 2023–2025 |
  52. TABLE 37 Report Scope & Methodology Summary |
  53. TABLE 38 Detailed Sources & Citations Index
  54. 16 LIST OF FIGURES |
  55. FIGURE 1 Global ePharmacy Market – Market Dynamics Snapshot (Drivers, Restraints, Opportunities) |
  56. FIGURE 2 Global ePharmacy Market – Industry Value Chain Analysis |
  57. FIGURE 3 Global ePharmacy Market – Porter's Five Forces Analysis |
  58. FIGURE 4 Global ePharmacy Market Size Trend & Forecast, 2021–2035 (USD Billion) |
  59. FIGURE 5 Year-over-Year Growth Rate Trend, 2022–2035 (%) |
  60. FIGURE 6 Market Share by Drug Type, 2025 vs 2035 (%) |
  61. FIGURE 7 Market Share by Product Type, 2025 (%) |
  62. FIGURE 8 Market Share by Therapeutic Area, 2025 (%) |
  63. FIGURE 9 Market Share by Platform, 2025 vs 2035 (%) |
  64. FIGURE 10 Regional Revenue Share Distribution, 2025 (%) |
  65. FIGURE 11 Regional CAGR Comparison, 2026–2035 (%) |
  66. FIGURE 12 North America Country-Level Share Distribution, 2025 (%) |
  67. FIGURE 13 Europe Country-Level Share Distribution, 2025 (%) |
  68. FIGURE 14 Asia-Pacific Country-Level Share Distribution, 2025 (%) |
  69. FIGURE 15 Competitive Landscape – Estimated Revenue Share Positioning, 2026 |
  70. FIGURE 16 Competitive Positioning Quadrant – Scale vs Specialization |
  71. FIGURE 17 Driver Impact Weighting on Forecast CAGR |
  72. FIGURE 18 Restraint Impact Weighting on Forecast CAGR

Segmentation Quick Reference

DimensionSub-SegmentsDominant SegmentFastest Growing Segment
By Drug TypePrescription Drugs; Over-the-Counter DrugsPrescription DrugsOver-the-Counter Drugs
By Product TypeCold and Flu Remedies; Vitamins and Dietary Supplements; Skin Care; Weight Loss Products; Dental Products; OthersCold and Flu RemediesVitamins and Dietary Supplements
By Therapeutic AreaDiabetes; Cardiovascular; Respiratory; Gastrointestinal Disorders; Oncology; Dermatology; OthersDiabetesGastrointestinal Disorders
By PlatformMobile Users; Desktop UsersMobile UsersMobile Users
By GeographyNorth America; Europe; Asia-Pacific; South America; Middle East & AfricaNorth AmericaAsia-Pacific


Market Segmentation Overview

By Drug Type

Sub-SegmentKey Trend
Prescription DrugsStatutory e-prescription mandates convert paper scripts into digitally redeemable tokens, locking reimbursed volume into remote channels
Over-the-Counter DrugsMobile impulse purchasing and bundled basket-building drive the fastest category expansion


Prescription revenue provides contracted, payer-backed demand while over-the-counter sales supply the acquisition funnel. Operators increasingly design catalogs so that a low-friction over-the-counter purchase precedes the higher-value prescription relationship.

By Product Type

Sub-SegmentKey Trend
Cold and Flu RemediesSeasonal spikes stress-test same-day delivery capacity and drive winter order density
Vitamins and Dietary SupplementsSubscription replenishment produces the strongest reorder economics in the catalog
Skin CareDermatology teleconsultation attachment lifts conversion on prescription-adjacent products
Weight Loss ProductsGLP-1 adjacency creates high-value cash-pay baskets
Dental ProductsAdd-on purchasing improves average order value without new acquisition cost
OthersDiagnostic kits and home medical devices broaden the addressable catalog


Product mix determines fulfillment strategy. High-frequency, low-value categories justify dense micro-fulfillment nodes, while high-value cold-chain categories justify centralized validated facilities with premium courier partnerships.

By Therapeutic Area

Sub-SegmentKey Trend
DiabetesLifelong dosing plus device consumables produce the deepest recurring relationships
CardiovascularAdherence programs tied to payer quality metrics sustain refill volume
RespiratoryInhaler replenishment cycles align well with automated reorder scheduling
Gastrointestinal DisordersPrivacy preference accelerates channel shift toward remote purchase
OncologyOral chemotherapy home dispensing expands with specialty logistics maturity
DermatologyConsultation-to-prescription conversion rates outperform most therapeutic categories
OthersMixed acute and niche specialty demand rounds out the portfolio


Chronic conditions dominate value because they convert single acquisitions into multi-year revenue streams. Acute categories matter for reach and brand recall but contribute proportionally less to lifetime economics.

By Platform

Sub-SegmentKey Trend
Mobile UsersPush-based refill reminders and one-tap reorder drive the majority of transaction growth
Desktop UsersComplex reimbursement workflows and caregiver-managed multi-item orders sustain relevance


Mobile dominance is structural in Asia-Pacific and accelerating elsewhere. Desktop retains a durable niche wherever insurance paperwork, prior authorization, or institutional purchasing requires larger working screens.

By Region

Sub-SegmentKey Trend
North AmericaPayer-steered mail order and same-day delivery competition define the market
EuropeNational e-prescription mandates unlock reimbursed volume for cross-border operators
Asia-PacificSuper-app embedding and teleconsultation bundling deliver the fastest regional growth
South AmericaIncumbent retail chains digitize ahead of independent platform entrants
Middle East & AfricaSovereign health digitization programs anchor demand in Gulf markets


Regional divergence tracks regulatory readiness far more closely than consumer willingness. Markets that made digital prescriptions statutory saw penetration compound within eighteen months, while optional-adoption markets remain dependent on discretionary categories.




Download PDF ×

We do not share your information with anyone. However, we may send you emails based on your report interest from time to time. You may contact us at any time to opt-out.