E-House Market (2026 - 2035)

ID: MRFR/SEM/4127-CR 200 Pages Ankit Gupta Last Updated: September 15, 2026
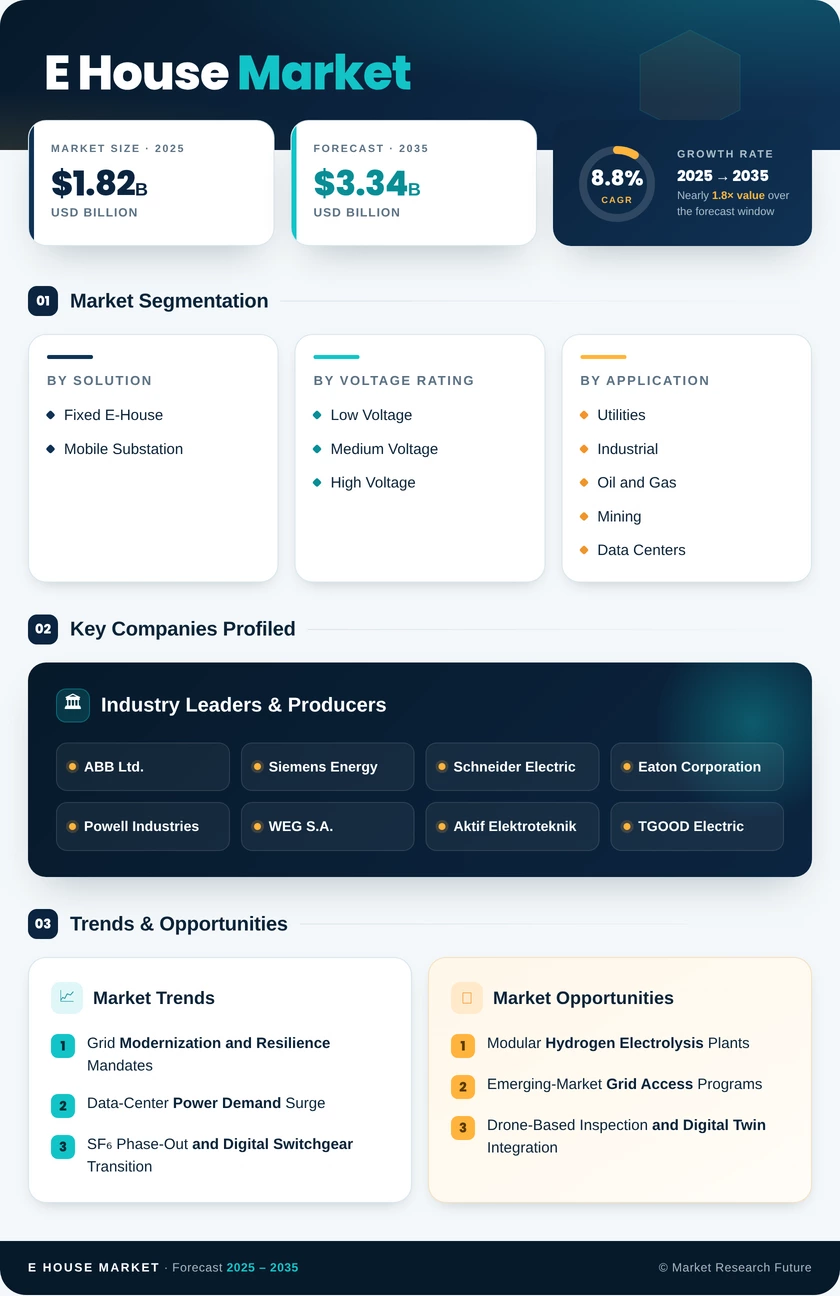
E-House Market Size, Share and Research Report By Solution (Fixed E-House, Mobile Substation), By Voltage Rating (Low Voltage, Medium Voltage, High Voltage), By Application (Utilities, Industrial, Oil and Gas, Mining, Data Centers, Others (Renewables, Hydrogen, Rail)), By Component (Switchgear, Transformer, Protection & Control Systems, Others (Busbar, HVAC, Fire Suppression)), By Deployment Mode (Permanent, Temporary / Relocatable) and By Region (North America, Europe, Asia-Pacific, South America, Middle East & Africa) – Industry Forecast to 2035.
E-House Market
Market Size
Forecast Period2026-2035
CAGR (2026-2035)6.3%
2025 Market SizeUSD 1.82 Billion
2035 Market SizeUSD 3.34 Billion
Key Players
ABB Ltd.
Siemens Energy
Schneider Electric
Eaton Corporation
Powell Industries
WEG S.A.
Opportunities
  • Modular Hydrogen Electrolysis Plants
  • Emerging-Market Grid Access Programs
  • Drone-Based Inspection and Digital Twin Integration
  1. 1 Market Overview |
    1. 1.1 Study Assumptions & Market Definition |
    2. 1.2 Scope of the Study |
    3. 1.3 Research Methodology
  2. 2 Market Summary & Key Takeaways
  3. 3 Market Dynamics |
    1. 3.1 Market Drivers Analysis | |
      1. 3.1.1 Grid Modernization and Resilience Mandates | |
      2. 3.1.2 Data-Center Power Demand Surge | |
      3. 3.1.3 SF₆ Phase-Out and Digital Switchgear Transition | |
      4. 3.1.4 Mining and Oil-Gas Electrification | |
      5. 3.1.5 Renewable Energy Interconnection Expansion | |
      6. 3.1.6 EHS Regulations Favoring Factory Assembly | |
      7. 3.1.7 Modular Hydrogen and Battery Storage Deployments |
    2. 3.2 Market Restraints Analysis | |
      1. 3.2.1 High Upfront Capital Cost Versus Stick-Built | |
      2. 3.2.2 Logistics and Transport Limitations for Large Modules | |
      3. 3.2.3 Skilled-Labor Shortages in Factory Assembly | |
      4. 3.2.4 Permitting and Standardization Fragmentation | |
      5. 3.2.5 Cybersecurity Risks in Digitally Integrated Modules |
    3. 3.3 Market Opportunity Analysis | |
      1. 3.3.1 Modular Hydrogen Electrolysis Plants | |
      2. 3.3.2 Emerging-Market Grid Access Programs | |
      3. 3.3.3 Drone-Based Inspection and Digital Twin Integration | |
      4. 3.3.4 Data-Center Edge Deployments | |
      5. 3.3.5 Circular-Economy Retrofit and Redeployment Models |
    4. 3.4 Industry Value Chain Analysis |
    5. 3.5 Porter's Five Forces Analysis
  4. 4 Global E-House Market Size & Forecast (2021–2035) |
    1. 4.1 Historical Market Size (2021–2025) |
    2. 4.2 Current & Forecast Market Size (2026–2035) |
    3. 4.3 Market Size by Revenue (USD Billion) |
    4. 4.4 Year-over-Year Growth Analysis
  5. 5 Segmentation Analysis |
    1. 5.1 By Solution | |
      1. 5.1.1 Fixed E-House | |
      2. 5.1.2 Mobile Substation |
    2. 5.2 By Voltage Rating | |
      1. 5.2.1 Low Voltage | |
      2. 5.2.2 Medium Voltage | |
      3. 5.2.3 High Voltage |
    3. 5.3 By Application | |
      1. 5.3.1 Utilities | |
      2. 5.3.2 Industrial | |
      3. 5.3.3 Oil and Gas | |
      4. 5.3.4 Mining | |
      5. 5.3.5 Data Centers | |
      6. 5.3.6 Others (Renewables, Hydrogen, Rail) |
    4. 5.4 By Component | |
      1. 5.4.1 Switchgear | |
      2. 5.4.2 Transformer | |
      3. 5.4.3 Protection & Control Systems | |
      4. 5.4.4 Others (Busbar, HVAC, Fire Suppression) |
    5. 5.5 By Deployment Mode | |
      1. 5.5.1 Permanent | |
      2. 5.5.2 Temporary / Relocatable
  6. 6 Regional Analysis |
    1. 6.1 North America | |
      1. 6.1.1 United States | |
      2. 6.1.2 Canada | |
      3. 6.1.3 Mexico |
    2. 6.2 Europe | |
      1. 6.2.1 Germany | |
      2. 6.2.2 United Kingdom | |
      3. 6.2.3 France | |
      4. 6.2.4 Italy | |
      5. 6.2.5 Spain | |
      6. 6.2.6 Nordic Countries | |
      7. 6.2.7 Russia | |
      8. 6.2.8 Rest of Europe |
    3. 6.3 Asia-Pacific | |
      1. 6.3.1 China | |
      2. 6.3.2 India | |
      3. 6.3.3 Japan | |
      4. 6.3.4 South Korea | |
      5. 6.3.5 ASEAN | |
      6. 6.3.6 Rest of Asia-Pacific |
    4. 6.4 South America | |
      1. 6.4.1 Brazil | |
      2. 6.4.2 Argentina | |
      3. 6.4.3 Rest of South America |
    5. 6.5 Middle East & Africa | |
      1. 6.5.1 Saudi Arabia | |
      2. 6.5.2 UAE | |
      3. 6.5.3 South Africa | |
      4. 6.5.4 Egypt | |
      5. 6.5.5 Rest of MEA
  7. 7 Competitive Landscape |
    1. 7.1 Market Share Analysis (2025) |
    2. 7.2 Competitive Benchmarking Matrix |
    3. 7.3 Company Profiles | |
      1. 7.3.1 ABB Ltd. | |
      2. 7.3.2 Siemens Energy | |
      3. 7.3.3 Schneider Electric | |
      4. 7.3.4 Eaton Corporation | |
      5. 7.3.5 Powell Industries | |
      6. 7.3.6 WEG S.A. | |
      7. 7.3.7 Aktif Elektroteknik | |
      8. 7.3.8 TGOOD Electric | |
      9. 7.3.9 Delta Star Inc. | |
      10. 7.3.10 Elgin Power Solutions
  8. 8 Future Outlook & Strategic Recommendations (2026–2035) |
    1. 8.1 Electrification Supercycle |
    2. 8.2 AI-Enabled Predictive Operations |
    3. 8.3 Platform-Based Procurement Models |
    4. 8.4 ESG and Sustainability Reporting Pressure
  9. 9 Recent Developments & News
  10. 10 Frequently Asked Questions (FAQs)
  11. 11 Report Scope & Methodology |
    1. 11.1 Study Period & Base Year |
    2. 11.2 Data Sources & Citations |
    3. 11.3 Abbreviations
  12. 12 LIST OF TABLES |
  13. TABLE 1 Global E-House Market Size & Forecast, by Revenue (USD Billion), 2021–2035 |
  14. TABLE 2 Global E-House Market — Year-over-Year Growth Analysis, 2021–2035 |
  15. TABLE 3 Global E-House Market — Driver Impact Analysis |
  16. TABLE 4 Global E-House Market — Restraint Impact Analysis |
  17. TABLE 5 Global E-House Market Size, by Solution, 2021–2035 (USD Billion) |
  18. TABLE 6 Global E-House Market Size, by Voltage Rating, 2021–2035 (USD Billion) |
  19. TABLE 7 Global E-House Market Size, by Application, 2021–2035 (USD Billion) |
  20. TABLE 8 Global E-House Market Size, by Component, 2021–2035 (USD Billion) |
  21. TABLE 9 Global E-House Market Size, by Deployment Mode, 2021–2035 (USD Billion) |
  22. TABLE 10 Global E-House Market Size, by Region, 2021–2035 (USD Billion) |
  23. TABLE 11 North America E-House Market Size, by Country, 2021–2035 (USD Billion) |
  24. TABLE 12 Europe E-House Market Size, by Country, 2021–2035 (USD Billion) |
  25. TABLE 13 Asia-Pacific E-House Market Size, by Country, 2021–2035 (USD Billion) |
  26. TABLE 14 South America E-House Market Size, by Country, 2021–2035 (USD Billion) |
  27. TABLE 15 Middle East & Africa E-House Market Size, by Country, 2021–2035 (USD Billion) |
  28. TABLE 16 Competitive Benchmarking Matrix — Global E-House Market, 2025 |
  29. TABLE 17 Company Profiles — Key Players, Global E-House Market |
  30. TABLE 18 Recent Developments & Strategic Announcements, 2023–2025 |
  31. TABLE 19 Report Scope & Methodology Summary |
  32. TABLE 20 Detailed Sources and Citations
  33. 13 LIST OF FIGURES |
  34. FIGURE 1 Global E-House Market Dynamics — Drivers, Restraints, and Opportunities |
  35. FIGURE 2 E-House Industry Value Chain Analysis |
  36. FIGURE 3 Porter's Five Forces Analysis — Global E-House Market |
  37. FIGURE 4 Global E-House Market Size Trend & Forecast (USD Billion), 2021–2035 |
  38. FIGURE 5 Global E-House Market Share, by Solution, 2025 |
  39. FIGURE 6 Global E-House Market Share, by Voltage Rating, 2025 |
  40. FIGURE 7 Global E-House Market Share, by Application, 2025 |
  41. FIGURE 8 Global E-House Market Share, by Component, 2025 |
  42. FIGURE 9 Global E-House Market Share, by Deployment Mode, 2025 |
  43. FIGURE 10 Global E-House Market Share, by Region, 2025 |
  44. FIGURE 11 North America E-House Market Size, by Country, 2021–2035 |
  45. FIGURE 12 Europe E-House Market Size, by Country, 2021–2035 |
  46. FIGURE 13 Asia-Pacific E-House Market Size, by Country, 2021–2035 |
  47. FIGURE 14 South America E-House Market Size, by Country, 2021–2035 |
  48. FIGURE 15 Middle East & Africa E-House Market Size, by Country, 2021–2035 |
  49. FIGURE 16 Competitive Landscape — Market Share Analysis, 2025 |
  50. FIGURE 17 Competitive Benchmarking Radar Chart — Top 10 Players

Segmentation Quick Reference

DimensionSub-SegmentsDominant SegmentFastest Growing Segment
SolutionFixed E-House; Mobile SubstationFixed E-HouseMobile Substation
Voltage RatingLow Voltage; Medium Voltage; High VoltageMedium VoltageHigh Voltage
ApplicationUtilities; Industrial; Oil and Gas; Mining; Data Centers; OthersUtilitiesData Centers
ComponentSwitchgear; Transformer; Protection & Control Systems; OthersSwitchgearProtection & Control Systems
Deployment ModePermanent; Temporary / RelocatablePermanentTemporary / Relocatable
GeographyAsia-Pacific; North America; Europe; South America; Middle East & AfricaAsia-PacificMiddle East & Africa


Market Segmentation Overview

By Solution

Sub-SegmentKey Trend
Fixed E-HouseIncreasing adoption of SF₆-free switchgear in permanent utility substations
Mobile SubstationGrowing utility stockpiling for storm-response and grid-maintenance flexibility


Fixed e-house units continue to anchor the market, serving as the primary format for utility substations, industrial plants, and data-center power rooms. Mobile substations are carving out a specialized niche as grid operators invest in rapid-deployment emergency response fleets.

By Voltage Rating

Sub-SegmentKey Trend
Low VoltageExpansion in data-center UPS and low-voltage distribution boards
Medium VoltageCore distribution backbone for utilities and industrial campuses
High VoltageRising demand from renewable-energy collection substations and transmission upgrades


Medium-voltage configurations serve the broadest range of applications, while high-voltage units are gaining ground as renewable-energy projects push step-up substation requirements into remote areas.

By Application

Sub-SegmentKey Trend
UtilitiesGrid resilience mandates accelerating modular substation procurement
IndustrialChemical and manufacturing plants are standardizing on factory-assembled electrical rooms.
Oil and GasUpstream electrification, replacing diesel generation with grid-connected e-houses
MiningUnderground and open-pit operations transitioning to zero-emission electrical systems
Data CentersHyperscale and edge campuses adopting pre-commissioned power blocks
OthersHydrogen electrolysis, rail electrification, and temporary event power


Utility and data-center segments together define the growth trajectory for the market, while oil-gas and mining applications provide stable, project-driven demand.

By Component

Sub-SegmentKey Trend
SwitchgearTransition from SF₆ to vacuum and clean-air technologies
TransformerCompact dry-type and liquid-immersed designs for confined enclosures
Protection & Control SystemsIEC 61850 digital relay adoption and embedded IoT monitoring
Others (Busbar, HVAC, Fire Suppression)Enhanced fire-rated and climate-control specifications for extreme environments


Switchgear remains the highest-value component, but protection and control systems are growing fastest as digital substation standards gain traction globally.

By Deployment Mode

Sub-SegmentKey Trend
PermanentLong-life installations for utility and industrial critical infrastructure
Temporary / RelocatableLease-and-redeploy models for mining, oil-gas, and disaster-recovery applications


Permanent installations dominate revenue, but the temporary and relocatable segment is unlocking new business models based on asset-light, opex-oriented procurement.


 

Download PDF ×

We do not share your information with anyone. However, we may send you emails based on your report interest from time to time. You may contact us at any time to opt-out.