Commercial Vehicles Market (2026 - 2035)

Commercial Vehicles Market Research Report By Vehicle Type (Heavy-Duty Commercial Trucks, Light Commercial Vans, Buses), By Propulsion Type (Internal Combustion Engine, Hybrid and Electric Vehicles), By Gross Vehicle Weight Rating (Class 1 (≤6,000 lbs), Class 2 (6,001–10,000 lbs), Class 3 (10,001–14,000 lbs), Class 4 (14,001–16,000 lbs), Class 5 (Above 16 tons)), By End-Use Industry (Logistics and E-Commerce, Construction and Mining, Public Transit, Agriculture, Others (Defense, Utilities)) and By Regional (North America, Europe, South America, Asia Pacific, Middle East and Africa) - Industry Forecast to 2035
ID: MRFR/AT/32671-HCR
128 Pages
Triveni Bhoyar, Aarti Dhapte
Last Updated: June 22, 2026
Commercial Vehicles Market

Market Size

Forecast Period2026-2035
CAGR (2026-2035)4.85%
2025 Market SizeUSD 1.02 Trillion
2035 Market SizeUSD 1.64 Trillion

Key Players

Daimler Truck
Volvo Group
PACCAR
Tata Motors
SAIC Motor
Traton Group
Opportunities
  • Autonomous Highway Platooning
  • Subscription and Truck-as-a-Service Models
  • Emerging-Market Fleet Modernization

Commercial Vehicle Market Summary

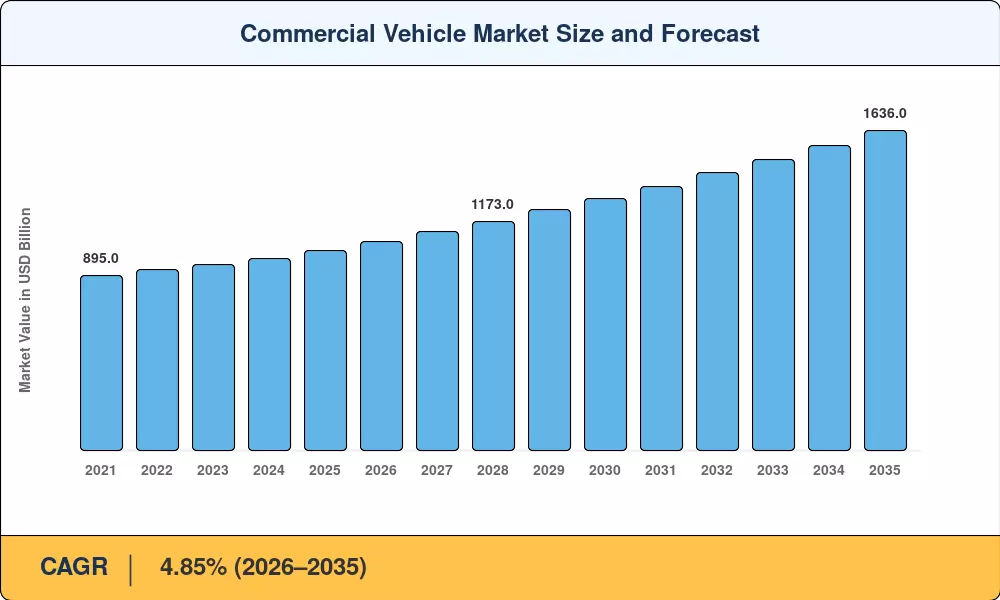
The global commercial vehicle market reached an estimated USD 1.02 trillion in 2025 and is projected to grow from USD 1.07 trillion in 2026 to USD 1.64 trillion by 2035, registering a compound annual growth rate of 4.85% during the forecast period. This expansion sits at the intersection of two powerful forces: governments worldwide are tightening CO₂ emission standards—the European Union's revised heavy-duty vehicle regulation now mandates a 45% reduction in fleet-average emissions by 2030 [2]—and global freight volumes continue climbing at roughly 3.4% per year, driven by urbanization and e-commerce penetration [3].

A technology transformation is reshaping the commercial vehicle market from the chassis up. Battery-electric and hydrogen fuel-cell drivetrains are displacing conventional diesel powertrains in last-mile and regional-haul segments, supported by over USD 38 billion in cumulative public-private investment pledged through 2030 across the EU, China, and North America [4]. Yet internal-combustion platforms still dominate long-haul freight, where megawatt-class charging infrastructure remains sparse and total cost of ownership economics have not yet fully tipped in favor of zero-emission alternatives [5].

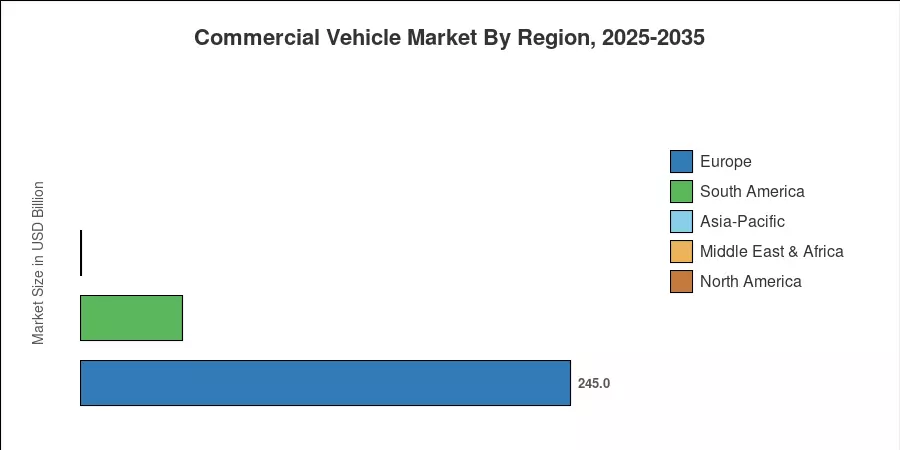
Asia-Pacific led the commercial vehicle market in 2025 with approximately 49.9% of global revenue, anchored by fleet expansion programs in China and India. Europe held the second-largest share at roughly 24.0%, propelled by clean-transport corridor funding and accelerating depot electrification mandates [6]. North America, the fastest-growing developed region, accounted for about 18.0% of the commercial vehicle market and is seeing strong order backlogs as freight carriers replace aging Class 8 fleets [7]. The decade ahead will be defined by how quickly charging infrastructure, battery cost reduction, and autonomous-driving regulation converge to reshape fleet procurement decisions globally.


Key Report Takeaways

• By Vehicle Type

  • Heavy-duty commercial trucks captured an estimated 45.5% share of the commercial vehicle market in 2025, driven by infrastructure spending and long-haul freight demand.
  • Light commercial vans are on track to register a 6.74% CAGR through 2035, fueled by same-day delivery growth and urban logistics expansion.
  • Buses are projected to reach USD 184 billion by 2035, as municipal transit agencies accelerate fleet renewal under clean-air mandates.

• By Propulsion Type

  • Internal-combustion engine platforms represented roughly 63.5% of the commercial vehicle market in 2025, still dominant in long-haul and heavy-payload applications.
  • Hybrid and electric variants are expected to grow at a 9.08% CAGR, outpacing the overall commercial vehicle market as battery costs decline toward USD 80/kWh.

• By Region

  • Asia-Pacific generated 49.9% of the global commercial vehicle market revenue in 2025.
  • North America's commercial vehicle market is forecast to grow at a 5.12% CAGR, supported by federal incentives under the Inflation Reduction Act.
  • Europe accounted for USD 245 billion in 2025, with Germany and the UK leading fleet electrification investments.


Commercial Vehicle Market Size and Forecast (2021–2035)

Market Research Future's proprietary sizing model integrates bottom-up production and registration data from over 40 country-level sources, calibrated against top-down revenue estimates from OEM financial disclosures, trade association data, and customs statistics [8]. Historical figures (2021–2024) are actuals; 2025 is the base-year estimate; 2026–2035 are forecast values.

Commercial Vehicle Market Size and Forecast
Our Impact
Enabled $4.3B Revenue Impact for Fortune 500 and Leading Multinationals
Partnering with 2000+ Global Organizations Each Year
30K+ Citations by Top-Tier Firms in the Industry

Driver Impact Analysis

Driver ~% Impact on CAGR Geographic Relevance Impact Timeline
Tightening CO₂ and emission regulations +0.9% Global Medium-term (2–4 yr)
E-commerce and last-mile delivery expansion +0.8% North America, Asia-Pacific Short-term (≤2 yr)
Battery cost deflation below USD 100/kWh +0.7% Global Medium-term (2–4 yr)
Government purchase subsidies and tax credits +0.6% China, EU, US Short-term (≤2 yr)
Infrastructure modernization (roads, ports) +0.5% Asia-Pacific, MEA Long-term (≥4 yr)
Autonomous and connected vehicle technology +0.4% North America, Europe Long-term (≥4 yr)
Urbanization and freight-density growth +0.3% Global Long-term (≥4 yr)


Tightening Emission Regulations

The EU's revised CO₂ standards for heavy-duty vehicles require a 45% reduction in fleet-average emissions by 2030 and a 90% reduction by 2040 relative to 2019 baselines, effectively compelling OEMs to shift production toward zero-emission drivetrains [2]. In the United States, the EPA's Phase 3 Greenhouse Gas Standards finalized in 2024 target a 46% reduction in heavy-truck emissions by model year 2032 [10]. These overlapping regulatory timelines create a predictable demand signal that is accelerating R&D investment across the commercial vehicle market.

E-Commerce and Last-Mile Delivery Expansion

Global package volumes hit 200 billion units in 2024 and are predicted to cross 300 billion by 2030, according to Pitney Bowes package Shipping Index statistics [3]. Each incremental billion parcels translates into around 15,000–20,000 additional delivery vehicles required yearly, making last-mile logistics a fundamental growth driver for the commercial vehicle sector. Retailers' same-day and next-day delivery obligations are cutting vehicle replacement cycles from an average of 8 years to under 5 years in established markets [7].


Battery Cost Deflation

BloombergNEF's 2024 Battery Price Survey pegged average lithium-ion pack costs at USD 115/kWh, down 14% year-on-year, and projects costs to fall below USD 80/kWh by 2030 for LFP chemistries optimized for commercial vehicles [4]. At that price point, the total cost of ownership for a Class 6 electric delivery truck undercuts its diesel equivalent within 3 years of operation, removing the primary economic barrier to fleet electrification across mid-weight segments of the commercial vehicle market [5].

Government Purchase Incentives

China's New Energy Vehicle subsidy framework allocated over CNY 50 billion (approximately USD 7 billion) to commercial-grade electric and hydrogen trucks between 2022 and 2025, while the US Inflation Reduction Act provides up to USD 40,000 in clean vehicle tax credits per qualifying Class 4–8 truck [12]. India's FAME III program, announced in 2024, extends purchase subsidies to electric buses and light-duty freight vehicles through 2028 [13]. These fiscal mechanisms directly lower upfront acquisition costs, accelerating fleet replacement cycles and expanding addressable demand in the commercial vehicle market.


Restraints Impact Analysis

Restraint ~% Impact on CAGR Geographic Relevance Impact Timeline
Charging and refueling infrastructure gaps –0.6% Global Medium-term (2–4 yr)
High upfront cost of zero-emission trucks –0.5% Emerging markets Short-term (≤2 yr)
Grid capacity and connection delays –0.4% Europe, South Asia Medium-term (2–4 yr)
Supply chain concentration for battery minerals –0.3% Global Long-term (≥4 yr)
Regulatory fragmentation across jurisdictions –0.2% Global Long-term (≥4 yr)


Charging Infrastructure Deficits

By the end of 2024, there were fewer than 3,500 public high-power charging stations that could accommodate heavy commercial vehicles worldwide, according to projections by the International Energy Agency [11]. By 2030, more than 50,000 such stations would be needed to support the anticipated adoption of zero-emission trucks. Even in cases where purchase incentives are substantial, depot charging is similarly limited; grid connection lead times in Germany and the UK typically range from 18 to 36 months, causing bottlenecks that impede fleet electrification [6]. The biggest obstacle to the medium-term expansion of the commercial vehicle sector is this infrastructural gap.


Upfront Cost Premium for Electric Trucks

A battery-electric Class 8 tractor still carries a 40–60% price premium over its diesel counterpart, translating into an incremental USD 80,000–120,000 per unit [5]. In price-sensitive markets across Southeast Asia, South America, and Africa, this premium effectively limits zero-emission adoption to subsidized municipal bus programs. Until battery costs or residual-value models close this gap, the commercial vehicle market will see a bifurcated growth trajectory between mature and emerging economies.


Commercial Vehicle Market Opportunities

Autonomous Highway Platooning

Level 4 autonomous platooning technology, now undergoing large-scale pilots in Texas, Germany, and China's Guangdong province, could reduce long-haul fuel consumption by 10–15% and address chronic driver shortages affecting the commercial vehicle market [14]. Waymo Via and TuSimple have collectively logged over 20 million autonomous miles on US highways through 2024, providing the safety data needed for regulatory approvals expected between 2027 and 2030.

Subscription and Truck-as-a-Service Models

Fleet-as-a-Service platforms are decoupling vehicle ownership from usage, allowing small and mid-sized logistics operators to access new electric trucks without balance-sheet commitments [19]. This business model expansion could unlock an addressable market worth an estimated USD 90 billion by 2032, particularly in the commercial vehicle market's light-duty and medium-duty segments, where replacement cycles are shorter.

Emerging-Market Fleet Modernization

With average vehicle ages of more than 15 years, South Asia and Sub-Saharan Africa run some of the oldest commercial fleets in the world [17]. Scrappage incentive programs based on India's Vehicle Modernization Policy have been implemented by the governments of Nigeria, Kenya, and Bangladesh, offering the commercial vehicle market a multi-decade replacement opportunity.


Hydrogen Fuel-Cell Long-Haul Trucks

Green hydrogen production costs are forecast to fall below USD 3/kg by 2030 in regions with abundant renewable energy, making hydrogen-fueled Class 8 trucks cost-competitive with diesel on routes exceeding 500 km [15]. Joint ventures such as Daimler Truck and Volvo's cellcentric initiative are investing over EUR 1.2 billion in fuel-cell stack commercialization.

Connected-Vehicle Data Monetization

Telematics data generated by connected commercial fleets—spanning tire pressure, brake wear, fuel efficiency, and route optimization—represents a new revenue stream valued at an estimated USD 25 billion globally by 2030 [20]. Insurance telematics, predictive maintenance contracts, and dynamic routing services create margin opportunities beyond the vehicle sale itself, reshaping profitability across the commercial vehicle market.


Commercial Vehicle Market Future Outlook

Electrification Supercycle

Battery-electric commercial vehicles are expected to account for more than 30% of new truck sales in the EU and China by 2032, according to IEA projections [11]. The commercial vehicle market is entering an electrification supercycle in which falling battery costs, expanding charging networks, and tightening emission standards create self-reinforcing adoption loops. OEMs that do not secure battery supply agreements and charging partnerships by 2028 risk losing access to fleet customers committed to the Science Based Targets initiative (SBTi) decarbonization timelines [4].

Autonomous Freight Corridors

Level 4 autonomous trucking corridors on predefined highway routes are expected to become commercially operational in the US Sun Belt, Germany's A2 autobahn, and China's G15 expressway by 2029 [14]. The economic case is compelling: autonomous trucks operating in relay mode can cover 20–22 hours per day versus 11 hours under current US hours-of-service rules, effectively doubling asset utilization. For the commercial vehicle market, this shift will reshape purchasing criteria from driver comfort toward sensor-suite reliability and software-update cycles.

Platform Economics and Software-Defined Vehicles

Software-defined architecture is transforming commercial vehicles from single-purpose machines into upgradable platforms. Over-the-air updates can recalibrate powertrain efficiency, enable new autonomous features, and integrate telematics services after the point of sale. estimates that software and digital services will contribute up to 20% of commercial-vehicle OEM revenue by 2030, compared with under 5% in 2023 [20]. This evolution demands new competencies in the commercial vehicle market—cybersecurity, cloud infrastructure, and application-layer partnerships with logistics software providers.

ESG Reporting and Scope 3 Pressure

Fleet operators are being pressured by corporate sustainability reporting standards, such as the SEC's climate-disclosure requirement and the EU's Corporate Sustainability Reporting Directive (CSRD), to monitor and report Scope 3 emissions from their transportation providers [23]. A procurement-driven demand signal for the commercial vehicle industry that functions independently of fuel-price economics is created when shippers increasingly demand that carriers use low-emission vehicles. This regulatory pressure spreads throughout the supply chain.


Commercial Vehicle Market Segmentation

By Vehicle Type

Segment Key Metric Primary Demand Driver
Heavy-Duty Commercial Trucks 45.5% share (2025) Infrastructure construction, long-haul freight
Light Commercial Vans 6.74% CAGR (2026–2035) E-commerce last-mile delivery
Buses USD 184 B (2035 est.) Municipal transit fleet renewal


Heavy-duty commercial trucks remain the revenue backbone of the commercial vehicle market, commanding nearly half of total spending in 2025. Demand is structurally linked to GDP growth, construction activity, and intercity freight volumes, with Class 8 tractors representing the highest unit-value segment. Pre-buy cycles ahead of emission-regulation deadlines historically create 12–18-month demand spikes, as fleet operators accelerate purchases of compliant models before price increases take effect.

Light commercial vans represent the fastest-expanding vehicle category in the commercial vehicle market, driven by the structural shift toward direct-to-consumer delivery models. Amazon, JD.com, and other major e-commerce platforms have collectively committed to deploying over 200,000 electric delivery vans globally by 2030, pulling OEM production plans forward [3]. The segment's growth is further supported by gig-economy logistics platforms that require nimble, fuel-efficient vehicles optimized for urban stop-and-go duty cycles.

By Propulsion Type

Segment Key Metric Primary Demand Driver
Internal Combustion Engine 63.5% share (2025) Long-haul cost efficiency, established infrastructure
Hybrid and Electric Vehicles 9.08% CAGR (2026–2035) Emission mandates, battery cost reduction


Internal-combustion engines continue to power the majority of the global commercial fleet, and their dominance will persist through the early 2030s in heavy-duty long-haul applications where energy density and refueling speed favor diesel and natural-gas powertrains. The commercial vehicle market is nonetheless experiencing a decisive pivot: hybrid and electric platforms are capturing an increasing share of new orders in the sub-16-ton weight classes, where daily range requirements fall within current battery capabilities. BloombergNEF projects that electric trucks will reach total-cost-of-ownership parity with diesel across all weight classes by 2033 in key markets [4].

By Gross Vehicle Weight Rating

Segment Key Metric Primary Demand Driver
Class 5 (Above 16 tons) 48.8% share (2025) Heavy construction, long-haul trucking
Class 2 (6,001–10,000 lbs) 7.78% CAGR (2026–2035) Urban delivery, service fleets
Class 1 (≤6,000 lbs) USD 72 B (2025) Last-mile logistics, utility fleets
Class 3 (10,001–14,000 lbs) 4.61% CAGR (2026–2035) Regional distribution
Class 4 (14,001–16,000 lbs) USD 89 B (2025) Medium-duty vocational applications


By End-Use Industry

Segment Key Metric Primary Demand Driver
Logistics and E-Commerce 41.2% share (2025) Parcel-volume growth, same-day delivery demands
Construction and Mining 6.28% CAGR (2026–2035) Infrastructure spending, resource extraction
Public Transit USD 95 B (2025) Municipal fleet electrification mandates
Agriculture 4.36% CAGR (2026–2035) Mechanization in developing economies
Others (Defense, Utilities) USD 68 B (2025) Specialized vocational applications


Logistics and e-commerce are the single largest end-use segment of the commercial vehicle market, reflecting the structural transformation of retail toward digital channels. Global parcel deliveries are growing at more than 10% annually in Asia-Pacific and 6–8% in North America, directly translating into demand for Class 2–5 delivery vehicles [3]. Construction and mining activity, while cyclical, provides a stable base of heavy-truck demand—particularly in Asia-Pacific and the Middle East, where sovereign infrastructure programs have multi-decade spending horizons.


Regional Market Share Analysis

Region Key Metric Primary Investment Themes
North America 5.12% CAGR (2026–2035) EPA Phase 3 compliance, Class 8 fleet renewal
Europe USD 245 B (2025) Clean-transport corridors, Euro VII transition
Asia-Pacific 49.9% share (2025) NEV mandates, infrastructure modernization
South America USD 51 B (2025) Fleet scrappage programs, agribusiness logistics
Middle East & Africa 5.38% CAGR (2026–2035) Construction boom, fleet modernization
Total USD 1,020 B (2025)

The commercial vehicle market displays distinct regional demand characteristics shaped by regulatory environments, infrastructure maturity, and freight-economy structure.


North America

Country Key Metric Key Driver
United States 78.2% of regional share IRA clean vehicle credits, Class 8 replacement cycle
Canada 5.21% CAGR Zero-emission vehicle mandate for medium/heavy trucks
Mexico USD 15 B (2025) Nearshoring-driven manufacturing expansion


North America's commercial vehicle market benefits from the strongest freight-per-capita intensity globally. The US dominates regional demand, with over 3.8 million Class 3–8 units in active service and an average fleet age of 7.2 years that is approaching the replacement threshold [7]. Canada's federal government adopted a 100% zero-emission medium and heavy-duty vehicle sales mandate by 2040, creating long-duration policy certainty for OEMs investing in electric truck assembly plants in Ontario and Quebec [21].

Europe

Country Key Metric Key Driver
Germany 28.5% of regional share Autobahn toll exemptions for zero-emission trucks
United Kingdom 6.18% CAGR Clean Air Zones expanding to 30+ cities
France USD 31 B (2025) Eco-tax rebates for electric LCVs
Italy 4.52% CAGR Southern Corridor Logistics Modernization
Spain USD 18 B (2025) MOVEA incentive program extensions
Nordic Countries 6.42% CAGR Green hydrogen hub investments
Russia USD 19 B (2025) Import substitution policies post-sanctions
Rest of Europe 4.28% CAGR EU cohesion fund fleet upgrades


Europe's commercial vehicle market is shaped by the EU's comprehensive Clean Vehicles Directive and the impending Euro VII emission standard, expected to take effect by 2028. Germany alone accounted for over a quarter of regional revenue in 2025, supported by Maut toll exemptions for battery-electric trucks and a EUR 1.6 billion government co-investment in depot charging infrastructure [6]. The UK's escalating Clean Air Zone network now covers 12 major cities, with expansion to 30+ planned by 2028, forcing fleet operators to accelerate replacement of older diesel vehicles.

Asia-Pacific

Country Key Metric Key Driver
China 52.3% of regional share NEV commercial mandate, BYD/SAIC production scale
India 6.85% CAGR FAME III subsidies, Bharat Stage VII transition
Japan USD 48 B (2025) Green Innovation Fund for hydrogen trucks
South Korea 5.94% CAGR K-EV100 corporate fleet electrification program
ASEAN USD 37 B (2025) Cross-border logistics corridor expansion
Rest of Asia-Pacific 5.67% CAGR Mining and resource-sector fleet demand


Asia-Pacific is the engine of the commercial vehicle market, and China alone produces more commercial vehicles annually than any other country. The Chinese Ministry of Industry and Information Technology's 2025 NEV roadmap targets 20% new energy penetration across commercial-grade vehicles by 2027, pulling forward electrification timelines that many Western OEMs had set for 2030 [12]. India's commercial vehicle market is growing rapidly as the Bharatmala Pariyojana highway program creates over 35,000 km of new freight corridors, directly expanding addressable route-miles for heavy trucks [13].

South America

Country Key Metric Key Driver
Brazil 64.7% of regional share Proconve P9 emission standards, agribusiness expansion
Argentina 4.15% CAGR Agricultural export logistics
Rest of South America USD 8 B (2025) Mining fleet renewal in Chile and Peru


Brazil's dominance in South America's commercial vehicle market stems from its role as the continent's largest agricultural exporter, where soybean and meat supply chains demand massive long-haul fleets. The Proconve P9 emission regulation, closely aligned with Euro VI standards, went into full enforcement in 2023 and is driving replacement demand across the heavy-duty segment [22].

Middle East & Africa

Country Key Metric Key Driver
Saudi Arabia 31.4% of regional share Vision 2030 infrastructure build-out
UAE 5.64% CAGR Logistics hub positioning, Jebel Ali port expansion
South Africa USD 6 B (2025) Mining and construction fleet demand
Egypt 5.87% CAGR Suez Canal economic zone development
Rest of MEA USD 9 B (2025) Urbanization and road-building programs


The Middle East & Africa represent the smallest but one of the fastest-growing portions of the commercial vehicle market. Saudi Arabia's Vision 2030 infrastructure pipeline—encompassing NEOM, the Red Sea Project, and Riyadh Metro Phase II—is generating outsized demand for construction-grade trucks and specialized vehicles [17]. Sub-Saharan African markets, while smaller in absolute terms, present long-duration growth opportunities as average fleet ages exceed 18 years and governments introduce scrappage and duty-reduction incentives.


Commercial Vehicle Market By Region, 2025-2035

Competitive Benchmarking

The commercial vehicle market exhibits medium concentration, with the top five players—Daimler Truck, Volvo Group, PACCAR, Tata Motors, and SAIC Motor—collectively holding an estimated 32–40% of global revenue. The Herfindahl-Hirschman Index (HHI) for the sector falls in the 600–900 range, indicating a moderately competitive landscape where established incumbents defend scale advantages in powertrain manufacturing and dealer networks while newer entrants—particularly Chinese OEMs—compete aggressively on price and electric-vehicle technology.

Company Est. Revenue Share Range Key Offerings Strategic Positioning
Daimler Truck 8–11% Freightliner, Mercedes-Benz Trucks, FUSO Global leader in heavy-duty; eActros and GenH2 fuel-cell programs
Volvo Group 7–10% Volvo Trucks, Renault Trucks, Mack Vertically integrated; early electric-truck commercialization
PACCAR 5–8% Kenworth, Peterbilt, DAF Premium positioning; strong North American and European presence
Tata Motors 5–7% Tata Trucks, Daewoo CV (India, SE Asia) Emerging-market cost leader; growing electric bus portfolio
SAIC Motor 4–7% Maxus, Hongyan (IVECO JV legacy) China-dominant; aggressive export push to ASEAN and Europe
BYD Company 3–6% Electric buses, T-series electric trucks World's largest EV manufacturer; vertical battery integration
Traton Group 4–6% MAN, Scania, Navistar European heavy-duty strength; shared e-mobility platform
Isuzu Motors 3–5% N-Series, F-Series, Giga Light-to-medium-duty specialist; strong ASEAN market share
Hino Motors 2–4% Hino 500, 700 series; BEV prototypes Toyota group synergy; Japanese domestic and export focus
Ashok Leyland 2–4% BOSS, Captain, SWITCH electric buses India's second-largest CV maker; defense and municipal contracts


Recent News & Developments

  • Daimler Truck (October 2024): Launched the eActros 600 long-haul battery-electric truck with a 500 km range, signaling readiness for regional freight electrification in Europe [Ref 4].
  • BYD (August 2024): Opened a dedicated commercial EV assembly plant in Rayong, Thailand, with an annual capacity of 50,000 electric trucks and buses aimed at ASEAN and Australian markets [Ref 12].


  • European Commission (February 2024): Finalized the revised CO₂ standards for heavy-duty vehicles mandating a 90% reduction in fleet-average emissions by 2040 relative to 2019 levels [Ref 2].
  • PACCAR (November 2023): Began customer deliveries of the Kenworth T680E and Peterbilt 579EV battery-electric Class 8 tractors across California and Texas corridors [Ref 7].
  • Tata Motors (September 2023): Secured a 1,500-unit electric bus order from Bangalore Metropolitan Transport Corporation under the FAME II program, the largest single EV bus order in India at the time [Ref 13].
  • US Environmental Protection Agency (March 2024): Published Phase 3 Greenhouse Gas Emission Standards for heavy-duty vehicles, targeting a 46% reduction by model year 2032 [Ref 10].


Commercial Vehicle Market Report Scope

Parameter Detail
Market Scope Global commercial vehicle market covering trucks, buses, and vans across all weight classes and propulsion types
Study Period 2021–2035
CAGR 4.85% (2026–2035)
Base Year Market Size USD 1.02 Trillion (2025)
Forecast Market Size USD 1.64 Trillion (2035)
Fastest Growing Segment Hybrid and Electric Vehicles (9.08% CAGR)
Companies Profiled 10 (Daimler Truck, Volvo Group, PACCAR, Tata Motors, SAIC Motor, BYD, Traton Group, Isuzu Motors, Hino Motors, Ashok Leyland)
Valuation Currency USD (Billions)


FAQs

How do fleet operators evaluate lease-versus-buy decisions for electric commercial vehicles?

Most operators apply a total-cost-of-ownership model comparing upfront lease premiums against fuel and maintenance savings over a 5–7-year contract. Battery degradation warranties and residual-value guarantees from OEMs increasingly tip the equation toward leasing [Ref 19].

What role do telematics mandates play in raising barriers to entry for smaller truck OEMs?

Regulations in the EU and US now require real-time emission monitoring and electronic logging devices on all new commercial vehicles. Compliance demands significant software investment, favoring OEMs with established connected-vehicle platforms [Ref 20].

How are insurance costs evolving for zero-emission commercial fleets?

Insurers initially priced electric truck policies 15–25% above diesel equivalents due to high battery-replacement costs. Actuarial data from early adopters is now reducing that gap as claims experience shows lower fire and collision risk [Ref 5].

What cybersecurity risks emerge as commercial vehicles become software-defined platforms?

Over-the-air update channels and V2X communication modules create attack surfaces for fleet-level disruption. OEMs are adopting ISO/SAE 21434 automotive cybersecurity standards to mitigate these threats [Ref 14].

How do cross-border weight-limit differences affect the commercial vehicle market in ASEAN?

Gross vehicle weight limits vary from 36 tons in Thailand to 50 tons in Malaysia, forcing OEMs to maintain costly model variants. Harmonization talks under the ASEAN Framework Agreement on Goods could streamline this by 2029 [Ref 17].

What impact do driver shortage trends have on autonomous truck adoption timelines?

The American Trucking Associations estimates a shortage of 82,000 drivers in the US alone, creating economic urgency for autonomous solutions. This shortfall accelerates investment in Level 4 highway-pilot systems [Ref 7].

How is the secondary market for used commercial vehicles affected by emission regulations?

Tightening emission zones in Europe and India are compressing residual values for older diesel trucks. This pushes used inventory toward less-regulated markets in Africa and Central Asia [Ref 6].    
Author
Author
Author Profile
Triveni Bhoyar LinkedIn
Senior Research Analyst
Triveni Bhoyar has over 5 years of experience in the market research industry, specializing in the Automotive and Aerospace & Defense sectors. She has contributed to 200+ reports, including numerous custom projects for leading global companies, delivering solutions to complex business challenges. Renowned for her ability to generate valuable insights, Triveni excels in addressing unique market dynamics with precision and depth. Her expertise spans market sizing, competitive intelligence, and trend analysis, enabling clients to craft data-driven growth strategies. With strong analytical rigor and a client-centric approach, she plays a pivotal role in driving impactful, strategic decision-making.
Co-Author
Co-Author Profile
Aarti Dhapte LinkedIn
AVP - Research
A consulting professional focused on helping businesses navigate complex markets through structured research and strategic insights. I partner with clients to solve high-impact business problems across market entry strategy, competitive intelligence, and opportunity assessment. Over the course of my experience, I have led and contributed to 100+ market research and consulting engagements, delivering insights across multiple industries and geographies, and supporting strategic decisions linked to $500M+ market opportunities. My core expertise lies in building robust market sizing, forecasting, and commercial models (top-down and bottom-up), alongside deep-dive competitive and industry analysis. I have played a key role in shaping go-to-market strategies, investment cases, and growth roadmaps, enabling clients to make confident, data-backed decisions in dynamic markets.
Download Free Sample

Kindly complete the form below to receive a free sample of this Report

Download PDF ×

We do not share your information with anyone. However, we may send you emails based on your report interest from time to time. You may contact us at any time to opt-out.