SEGMENTATION QUICK REFERENCE
| Dimension | Sub-Segments | Dominant Segment | Fastest Growing Segment |
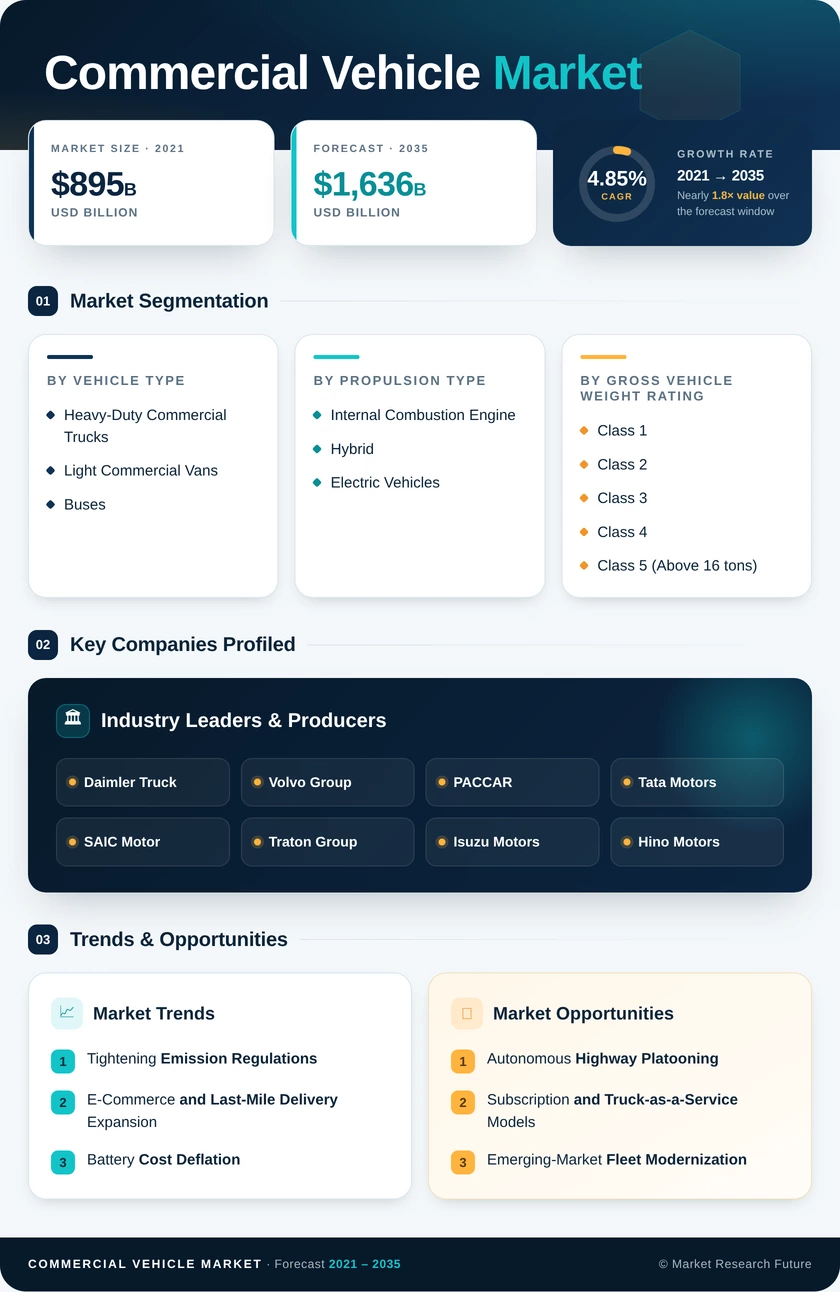
| Vehicle Type | Heavy-Duty Commercial Trucks, Light Commercial Vans, Buses | Heavy-Duty Commercial Trucks (45.5% share, 2025) | Light Commercial Vans (6.74% CAGR) |
| Propulsion Type | Internal Combustion Engine, Hybrid, and Electric Vehicles | Internal Combustion Engine (63.5% share, 2025) | Hybrid and Electric Vehicles (9.08% CAGR) |
| Gross Vehicle Weight Rating | Class 1, Class 2, Class 3, Class 4, Class 5 (Above 16 tons) | Class 5 — Above 16 tons (48.8% share, 2025) | Class 2 (7.78% CAGR) |
| End-Use Industry | Logistics and E-Commerce, Construction and Mining, Public Transit, Agriculture, Others | Logistics and E-Commerce (41.2% share, 2025) | Construction and Mining (6.28% CAGR) |
MARKET SEGMENTATION OVERVIEW
By Vehicle Type
| Sub-Segment | Key Trend |
| Heavy-Duty Commercial Trucks | Continued dominance driven by long-haul freight, infrastructure construction, and pre-buy cycles ahead of emission deadlines |
| Light Commercial Vans | Fastest growth segment propelled by e-commerce, last-mile delivery, and urban logistics platform expansion |
| Buses | Municipal transit electrification mandates accelerating fleet renewal in the EU, China, and India |
Heavy-duty commercial trucks anchor revenue across the global commercial vehicle industry, with demand tightly correlated to GDP growth, construction output, and intercity freight volumes. Light commercial vans are gaining share as parcel-delivery volumes surge and urban emission restrictions favor smaller, electrifiable platforms.
By Propulsion Type
| Sub-Segment | Key Trend |
| Internal Combustion Engine | Retains majority share in long-haul applications; gradual share erosion as total cost of ownership shifts |
| Hybrid and Electric Vehicles | Rapid adoption in urban and regional segments; OEM product portfolios expanding across all weight classes |
Diesel and natural-gas powertrains will continue to serve the bulk of heavy-duty long-haul operations through the early 2030s, but battery-electric and plug-in hybrid platforms are accelerating through medium-duty and urban-delivery applications where range requirements align with current battery capabilities.
By Gross Vehicle Weight Rating
| Sub-Segment | Key Trend |
| Class 1 (≤6,000 lbs) | Growing last-mile utility fleet segment with high electric-vehicle penetration potential |
| Class 2 (6,001–10,000 lbs) | Fastest growing weight class; core delivery-van and service-vehicle segment |
| Class 3 (10,001–14,000 lbs) | Regional distribution workhorses transitioning to electric and CNG options |
| Class 4 (14,001–16,000 lbs) | Medium-duty vocational segment with steady replacement demand |
| Class 5 (Above 16 tons) | Largest revenue segment; dominated by Class 8 tractors for over-the-road freight |
The heaviest weight categories account for the largest share of total revenue owing to high unit prices and long replacement cycles. Lighter classes, however, are growing faster as e-commerce logistics and service-fleet applications expand.
By End-Use Industry
| Sub-Segment | Key Trend |
| Logistics and E-Commerce | Dominant end-use; structural growth from parcel-volume expansion and same-day delivery commitments |
| Construction and Mining | Cyclical but resilient demand tied to sovereign infrastructure programs in the Asia-Pacific and MEA |
| Public Transit | Accelerating electric-bus adoption under clean-air mandates in 40+ countries |
| Agriculture | Mechanization-driven demand growth in developing economies; seasonal order patterns |
| Others (Defense, Utilities) | Specialized vocational segments with government-contract procurement cycles |
Logistics and e-commerce are the defining growth engines, with parcel volumes doubling over the past decade and delivery networks extending deeper into semi-urban and rural areas across emerging economies.