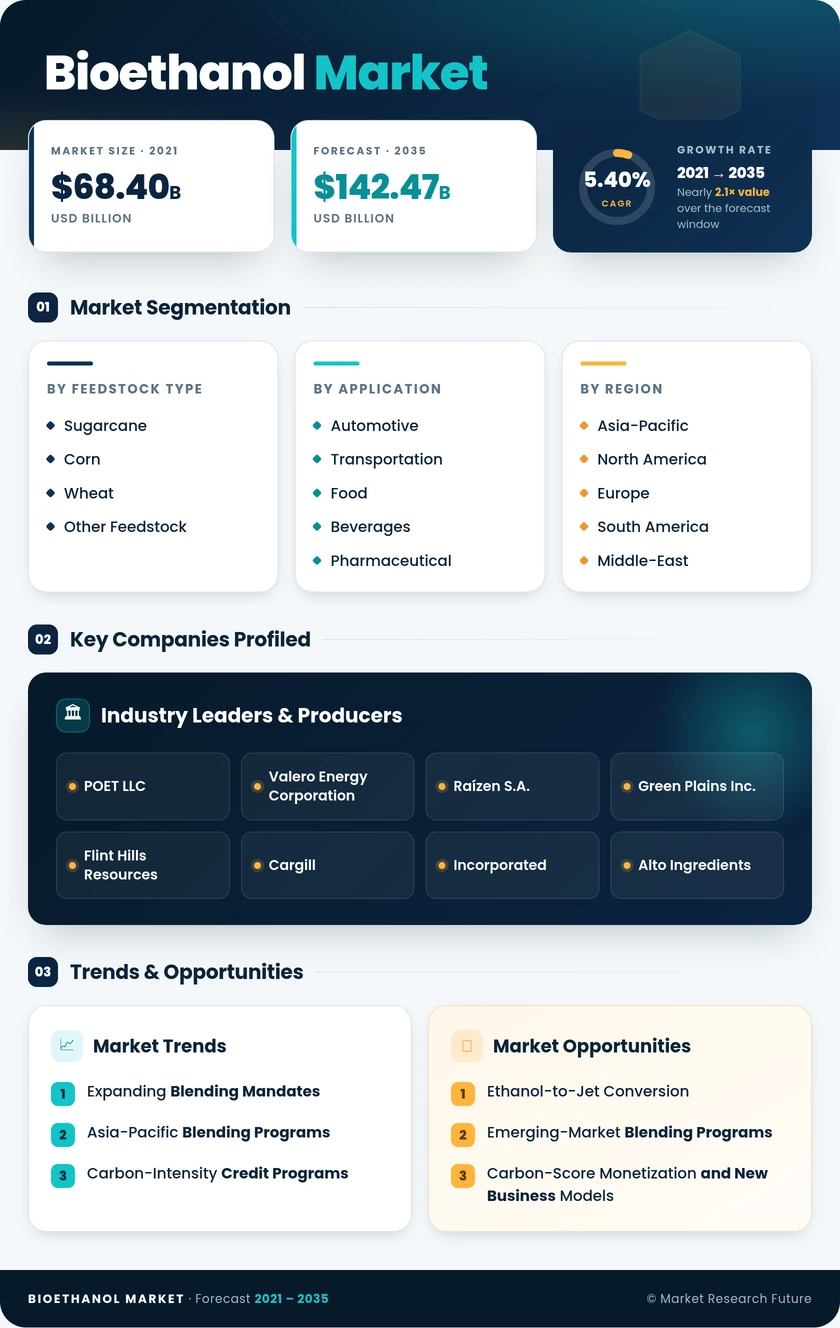
Bioethanol Market (2026 - 2035)

ID: MRFR/CnM/5710-CR 185 Pages Chitranshi Jaiswal Last Updated: October 19, 2026
Bioethanol Market Research Report Information By Feedstock Type (Sugarcane, Corn, Wheat, and Other Feedstock), and By Application (Automotive and Transportation, Food and Beverages, Pharmaceutical, Cosmetics and Personal Care, and Other Applications) – Forecast Till 2035
Bioethanol Market
Market Size
Forecast Period2026-2035
CAGR (2026-2035)5.40%
2025 Market SizeUSD 84.20 Billion
2035 Market SizeUSD 142.47 Billion
Key Players
POET LLC
Valero Energy Corporation
Raízen S.A.
Green Plains Inc.
Flint Hills Resources
Cargill
Opportunities
  • Ethanol-to-Jet Conversion
  • Emerging-Market Blending Programs
  • Carbon-Score Monetization and New Business Models
  1. 1 Market Summary | |
  2. 2 Key Report Takeaways | |
    1. 2.1 By Feedstock Type | |
    2. 2.2 By Application | |
    3. 2.3 By Region | |
  3. 3 Market Size and Forecast (2021–2035) | |
    1. 3.1 Historical Market Size (2021–2025) | |
    2. 3.2 Forecast Market Size (2026–2035) | |
  4. 4 Driver Impact Analysis | |
    1. 4.1 Expanding Blending Mandates | |
    2. 4.2 Asia-Pacific Blending Programs | |
    3. 4.3 Carbon-Intensity Credit Programs | |
    4. 4.4 Brazil Flex-Fuel Fleet and E30 | |
    5. 4.5 Octane Demand and Aromatics Substitution | |
    6. 4.6 Ethanol-to-Jet SAF Pathways | |
    7. 4.7 Co-Product Valorization | |
  5. 5 Restraints Impact Analysis | |
    1. 5.1 Electric Vehicle Adoption | |
    2. 5.2 Feedstock Price Volatility | |
    3. 5.3 Food-Versus-Fuel Policy Caps | |
    4. 5.4 Blend Wall and Retail Infrastructure Limits | |
    5. 5.5 Carbon Pipeline Permitting Delays | |
  6. 6 Opportunities | |
    1. 6.1 Ethanol-to-Jet Conversion | |
    2. 6.2 Emerging-Market Blending Programs | |
    3. 6.3 Carbon-Score Monetization and New Business Models | |
    4. 6.4 Second-Generation and Corn-Fiber Ethanol | |
    5. 6.5 High-Purity Industrial Grades | |
  7. 7 Regional Market Share and Country-Level Analysis | |
    1. 7.1 Asia-Pacific | | |
      1. 7.1.1 China | | |
      2. 7.1.2 India | | |
      3. 7.1.3 Japan | | |
      4. 7.1.4 Rest of Asia-Pacific | |
    2. 7.2 North America | | |
      1. 7.2.1 United States | | |
      2. 7.2.2 Canada | | |
      3. 7.2.3 Mexico | |
    3. 7.3 Europe | | |
      1. 7.3.1 Germany | | |
      2. 7.3.2 France | | |
      3. 7.3.3 United Kingdom | | |
      4. 7.3.4 Rest of Europe | |
    4. 7.4 South America | | |
      1. 7.4.1 Brazil | | |
      2. 7.4.2 Argentina | | |
      3. 7.4.3 Rest of South America | |
    5. 7.5 Middle East and Africa | | |
      1. 7.5.1 South Africa | | |
      2. 7.5.2 Saudi Arabia | | |
      3. 7.5.3 Rest of Middle East and Africa | |
  8. 8 Future Outlook (2026–2035) | |
    1. 8.1 Electrification Reshapes Demand Geography | |
    2. 8.2 Aviation Becomes a Premium Outlet | |
    3. 8.3 Carbon Management Defines Competitiveness | |
    4. 8.4 Digital Plant Optimization | |
  9. 9 Segmentation Analysis | |
    1. 9.1 By Feedstock Type | | |
      1. 9.1.1 Sugarcane | | |
      2. 9.1.2 Corn | | |
      3. 9.1.3 Wheat | | |
      4. 9.1.4 Other Feedstock | |
    2. 9.2 By Application | | |
      1. 9.2.1 Automotive and Transportation | | |
      2. 9.2.2 Food and Beverages | | |
      3. 9.2.3 Pharmaceutical | | |
      4. 9.2.4 Cosmetics and Personal Care | | |
      5. 9.2.5 Other Applications | |
  10. 10 Competitive Landscape | |
    1. 10.1 Market Concentration Analysis | |
    2. 10.2 Competitive Benchmarking Matrix | |
    3. 10.3 Company Profiles | | |
      1. 10.3.1 POET LLC | | |
      2. 10.3.2 Valero Energy Corporation | | |
      3. 10.3.3 Archer Daniels Midland Company | | |
      4. 10.3.4 Raízen S.A. | | |
      5. 10.3.5 Green Plains Inc. | | |
      6. 10.3.6 Flint Hills Resources | | |
      7. 10.3.7 Cargill, Incorporated | | |
      8. 10.3.8 Alto Ingredients, Inc. | | |
      9. 10.3.9 CropEnergies AG | | |
      10. 10.3.10 Tereos | |
  11. 11 Recent News & Developments | |
  12. 12 Report Scope and Methodology | |
  13. 13 Detailed Sources and Citations | |
  14. 14 Frequently Asked Questions (FAQs) | | LIST OF TABLES | |
  15. TABLE 1 Global Market Size & Forecast, by Value (USD Billion), 2021–2035 | |
  16. TABLE 2 Driver Impact Analysis, 2026–2035 | |
  17. TABLE 3 Restraints Impact Analysis, 2026–2035 | |
  18. TABLE 4 Regional Summary, by Region, 2025–2035 | |
  19. TABLE 5 Asia-Pacific Market, by Country, 2025–2035 | |
  20. TABLE 6 North America Market, by Country, 2025–2035 | |
  21. TABLE 7 Europe Market, by Country, 2025–2035 | |
  22. TABLE 8 South America Market, by Country, 2025–2035 | |
  23. TABLE 9 Middle East and Africa Market, by Country, 2025–2035 | |
  24. TABLE 10 Global Market, by Feedstock Type, 2025–2035 | |
  25. TABLE 11 Global Market, by Application, 2025–2035 | |
  26. TABLE 12 Competitive Benchmarking Matrix, 2025 | |
  27. TABLE 13 Report Scope and Methodology | |
  28. TABLE 14 Detailed Sources and Citations | | LIST OF FIGURES | |
  29. FIGURE 1 Market Dynamics Overview (Drivers, Restraints, Opportunities) | |
  30. FIGURE 2 Industry Value Chain Analysis | |
  31. FIGURE 3 Porter's Five Forces Analysis | |
  32. FIGURE 4 Global Market Size Trend (USD Billion), 2021–2035 | |
  33. FIGURE 5 Market Share, by Feedstock Type, 2025 | |
  34. FIGURE 6 Market Share, by Application, 2025 | |
  35. FIGURE 7 Regional Market Share, 2025 | |
  36. FIGURE 8 Country-Level Growth Comparison, 2026–2035 | |
  37. FIGURE 9 Competitive Landscape Positioning Matrix, 2025

Segmentation Quick Reference

DimensionSub-SegmentsDominant SegmentFastest Growing Segment
By Feedstock TypeSugarcane, Corn, Wheat, Other FeedstockCorn — 54.6% share (2025)Wheat — 5.80% CAGR (2026–2035)
By ApplicationAutomotive and Transportation, Food and Beverages, Pharmaceutical, Cosmetics and Personal Care, Other ApplicationsAutomotive and Transportation — 79.8% share (2025)Food and Beverages — 5.82% CAGR (2026–2035)
By RegionAsia-Pacific, North America, Europe, South America, Middle-East and AfricaNorth America — 48.0% share (2025)Asia-Pacific — 7.1% CAGR (2026–2035)


Market Segmentation Overview

By Feedstock Type

Sub-SegmentKey Trend
SugarcaneBagasse cogeneration and second-generation conversion
CornCarbon capture and high-protein feed co-products
WheatEuropean grain diversification and protein premiums
Other FeedstockCassava, molasses, and cellulosic pilots


Corn leads with a 54.6% share because U.S. and Brazilian dry mills pair low-cost grain with established rail logistics and valuable distillers' grains. Wheat grows fastest at a 5.80% CAGR as European producers turn domestic surpluses into ethanol while selling high-protein feed. Sugarcane keeps its cost edge through bagasse-fired power, and Other Feedstock expands where land-use rules favor residues.

By Application

Sub-SegmentKey Trend
Automotive and TransportationHigher blend mandates and octane substitution
Food and BeveragesPremium spirits and natural extracts
PharmaceuticalPharmacopeia-grade solvent demand
Cosmetics and Personal CareFragrance and sanitizer formulations
Other ApplicationsIndustrial solvents and ethanol-to-jet offtake


Automotive and Transportation dominates with a 79.8% share because blending mandates in the United States, Brazil, and the EU require refiners to use ethanol regardless of oil prices. Food and Beverages grows fastest at a 5.82% CAGR, as spirits makers and extract producers pay premiums for high-purity grades. Pharmaceutical and Cosmetics and Personal Care buyers value certified quality over price, giving producers steadier margins.




Download PDF ×

We do not share your information with anyone. However, we may send you emails based on your report interest from time to time. You may contact us at any time to opt-out.