• Cat-intel
  • MedIntelliX
  • Resources
  • About Us
  • Request Free Sample ×

    Kindly complete the form below to receive a free sample of this Report

    Leading companies partner with us for data-driven Insights

    clients tt-cursor

    Active Pharmaceutical Ingredients Market

    ID: MRFR/Pharma/0876-CR
    200 Pages
    Rahul Gotadki
    February 2021

    Active Pharmaceutical Ingredients Market Research Report By Type (Synthetic APIs, Biotech APIs, Natural APIs), By Formulation (Tablets, Injectables, Capsules, Others), By Therapeutic Area (Cardiovascular, Oncology, Diabetes, Psychiatry, Infectious Diseases), By Manufacturing Process (Batch Manufacturing, Continuous Manufacturing, Contract Manufacturing) and By Regional (North America, Europe, South America, Asia Pacific, Middle East and Africa) - Forecast to 2035

    Share:
    Download PDF ×

    We do not share your information with anyone. However, we may send you emails based on your report interest from time to time. You may contact us at any time to opt-out.

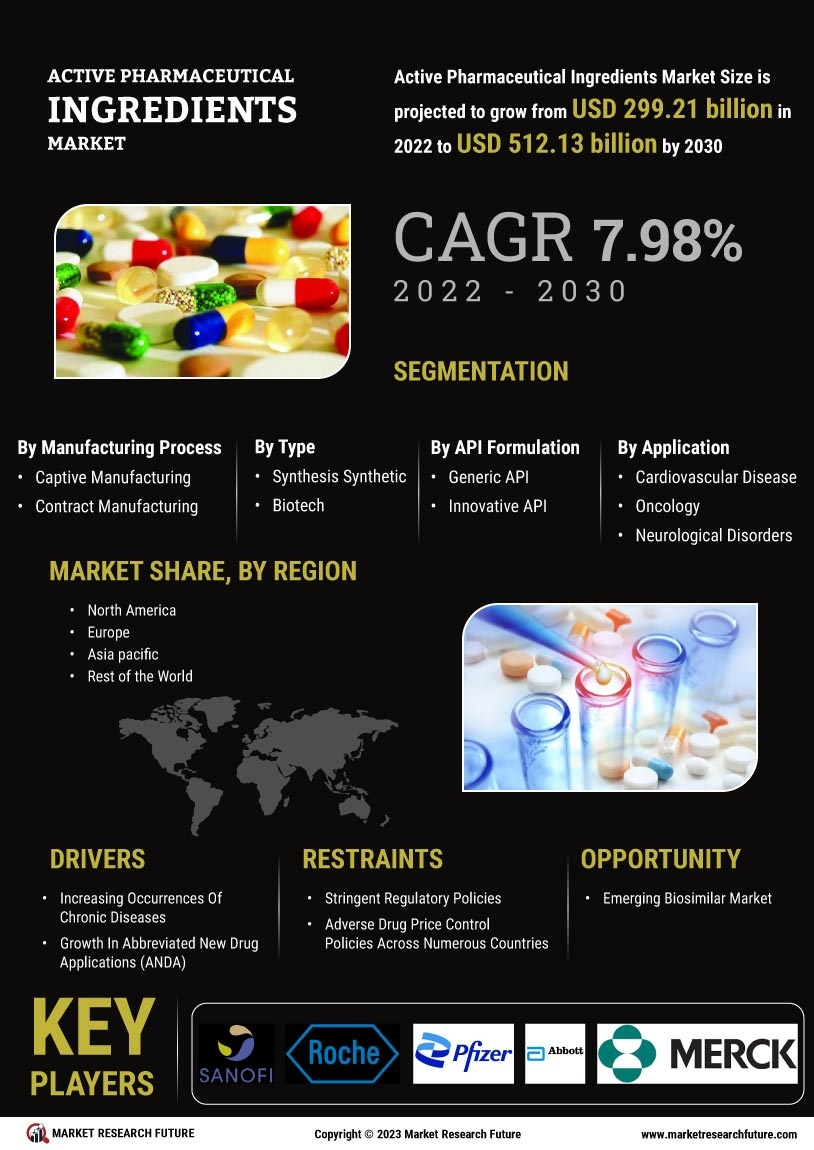
    Active Pharmaceutical Ingredients (API) Market Research Report - Forecast till 2035 Infographic
    Purchase Options
    $ 4,950.0
    $ 5,950.0
    $ 7,250.0
    Table of Contents

    Active Pharmaceutical Ingredients Market Summary

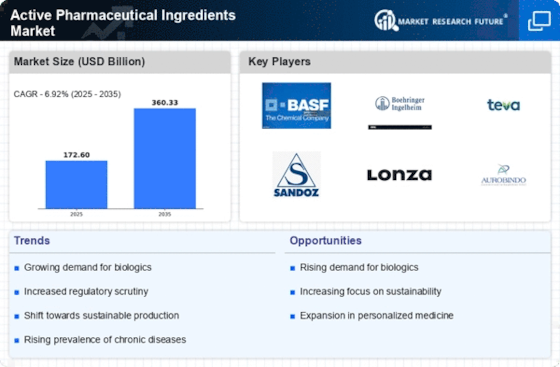
    As per Market Research Future Analysis, the Active Pharmaceutical Ingredients Market is projected to grow significantly, driven by increasing healthcare demands and advancements in biotechnology. The market is expected to reach 300.01 USD Billion by 2035, with a CAGR of 4.41% from 2025 to 2035. The rise in chronic diseases and the demand for generic drugs are key factors propelling this growth.

    Key Market Trends & Highlights

    The Global Active Pharmaceutical Ingredients market is shaped by several key trends.

    • Increasing prevalence of chronic diseases drives demand for innovative therapeutics.
    • The biopharmaceutical sector is expanding, creating opportunities for biologic APIs.
    • Sustainability trends are prompting manufacturers to adopt greener production methods.
    • Regulatory agencies emphasize quality assurance, pushing companies to enhance manufacturing processes.

    Market Size & Forecast

    2024 Market Size USD 187.25 Billion
    2025 Market Size USD 194.76 Billion
    2035 Market Size USD 300.01 Billion
    CAGR (2025-2035) 4.41%

    Major Players

    Key players include Lonza, Cambrex, Teva Pharmaceutical Industries, AbbVie, and Sandoz.

    Active Pharmaceutical Ingredients Market Trends

    Several key market drivers are presently driving significant growth in the Global Active Pharmaceutical Ingredients (API) Market. The growing demand for generic medications is one of the primary factors, as they are regarded as cost-effective alternatives to branded pharmaceuticals. The global expansion of manufacturing capabilities has been facilitated by this transition, which has incentivized numerous pharmaceutical companies to invest in the production of APIs. Furthermore, the healthcare system is experiencing an ongoing demand for new and efficient APIs due to the increasing prevalence of chronic diseases and the geriatric population, which is driving research and development.

    Advancements in biotechnology and personalized medicine have created opportunities for the development of personalized therapeutic solutions in the global API market. Biosimilars, which are biologic medical products that are highly similar to previously approved reference products, are receiving more attention. API manufacturers have the opportunity to diversify their portfolios and address the changing requirements of healthcare providers and patients as a result of this trend. Additionally, there has been an increasing emphasis on the development of environmentally favorable and sustainable manufacturing processes for APIs in recent years.

    Companies are increasingly implementing green chemistry principles, which aim to mitigate waste and reduce the environmental consequences of production processes.This change is particularly relevant in regions where environmental regulations are becoming more stringent and is in accordance with global sustainability objectives. Furthermore, the pharmaceutical industry's digital transformation is transforming the development, manufacturing, and distribution of APIs, resulting in a more efficient and agile supply chain framework. In general, these trends and drivers underscore a dynamic landscape in the Active Pharmaceutical Ingredients Market, which offers both opportunities and challenges to industry participants.

    Source: Primary Research, Secondary Research, Market Research Future Database, and Analyst Review

    The Global Active Pharmaceutical Ingredients Market is poised for robust growth, driven by increasing demand for generic drugs and a rising focus on biopharmaceuticals, which may reshape the landscape of pharmaceutical manufacturing.

    U.S. Food and Drug Administration (FDA)

    Active Pharmaceutical Ingredients Market Drivers

    Market Growth Projections

    Rising Demand for Generic Drugs

    The Global Active Pharmaceutical Ingredients Market Industry experiences a notable surge in demand for generic drugs, driven by the expiration of patents for numerous blockbuster medications. As patents expire, generic alternatives become more accessible, leading to increased consumption. In 2024, the market is valued at approximately 187.2 USD Billion, reflecting the growing preference for cost-effective treatment options. This trend is expected to continue, with the market projected to reach 300.0 USD Billion by 2035, indicating a robust growth trajectory. The increasing focus on affordable healthcare solutions is likely to further propel the demand for active pharmaceutical ingredients in the generic sector.

    Increasing Investment in Pharmaceutical R&D

    Investment in pharmaceutical research and development is a key driver of the Global Active Pharmaceutical Ingredients Market Industry. As companies strive to innovate and develop new therapies, the demand for high-quality active pharmaceutical ingredients rises correspondingly. In 2024, the market is valued at 187.2 USD Billion, with expectations of reaching 300.0 USD Billion by 2035. This growth is indicative of the industry's commitment to addressing unmet medical needs and advancing healthcare solutions. Furthermore, the increasing collaboration between pharmaceutical companies and research institutions is likely to enhance the pipeline of new drugs, thereby driving the demand for APIs.

    Regulatory Compliance and Quality Standards

    Regulatory compliance and adherence to quality standards are critical factors influencing the Global Active Pharmaceutical Ingredients Market Industry. Stringent regulations imposed by health authorities necessitate that manufacturers maintain high-quality production processes. This focus on compliance not only ensures patient safety but also enhances the credibility of pharmaceutical products in the market. As the industry evolves, companies are increasingly investing in quality assurance measures to meet these regulatory requirements. The emphasis on quality is expected to drive market growth, as consumers and healthcare providers prioritize safety and efficacy in their pharmaceutical choices.

    Technological Advancements in API Production

    Technological innovations in the production of active pharmaceutical ingredients are transforming the Global Active Pharmaceutical Ingredients Market Industry. Advanced manufacturing techniques, such as continuous flow processing and biocatalysis, enhance efficiency and reduce production costs. These innovations not only improve yield but also ensure higher quality standards, which are critical in the pharmaceutical sector. As companies adopt these technologies, they can respond more effectively to market demands. The anticipated compound annual growth rate of 4.38% from 2025 to 2035 suggests that these advancements will play a pivotal role in shaping the future landscape of the industry.

    Global Health Initiatives and Access to Medicines

    Global health initiatives aimed at improving access to medicines significantly impact the Global Active Pharmaceutical Ingredients Market Industry. Organizations and governments are increasingly focused on enhancing healthcare accessibility, particularly in low- and middle-income countries. These initiatives often involve partnerships with pharmaceutical companies to ensure the availability of essential medicines. As a result, the demand for active pharmaceutical ingredients is likely to rise, driven by the need for affordable and effective treatments. The ongoing commitment to global health is expected to sustain market growth, with projections indicating a market value of 300.0 USD Billion by 2035.

    Market Segment Insights

    Active Pharmaceutical Ingredients Market Type Insights

    The Active Pharmaceutical Ingredients Market exhibits significant growth across its various types, namely Synthetic APIs, Biotech APIs, and Natural APIs, contributing to the overall market dynamics. In 2024, the market is valued at 187.25 USD billion, with the different types showcasing distinctive valuations that highlight their respective roles. The Synthetic APIs segment stands out, holding a majority share valued at 90.0 USD billion, and is projected to increase to 140.0 USD billion by 2035.

    The robustness of this segment can be attributed to the prevalent use of synthetic compounds in pharmaceuticals due to their cost-effectiveness and scalability in production, thus catering to a wide range of therapeutic areas.On the contrary, Biotech APIs, valued at 60.0 USD Billion in 2024 and expected to expand to 100.0 USD Billion by 2035, signify a remarkable shift towards biologics driven by advancements in biotechnology. This segment is crucial as it supports the development of innovative therapies, particularly for chronic diseases, and poses significant opportunities for market players exploring genetic engineering and monoclonal antibody technologies.

    Meanwhile, the Natural APIs segment, although comparatively smaller with a valuation of 37.25 USD Billion in 2024 and projected to grow to 60.0 USD Billion by 2035, underscores the increasing consumer preference for natural products.This segment appeals to the growing trend towards alternative medicine and natural therapeutics, marking its relevance in the Active Pharmaceutical Ingredients Market. The interplay of these segments reflects an evolving landscape influenced by technological advancements, regulatory changes, and shifts in consumer preferences, presenting both challenges and opportunities in the market growth trajectory.

    Source: Primary Research, Secondary Research, Market Research Future Database, and Analyst Review

    Active Pharmaceutical Ingredients Market Formulation Insights

    The Active Pharmaceutical Ingredients Market, particularly in the formulation segment, is witnessing significant developments and growth due to the increasing demand for advanced pharmaceuticals. By 2024, the market is projected to be valued at 187.25 USD Billion, demonstrating the critical role that formulations play in delivering therapeutic benefits effectively. Within this segment, various forms, including tablets, injectables, capsules, and others, are pivotal in treating diverse medical conditions. Tablets, as a widely used dosage form, allow ease of administration and cost-effectiveness.

    At the same time, injectables are vital for delivering drugs directly into the bloodstream, often resulting in quicker therapeutic effects.Capsules offer advantages in terms of ease of swallowing and targeted drug release, catering to patient preferences. The growth of the Active Pharmaceutical Ingredients Market revenue is driven by factors such as rising healthcare expenditures, innovative drug delivery systems, and an aging population necessitating effective treatment options. However, the market also faces challenges such as stringent regulatory requirements and competition from generic drugs.

    Nevertheless, opportunities in personalized medicine and biopharmaceuticals are expected to propel the market growth further, enhancing the global implications of this crucial sector in pharmaceuticals.

    Active Pharmaceutical Ingredients Market Therapeutic Area Insights

    The Active Pharmaceutical Ingredients Market, particularly within the Therapeutic Area segment, is poised for notable growth, reflecting the increasing demand for essential medications and treatments. By 2024, the overall market is expected to achieve a valuation of 187.25 USD Billion, indicating robust expansion in various therapeutic sectors. Cardiovascular and Oncology remain pivotal in this landscape due to the rising prevalence of heart-related ailments and cancer globally.

    Diabetes management also plays a crucial role, with a continuing surge in diabetic cases prompting advancements in pharmaceutical solutions.Psychiatric conditions are receiving growing attention, highlighting the need for effective treatments, while Infectious Diseases remain a critical focus, especially in the wake of global health challenges. The diversification within the Active Pharmaceutical Ingredients Market data illustrates the significance of these therapeutic areas, presenting opportunities for innovation and enhanced patient care.

    Furthermore, market growth is propelled by factors such as the increasing aging population, advancements in Research and Development, and rising healthcare expenditures.However, challenges such as regulatory hurdles and pricing pressures may influence market dynamics moving forward.

    Active Pharmaceutical Ingredients Market Manufacturing Process Insights

    The Active Pharmaceutical Ingredients Market is experiencing notable growth, with a projected valuation of 187.25 billion USD by 2024. Within the Manufacturing Process segment, the market encompasses various methods, including Batch Manufacturing, Continuous Manufacturing, and Contract Manufacturing. Batch Manufacturing is recognized for its flexibility and is commonly used for producing smaller amounts of products, enabling quick adjustments to formulation and quality, which is crucial for meeting specific regulatory standards.

    Continuous Manufacturing, on the other hand, is gaining traction as a transformative approach that enhances efficiency, reducing production times and costs while ensuring consistent product quality.Contract Manufacturing services are significant as they provide pharmaceutical companies with the expertise and capabilities needed to produce active pharmaceutical ingredients, allowing for a focus on Research and Development without investing heavily in manufacturing infrastructure. The Active Pharmaceutical Ingredients Market segmentation reflects a dynamic landscape driven by advancements in technology and increasing demand for cost-effective production methods, all while adhering to stringent regulatory norms, ultimately contributing to the overall market growth.

    Get more detailed insights about Active Pharmaceutical Ingredients (API) Market Research Report - Forecast till 2035

    Regional Insights

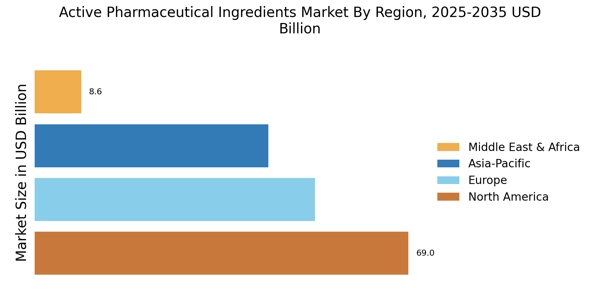
    The Active Pharmaceutical Ingredients Market exhibits significant regional variations, reflecting diverse pharmaceutical needs and market dynamics. In 2024, North America leads with a market valuation of 75.0 USD Billion, accounting for a substantial share of the industry's revenue due to its advanced pharmaceutical infrastructure and ongoing Research and Development initiatives. Europe follows with a market valuation of 45.0 USD billion, driven by stringent regulatory frameworks and a robust demand for generic drugs.

    The Asia Pacific region, valued at 42.0 USD Billion, is rapidly growing, fueled by an increasing population and healthcare expenditure.South America is valued at 13.5 USD Billion, offering growth opportunities with rising investments in pharmaceutical manufacturing. The Middle East and Africa, while the smallest segment at 11.75 USD Billion, are gradually evolving, propelled by improved healthcare access and government initiatives to boost local manufacturing capabilities. These dynamics contribute to the overall Active Pharmaceutical Ingredients Market revenue, with each region playing a crucial role in shaping market trends and fostering opportunities for growth.

    Active Pharmaceutical Ingredients Market Regional Insights

    Source: Primary Research, Secondary Research, Market Research Future Database, and Analyst Review

    Key Players and Competitive Insights

    The Active Pharmaceutical Ingredients Market is characterized by a dynamic competitive landscape driven by the rising demand for pharmaceuticals and the evolution of production technologies. With an increasing focus on the quality and efficacy of pharmaceuticals, companies within this market are constantly innovating and optimizing their manufacturing processes. Factors such as regulatory compliance, supply chain management, and market accessibility play a crucial role in shaping competitive strategies. Furthermore, collaborations and partnerships among key players are becoming more prevalent as firms seek to enhance their product offerings and expand their geographical reach.

    As the market continues to evolve, industry participants are required to stay attuned to changing consumer needs and technological advancements to maintain a competitive edge.Wockhardt has established itself as a formidable player in the Active Pharmaceutical Ingredients Market through its commitment to quality and innovation. The company is known for its strong manufacturing capabilities and substantial investments in R&D, enabling it to produce a diverse range of active pharmaceutical ingredients. Wockhardt's strategic focus on therapeutic areas such as cardiology, diabetes, and antibiotics has granted it a robust portfolio, facilitating a significant market presence.

    The company's adherence to stringent quality standards and regulatory compliance has bolstered its reputation, allowing it to form strategic alliances and foster relationships with multiple stakeholders in the healthcare sector. Wockhardt's strengths lie in its cost-effective production capabilities and a strong distribution network that enhances its ability to meet global demands efficiently.Novartis, a key player in the Active Pharmaceutical Ingredients Market, showcases a wide array of strengths and market presence that contribute to its competitive advantage.

    As a leading global healthcare company, Novartis is dedicated to the research and development of innovative medicines and has a strong portfolio of key products spanning various therapeutic areas, including oncology, ophthalmology, and neurology. The company's active engagement in mergers and acquisitions has enhanced its market position, enabling Novartis to diversify its product offerings and leverage cutting-edge technologies. Its strong focus on sustainable practices, regulatory compliance, and patient-centric solutions underscores its commitment to excellence in the field.

    With a strategically oriented global presence, Novartis effectively navigates regional market dynamics while providing a comprehensive range of active pharmaceutical ingredients catering to different markets, thus solidifying its standing as a leader in the sector.

    Key Companies in the Active Pharmaceutical Ingredients Market market include

    Industry Developments

    Future Outlook

    Active Pharmaceutical Ingredients Market Future Outlook

    The Active Pharmaceutical Ingredients Market is projected to grow at a 4.38% CAGR from 2024 to 2035, driven by increasing demand for generic drugs, biopharmaceutical innovations, and regulatory advancements.

    New opportunities lie in:

    • Invest in advanced manufacturing technologies to enhance production efficiency and reduce costs.
    • Develop partnerships with biotech firms to expand the portfolio of complex APIs.
    • Focus on sustainable sourcing and green chemistry practices to meet regulatory demands.

    By 2035, the Active Pharmaceutical Ingredients Market is expected to achieve robust growth, reflecting evolving industry dynamics and increased global health demands.

    Market Segmentation

    Active Pharmaceutical Ingredients Market Type Outlook

    • Synthetic APIs
    • Biotech APIs
    • Natural APIs

    Active Pharmaceutical Ingredients Market Regional Outlook

    • North America
    • Europe
    • South America
    • Asia Pacific
    • Middle East and Africa

    Active Pharmaceutical Ingredients Market Formulation Outlook

    • Tablets
    • Injectables
    • Capsules
    • Others

    Active Pharmaceutical Ingredients Market Therapeutic Area Outlook

    • Cardiovascular
    • Oncology
    • Diabetes
    • Psychiatry
    • Infectious Diseases

    Active Pharmaceutical Ingredients Market Manufacturing Process Outlook

    • Batch Manufacturing
    • Continuous Manufacturing
    • Contract Manufacturing

    Report Scope

    Report Attribute/Metric

    Details

    Market Size 2023

    180.03(USD Billion)

    Market Size 2024

    187.25(USD Billion)

    Market Size 2035

    300.01 (USD Billion)

    Compound Annual Growth Rate (CAGR)

    4.41% (2025 - 2035)

    Report Coverage

    Revenue Forecast, Competitive Landscape, Growth Factors, and Trends

    Base Year

    2024

    Market Forecast Period

    2025 - 2035

    Historical Data

    2019 - 2024

    Market Forecast Units

    USD Billion

    Key Companies Profiled

    Wockhardt, Novartis, Dr. Reddy's Laboratories, Teva Pharmaceutical Industries, Fujifilm Diosynth Biotechnologies, Aurobindo Pharma, Sun Pharmaceutical Industries, Boehringer Ingelheim, Hikma Pharmaceuticals, Siegfried Holding, Lonza Group, BASF

    Segments Covered

    Type, Formulation, Therapeutic Area, Manufacturing Process, Regional

    Key Market Opportunities

    Growing biologics sector, Increased demand for generics, Expansion in emerging markets, Rise of personalized medicine, Advancements in manufacturing technologies

    Key Market Dynamics

    supply chain disruptions, increasing chronic diseases, patent expirations, regulatory compliance, and rising generic drug demand

    Countries Covered

    North America, Europe, APAC, South America, MEA

    Market Highlights

    Author
    Rahul Gotadki
    Assistant Manager

    He holds an experience of about 7+ years in Market Research and Business Consulting, working under the spectrum of Life Sciences and Healthcare domains. Rahul conceptualizes and implements a scalable business strategy and provides strategic leadership to the clients. His expertise lies in market estimation, competitive intelligence, pipeline analysis, customer assessment, etc. In addition to the above, his other responsibility includes strategic tracking of high growth markets & advising clients on the potential areas of focus they could direct their business initiatives

    Leave a Comment

    FAQs

    What is the projected market size of the Active Pharmaceutical Ingredients Market in 2024?

    The Active Pharmaceutical Ingredients Market is projected to be valued at 187.25 billion USD in 2024.

    What are the expected market values for Synthetic APIs in 2035?

    In 2035, the market value for Synthetic APIs is expected to reach 140.0 billion USD.

    Which region is expected to dominate the Active Pharmaceutical Ingredients Market in 2024?

    North America is expected to dominate the market with a value of 75.0 billion USD in 2024.

    What is the projected compound annual growth rate (CAGR) for the Active Pharmaceutical Ingredients Market from 2025 to 2035?

    The market is expected to grow at a CAGR of 4.41% from 2025 to 2035.

    What will be the market value for Biotech APIs in 2024?

    The market value for Biotech APIs is projected to be 60.0 billion USD in 2024.

    Which key players are leading the Active Pharmaceutical Ingredients Market?

    Major players in the market include Wockhardt, Novartis, Dr. Reddy's Laboratories, and Teva Pharmaceutical Industries.

    What is the expected market size for the Asia Pacific region by 2035?

    The Asia Pacific region is expected to reach a market size of 75.0 billion USD by 2035.

    What will be the overall market size of the Active Pharmaceutical Ingredients Market in 2035?

    The overall market is expected to be valued at 300.01 billion USD by 2035.

    What is the market value for Natural APIs in 2035?

    The market value for Natural APIs is anticipated to reach 60.0 billion USD in 2035.

    How much is the South America market expected to grow from 2024 to 2035?

    The South America market is projected to grow from 13.5 billion USD in 2024 to 20.0 billion USD in 2035.

    1. EXECUTIVE
    2. SUMMARY
    3. Market Overview
    4. Key Findings
    5. Market Segmentation
    6. Competitive Landscape
    7. Challenges and Opportunities
    8. Future Outlook
    9. MARKET INTRODUCTION
    10. Definition
    11. Scope of the study
    12. Research Objective
    13. Assumption
    14. Limitations
    15. RESEARCH
    16. METHODOLOGY
    17. Overview
    18. Data
    19. Mining
    20. Secondary Research
    21. Primary
    22. Research
    23. Primary Interviews and Information Gathering
    24. Process
    25. Breakdown of Primary Respondents
    26. Forecasting
    27. Model
    28. Market Size Estimation
    29. Bottom-Up
    30. Approach
    31. Top-Down Approach
    32. Data
    33. Triangulation
    34. Validation
    35. MARKET
    36. DYNAMICS
    37. Overview
    38. Drivers
    39. Restraints
    40. Opportunities
    41. MARKET FACTOR ANALYSIS
    42. Value chain Analysis
    43. Porter's
    44. Five Forces Analysis
    45. Bargaining Power of Suppliers
    46. Bargaining
    47. Power of Buyers
    48. Threat of New Entrants
    49. Threat
    50. of Substitutes
    51. Intensity of Rivalry
    52. COVID-19
    53. Impact Analysis
    54. Market Impact Analysis
    55. Regional
    56. Impact
    57. Opportunity and Threat Analysis
    58. Active
    59. Pharmaceutical Ingredients Market, BY Type (USD Billion)
    60. Synthetic
    61. APIs
    62. Biotech APIs
    63. Natural
    64. APIs
    65. Active Pharmaceutical
    66. Ingredients Market, BY Formulation (USD Billion)
    67. Injectables
    68. Capsules
    69. Others
    70. Active
    71. Pharmaceutical Ingredients Market, BY Therapeutic Area (USD Billion)
    72. Cardiovascular
    73. Oncology
    74. Diabetes
    75. Psychiatry
    76. Infectious
    77. Diseases
    78. Active Pharmaceutical
    79. Ingredients Market, BY Manufacturing Process (USD Billion)
    80. Batch
    81. Manufacturing
    82. Continuous Manufacturing
    83. Contract
    84. Manufacturing
    85. Active Pharmaceutical
    86. Ingredients Market, BY Regional (USD Billion)
    87. North
    88. America
    89. US
    90. Canada
    91. Europe
    92. Germany
    93. UK
    94. France
    95. Russia
    96. Italy
    97. Spain
    98. Rest
    99. of Europe
    100. APAC
    101. China
    102. India
    103. Japan
    104. South
    105. Korea
    106. Malaysia
    107. Thailand
    108. Indonesia
    109. Rest
    110. of APAC
    111. South America
    112. Brazil
    113. Mexico
    114. Argentina
    115. Rest
    116. of South America
    117. MEA
    118. GCC
    119. Countries
    120. South Africa
    121. Rest
    122. of MEA
    123. Competitive Landscape
    124. Overview
    125. Competitive
    126. Analysis
    127. Market share Analysis
    128. Major
    129. Growth Strategy in the Active Pharmaceutical Ingredients Market
    130. Competitive
    131. Benchmarking
    132. Leading Players in Terms of Number of Developments
    133. in the Active Pharmaceutical Ingredients Market
    134. Key developments
    135. and growth strategies
    136. New Product Launch/Service Deployment
    137. Merger
    138. & Acquisitions
    139. Joint Ventures
    140. Major
    141. Players Financial Matrix
    142. Sales and Operating Income
    143. Major
    144. Players R&D Expenditure. 2023
    145. Company
    146. Profiles
    147. Lonza
    148. Financial
    149. Overview
    150. Products Offered
    151. Key
    152. Developments
    153. SWOT Analysis
    154. Key
    155. Strategies
    156. Cambrex
    157. Financial
    158. Overview
    159. Products Offered
    160. Key
    161. Developments
    162. SWOT Analysis
    163. Key
    164. Strategies
    165. Zhejiang Hisun Pharmaceutical
    166. Financial
    167. Overview
    168. Products Offered
    169. Key
    170. Developments
    171. SWOT Analysis
    172. Key
    173. Strategies
    174. Sandoz
    175. Financial
    176. Overview
    177. Products Offered
    178. Key
    179. Developments
    180. SWOT Analysis
    181. Key
    182. Strategies
    183. AbbVie
    184. Financial
    185. Overview
    186. Products Offered
    187. Key
    188. Developments
    189. SWOT Analysis
    190. Key
    191. Strategies
    192. Boehringer Ingelheim
    193. Financial
    194. Overview
    195. Products Offered
    196. Key
    197. Developments
    198. SWOT Analysis
    199. Key
    200. Strategies
    201. Teva Pharmaceutical Industries
    202. Financial
    203. Overview
    204. Products Offered
    205. Key
    206. Developments
    207. SWOT Analysis
    208. Key
    209. Strategies
    210. Fujifilm Diosynth Biotechnologies
    211. Financial
    212. Overview
    213. Products Offered
    214. Key
    215. Developments
    216. SWOT Analysis
    217. Key
    218. Strategies
    219. Hikma Pharmaceuticals
    220. Financial
    221. Overview
    222. Products Offered
    223. Key
    224. Developments
    225. SWOT Analysis
    226. Key
    227. Strategies
    228. Mylan
    229. Financial
    230. Overview
    231. Products Offered
    232. Key
    233. Developments
    234. SWOT Analysis
    235. Key
    236. Strategies
    237. BASF
    238. Financial
    239. Overview
    240. Products Offered
    241. Key
    242. Developments
    243. SWOT Analysis
    244. Key
    245. Strategies
    246. Catalent
    247. Financial
    248. Overview
    249. Products Offered
    250. Key
    251. Developments
    252. SWOT Analysis
    253. Key
    254. Strategies
    255. Aurobindo Pharma
    256. Financial
    257. Overview
    258. Products Offered
    259. Key
    260. Developments
    261. SWOT Analysis
    262. Key
    263. Strategies
    264. Dr. Reddy's Laboratories
    265. Financial
    266. Overview
    267. Products Offered
    268. Key
    269. Developments
    270. SWOT Analysis
    271. Key
    272. Strategies
    273. WuXi AppTec
    274. Financial
    275. Overview
    276. Products Offered
    277. Key
    278. Developments
    279. SWOT Analysis
    280. Key
    281. Strategies
    282. References
    283. Related
    284. Reports
    285. LIST
    286. OF ASSUMPTIONS
    287. North America Active Pharmaceutical Ingredients
    288. Market SIZE ESTIMATES & FORECAST, BY TYPE, 2019-2035 (USD Billions)
    289. North
    290. America Active Pharmaceutical Ingredients Market SIZE ESTIMATES & FORECAST,
    291. BY FORMULATION, 2019-2035 (USD Billions)
    292. North America
    293. Active Pharmaceutical Ingredients Market SIZE ESTIMATES & FORECAST, BY THERAPEUTIC
    294. AREA, 2019-2035 (USD Billions)
    295. North America Active Pharmaceutical
    296. Ingredients Market SIZE ESTIMATES & FORECAST, BY MANUFACTURING PROCESS, 2019-2035
    297. (USD Billions)
    298. North America Active Pharmaceutical Ingredients
    299. Market SIZE ESTIMATES & FORECAST, BY REGIONAL, 2019-2035 (USD Billions)
    300. US
    301. Active Pharmaceutical Ingredients Market SIZE ESTIMATES & FORECAST, BY TYPE,
    302. 2035 (USD Billions)
    303. US Active Pharmaceutical Ingredients
    304. Market SIZE ESTIMATES & FORECAST, BY FORMULATION, 2019-2035 (USD Billions)
    305. US
    306. Active Pharmaceutical Ingredients Market SIZE ESTIMATES & FORECAST, BY THERAPEUTIC
    307. AREA, 2019-2035 (USD Billions)
    308. US Active Pharmaceutical
    309. Ingredients Market SIZE ESTIMATES & FORECAST, BY MANUFACTURING PROCESS, 2019-2035
    310. (USD Billions)
    311. US Active Pharmaceutical Ingredients Market
    312. SIZE ESTIMATES & FORECAST, BY REGIONAL, 2019-2035 (USD Billions)
    313. Canada
    314. Active Pharmaceutical Ingredients Market SIZE ESTIMATES & FORECAST, BY TYPE,
    315. 2035 (USD Billions)
    316. Canada Active Pharmaceutical
    317. Ingredients Market SIZE ESTIMATES & FORECAST, BY FORMULATION, 2019-2035 (USD
    318. Billions)
    319. Canada Active Pharmaceutical Ingredients Market
    320. SIZE ESTIMATES & FORECAST, BY THERAPEUTIC AREA, 2019-2035 (USD Billions)
    321. Canada
    322. Active Pharmaceutical Ingredients Market SIZE ESTIMATES & FORECAST, BY MANUFACTURING
    323. PROCESS, 2019-2035 (USD Billions)
    324. Canada Active Pharmaceutical
    325. Ingredients Market SIZE ESTIMATES & FORECAST, BY REGIONAL, 2019-2035 (USD Billions)
    326. Europe
    327. Active Pharmaceutical Ingredients Market SIZE ESTIMATES & FORECAST, BY TYPE,
    328. 2035 (USD Billions)
    329. Europe Active Pharmaceutical
    330. Ingredients Market SIZE ESTIMATES & FORECAST, BY FORMULATION, 2019-2035 (USD
    331. Billions)
    332. Europe Active Pharmaceutical Ingredients Market
    333. SIZE ESTIMATES & FORECAST, BY THERAPEUTIC AREA, 2019-2035 (USD Billions)
    334. Europe
    335. Active Pharmaceutical Ingredients Market SIZE ESTIMATES & FORECAST, BY MANUFACTURING
    336. PROCESS, 2019-2035 (USD Billions)
    337. Europe Active Pharmaceutical
    338. Ingredients Market SIZE ESTIMATES & FORECAST, BY REGIONAL, 2019-2035 (USD Billions)
    339. Germany
    340. Active Pharmaceutical Ingredients Market SIZE ESTIMATES & FORECAST, BY TYPE,
    341. 2035 (USD Billions)
    342. Germany Active Pharmaceutical
    343. Ingredients Market SIZE ESTIMATES & FORECAST, BY FORMULATION, 2019-2035 (USD
    344. Billions)
    345. Germany Active Pharmaceutical Ingredients Market
    346. SIZE ESTIMATES & FORECAST, BY THERAPEUTIC AREA, 2019-2035 (USD Billions)
    347. Germany
    348. Active Pharmaceutical Ingredients Market SIZE ESTIMATES & FORECAST, BY MANUFACTURING
    349. PROCESS, 2019-2035 (USD Billions)
    350. Germany Active Pharmaceutical
    351. Ingredients Market SIZE ESTIMATES & FORECAST, BY REGIONAL, 2019-2035 (USD Billions)
    352. UK
    353. Active Pharmaceutical Ingredients Market SIZE ESTIMATES & FORECAST, BY TYPE,
    354. 2035 (USD Billions)
    355. UK Active Pharmaceutical Ingredients
    356. Market SIZE ESTIMATES & FORECAST, BY FORMULATION, 2019-2035 (USD Billions)
    357. UK
    358. Active Pharmaceutical Ingredients Market SIZE ESTIMATES & FORECAST, BY THERAPEUTIC
    359. AREA, 2019-2035 (USD Billions)
    360. UK Active Pharmaceutical
    361. Ingredients Market SIZE ESTIMATES & FORECAST, BY MANUFACTURING PROCESS, 2019-2035
    362. (USD Billions)
    363. UK Active Pharmaceutical Ingredients Market
    364. SIZE ESTIMATES & FORECAST, BY REGIONAL, 2019-2035 (USD Billions)
    365. France
    366. Active Pharmaceutical Ingredients Market SIZE ESTIMATES & FORECAST, BY TYPE,
    367. 2035 (USD Billions)
    368. France Active Pharmaceutical
    369. Ingredients Market SIZE ESTIMATES & FORECAST, BY FORMULATION, 2019-2035 (USD
    370. Billions)
    371. France Active Pharmaceutical Ingredients Market
    372. SIZE ESTIMATES & FORECAST, BY THERAPEUTIC AREA, 2019-2035 (USD Billions)
    373. France
    374. Active Pharmaceutical Ingredients Market SIZE ESTIMATES & FORECAST, BY MANUFACTURING
    375. PROCESS, 2019-2035 (USD Billions)
    376. France Active Pharmaceutical
    377. Ingredients Market SIZE ESTIMATES & FORECAST, BY REGIONAL, 2019-2035 (USD Billions)
    378. Russia
    379. Active Pharmaceutical Ingredients Market SIZE ESTIMATES & FORECAST, BY TYPE,
    380. 2035 (USD Billions)
    381. Russia Active Pharmaceutical
    382. Ingredients Market SIZE ESTIMATES & FORECAST, BY FORMULATION, 2019-2035 (USD
    383. Billions)
    384. Russia Active Pharmaceutical Ingredients Market
    385. SIZE ESTIMATES & FORECAST, BY THERAPEUTIC AREA, 2019-2035 (USD Billions)
    386. Russia
    387. Active Pharmaceutical Ingredients Market SIZE ESTIMATES & FORECAST, BY MANUFACTURING
    388. PROCESS, 2019-2035 (USD Billions)
    389. Russia Active Pharmaceutical
    390. Ingredients Market SIZE ESTIMATES & FORECAST, BY REGIONAL, 2019-2035 (USD Billions)
    391. Italy
    392. Active Pharmaceutical Ingredients Market SIZE ESTIMATES & FORECAST, BY TYPE,
    393. 2035 (USD Billions)
    394. Italy Active Pharmaceutical
    395. Ingredients Market SIZE ESTIMATES & FORECAST, BY FORMULATION, 2019-2035 (USD
    396. Billions)
    397. Italy Active Pharmaceutical Ingredients Market
    398. SIZE ESTIMATES & FORECAST, BY THERAPEUTIC AREA, 2019-2035 (USD Billions)
    399. Italy
    400. Active Pharmaceutical Ingredients Market SIZE ESTIMATES & FORECAST, BY MANUFACTURING
    401. PROCESS, 2019-2035 (USD Billions)
    402. Italy Active Pharmaceutical
    403. Ingredients Market SIZE ESTIMATES & FORECAST, BY REGIONAL, 2019-2035 (USD Billions)
    404. Spain
    405. Active Pharmaceutical Ingredients Market SIZE ESTIMATES & FORECAST, BY TYPE,
    406. 2035 (USD Billions)
    407. Spain Active Pharmaceutical
    408. Ingredients Market SIZE ESTIMATES & FORECAST, BY FORMULATION, 2019-2035 (USD
    409. Billions)
    410. Spain Active Pharmaceutical Ingredients Market
    411. SIZE ESTIMATES & FORECAST, BY THERAPEUTIC AREA, 2019-2035 (USD Billions)
    412. Spain
    413. Active Pharmaceutical Ingredients Market SIZE ESTIMATES & FORECAST, BY MANUFACTURING
    414. PROCESS, 2019-2035 (USD Billions)
    415. Spain Active Pharmaceutical
    416. Ingredients Market SIZE ESTIMATES & FORECAST, BY REGIONAL, 2019-2035 (USD Billions)
    417. Rest
    418. of Europe Active Pharmaceutical Ingredients Market SIZE ESTIMATES & FORECAST,
    419. BY TYPE, 2019-2035 (USD Billions)
    420. Rest of Europe Active
    421. Pharmaceutical Ingredients Market SIZE ESTIMATES & FORECAST, BY FORMULATION,
    422. 2035 (USD Billions)
    423. Rest of Europe Active Pharmaceutical
    424. Ingredients Market SIZE ESTIMATES & FORECAST, BY THERAPEUTIC AREA, 2019-2035
    425. (USD Billions)
    426. Rest of Europe Active Pharmaceutical Ingredients
    427. Market SIZE ESTIMATES & FORECAST, BY MANUFACTURING PROCESS, 2019-2035 (USD Billions)
    428. Rest
    429. of Europe Active Pharmaceutical Ingredients Market SIZE ESTIMATES & FORECAST,
    430. BY REGIONAL, 2019-2035 (USD Billions)
    431. APAC Active Pharmaceutical
    432. Ingredients Market SIZE ESTIMATES & FORECAST, BY TYPE, 2019-2035 (USD Billions)
    433. APAC
    434. Active Pharmaceutical Ingredients Market SIZE ESTIMATES & FORECAST, BY FORMULATION,
    435. 2035 (USD Billions)
    436. APAC Active Pharmaceutical Ingredients
    437. Market SIZE ESTIMATES & FORECAST, BY THERAPEUTIC AREA, 2019-2035 (USD Billions)
    438. APAC
    439. Active Pharmaceutical Ingredients Market SIZE ESTIMATES & FORECAST, BY MANUFACTURING
    440. PROCESS, 2019-2035 (USD Billions)
    441. APAC Active Pharmaceutical
    442. Ingredients Market SIZE ESTIMATES & FORECAST, BY REGIONAL, 2019-2035 (USD Billions)
    443. China
    444. Active Pharmaceutical Ingredients Market SIZE ESTIMATES & FORECAST, BY TYPE,
    445. 2035 (USD Billions)
    446. China Active Pharmaceutical
    447. Ingredients Market SIZE ESTIMATES & FORECAST, BY FORMULATION, 2019-2035 (USD
    448. Billions)
    449. China Active Pharmaceutical Ingredients Market
    450. SIZE ESTIMATES & FORECAST, BY THERAPEUTIC AREA, 2019-2035 (USD Billions)
    451. China
    452. Active Pharmaceutical Ingredients Market SIZE ESTIMATES & FORECAST, BY MANUFACTURING
    453. PROCESS, 2019-2035 (USD Billions)
    454. China Active Pharmaceutical
    455. Ingredients Market SIZE ESTIMATES & FORECAST, BY REGIONAL, 2019-2035 (USD Billions)
    456. India
    457. Active Pharmaceutical Ingredients Market SIZE ESTIMATES & FORECAST, BY TYPE,
    458. 2035 (USD Billions)
    459. India Active Pharmaceutical
    460. Ingredients Market SIZE ESTIMATES & FORECAST, BY FORMULATION, 2019-2035 (USD
    461. Billions)
    462. India Active Pharmaceutical Ingredients Market
    463. SIZE ESTIMATES & FORECAST, BY THERAPEUTIC AREA, 2019-2035 (USD Billions)
    464. India
    465. Active Pharmaceutical Ingredients Market SIZE ESTIMATES & FORECAST, BY MANUFACTURING
    466. PROCESS, 2019-2035 (USD Billions)
    467. India Active Pharmaceutical
    468. Ingredients Market SIZE ESTIMATES & FORECAST, BY REGIONAL, 2019-2035 (USD Billions)
    469. Japan
    470. Active Pharmaceutical Ingredients Market SIZE ESTIMATES & FORECAST, BY TYPE,
    471. 2035 (USD Billions)
    472. Japan Active Pharmaceutical
    473. Ingredients Market SIZE ESTIMATES & FORECAST, BY FORMULATION, 2019-2035 (USD
    474. Billions)
    475. Japan Active Pharmaceutical Ingredients Market
    476. SIZE ESTIMATES & FORECAST, BY THERAPEUTIC AREA, 2019-2035 (USD Billions)
    477. Japan
    478. Active Pharmaceutical Ingredients Market SIZE ESTIMATES & FORECAST, BY MANUFACTURING
    479. PROCESS, 2019-2035 (USD Billions)
    480. Japan Active Pharmaceutical
    481. Ingredients Market SIZE ESTIMATES & FORECAST, BY REGIONAL, 2019-2035 (USD Billions)
    482. South
    483. Korea Active Pharmaceutical Ingredients Market SIZE ESTIMATES & FORECAST, BY
    484. TYPE, 2019-2035 (USD Billions)
    485. South Korea Active Pharmaceutical
    486. Ingredients Market SIZE ESTIMATES & FORECAST, BY FORMULATION, 2019-2035 (USD
    487. Billions)
    488. South Korea Active Pharmaceutical Ingredients
    489. Market SIZE ESTIMATES & FORECAST, BY THERAPEUTIC AREA, 2019-2035 (USD Billions)
    490. South
    491. Korea Active Pharmaceutical Ingredients Market SIZE ESTIMATES & FORECAST, BY
    492. MANUFACTURING PROCESS, 2019-2035 (USD Billions)
    493. South
    494. Korea Active Pharmaceutical Ingredients Market SIZE ESTIMATES & FORECAST, BY
    495. REGIONAL, 2019-2035 (USD Billions)
    496. Malaysia Active Pharmaceutical
    497. Ingredients Market SIZE ESTIMATES & FORECAST, BY TYPE, 2019-2035 (USD Billions)
    498. Malaysia
    499. Active Pharmaceutical Ingredients Market SIZE ESTIMATES & FORECAST, BY FORMULATION,
    500. 2035 (USD Billions)
    501. Malaysia Active Pharmaceutical
    502. Ingredients Market SIZE ESTIMATES & FORECAST, BY THERAPEUTIC AREA, 2019-2035
    503. (USD Billions)
    504. Malaysia Active Pharmaceutical Ingredients
    505. Market SIZE ESTIMATES & FORECAST, BY MANUFACTURING PROCESS, 2019-2035 (USD Billions)
    506. Malaysia
    507. Active Pharmaceutical Ingredients Market SIZE ESTIMATES & FORECAST, BY REGIONAL,
    508. 2035 (USD Billions)
    509. Thailand Active Pharmaceutical
    510. Ingredients Market SIZE ESTIMATES & FORECAST, BY TYPE, 2019-2035 (USD Billions)
    511. Thailand
    512. Active Pharmaceutical Ingredients Market SIZE ESTIMATES & FORECAST, BY FORMULATION,
    513. 2035 (USD Billions)
    514. Thailand Active Pharmaceutical
    515. Ingredients Market SIZE ESTIMATES & FORECAST, BY THERAPEUTIC AREA, 2019-2035
    516. (USD Billions)
    517. Thailand Active Pharmaceutical Ingredients
    518. Market SIZE ESTIMATES & FORECAST, BY MANUFACTURING PROCESS, 2019-2035 (USD Billions)
    519. Thailand
    520. Active Pharmaceutical Ingredients Market SIZE ESTIMATES & FORECAST, BY REGIONAL,
    521. 2035 (USD Billions)
    522. Indonesia Active Pharmaceutical
    523. Ingredients Market SIZE ESTIMATES & FORECAST, BY TYPE, 2019-2035 (USD Billions)
    524. Indonesia
    525. Active Pharmaceutical Ingredients Market SIZE ESTIMATES & FORECAST, BY FORMULATION,
    526. 2035 (USD Billions)
    527. Indonesia Active Pharmaceutical
    528. Ingredients Market SIZE ESTIMATES & FORECAST, BY THERAPEUTIC AREA, 2019-2035
    529. (USD Billions)
    530. Indonesia Active Pharmaceutical Ingredients
    531. Market SIZE ESTIMATES & FORECAST, BY MANUFACTURING PROCESS, 2019-2035 (USD Billions)
    532. Indonesia
    533. Active Pharmaceutical Ingredients Market SIZE ESTIMATES & FORECAST, BY REGIONAL,
    534. 2035 (USD Billions)
    535. Rest of APAC Active Pharmaceutical
    536. Ingredients Market SIZE ESTIMATES & FORECAST, BY TYPE, 2019-2035 (USD Billions)
    537. Rest
    538. of APAC Active Pharmaceutical Ingredients Market SIZE ESTIMATES & FORECAST,
    539. BY FORMULATION, 2019-2035 (USD Billions)
    540. Rest of APAC
    541. Active Pharmaceutical Ingredients Market SIZE ESTIMATES & FORECAST, BY THERAPEUTIC
    542. AREA, 2019-2035 (USD Billions)
    543. Rest of APAC Active Pharmaceutical
    544. Ingredients Market SIZE ESTIMATES & FORECAST, BY MANUFACTURING PROCESS, 2019-2035
    545. (USD Billions)
    546. Rest of APAC Active Pharmaceutical Ingredients
    547. Market SIZE ESTIMATES & FORECAST, BY REGIONAL, 2019-2035 (USD Billions)
    548. South
    549. America Active Pharmaceutical Ingredients Market SIZE ESTIMATES & FORECAST,
    550. BY TYPE, 2019-2035 (USD Billions)
    551. South America Active
    552. Pharmaceutical Ingredients Market SIZE ESTIMATES & FORECAST, BY FORMULATION,
    553. 2035 (USD Billions)
    554. South America Active Pharmaceutical
    555. Ingredients Market SIZE ESTIMATES & FORECAST, BY THERAPEUTIC AREA, 2019-2035
    556. (USD Billions)
    557. South America Active Pharmaceutical Ingredients
    558. Market SIZE ESTIMATES & FORECAST, BY MANUFACTURING PROCESS, 2019-2035 (USD Billions)
    559. South
    560. America Active Pharmaceutical Ingredients Market SIZE ESTIMATES & FORECAST,
    561. BY REGIONAL, 2019-2035 (USD Billions)
    562. Brazil Active Pharmaceutical
    563. Ingredients Market SIZE ESTIMATES & FORECAST, BY TYPE, 2019-2035 (USD Billions)
    564. Brazil
    565. Active Pharmaceutical Ingredients Market SIZE ESTIMATES & FORECAST, BY FORMULATION,
    566. 2035 (USD Billions)
    567. Brazil Active Pharmaceutical
    568. Ingredients Market SIZE ESTIMATES & FORECAST, BY THERAPEUTIC AREA, 2019-2035
    569. (USD Billions)
    570. Brazil Active Pharmaceutical Ingredients
    571. Market SIZE ESTIMATES & FORECAST, BY MANUFACTURING PROCESS, 2019-2035 (USD Billions)
    572. Brazil
    573. Active Pharmaceutical Ingredients Market SIZE ESTIMATES & FORECAST, BY REGIONAL,
    574. 2035 (USD Billions)
    575. Mexico Active Pharmaceutical
    576. Ingredients Market SIZE ESTIMATES & FORECAST, BY TYPE, 2019-2035 (USD Billions)
    577. Mexico
    578. Active Pharmaceutical Ingredients Market SIZE ESTIMATES & FORECAST, BY FORMULATION,
    579. 2035 (USD Billions)
    580. Mexico Active Pharmaceutical
    581. Ingredients Market SIZE ESTIMATES & FORECAST, BY THERAPEUTIC AREA, 2019-2035
    582. (USD Billions)
    583. Mexico Active Pharmaceutical Ingredients
    584. Market SIZE ESTIMATES & FORECAST, BY MANUFACTURING PROCESS, 2019-2035 (USD Billions)
    585. Mexico
    586. Active Pharmaceutical Ingredients Market SIZE ESTIMATES & FORECAST, BY REGIONAL,
    587. 2035 (USD Billions)
    588. Argentina Active Pharmaceutical
    589. Ingredients Market SIZE ESTIMATES & FORECAST, BY TYPE, 2019-2035 (USD Billions)
    590. Argentina
    591. Active Pharmaceutical Ingredients Market SIZE ESTIMATES & FORECAST, BY FORMULATION,
    592. 2035 (USD Billions)
    593. Argentina Active Pharmaceutical
    594. Ingredients Market SIZE ESTIMATES & FORECAST, BY THERAPEUTIC AREA, 2019-2035
    595. (USD Billions)
    596. Argentina Active Pharmaceutical Ingredients
    597. Market SIZE ESTIMATES & FORECAST, BY MANUFACTURING PROCESS, 2019-2035 (USD Billions)
    598. Argentina
    599. Active Pharmaceutical Ingredients Market SIZE ESTIMATES & FORECAST, BY REGIONAL,
    600. 2035 (USD Billions)
    601. Rest of South America Active
    602. Pharmaceutical Ingredients Market SIZE ESTIMATES & FORECAST, BY TYPE, 2019-2035
    603. (USD Billions)
    604. Rest of South America Active Pharmaceutical
    605. Ingredients Market SIZE ESTIMATES & FORECAST, BY FORMULATION, 2019-2035 (USD
    606. Billions)
    607. Rest of South America Active Pharmaceutical
    608. Ingredients Market SIZE ESTIMATES & FORECAST, BY THERAPEUTIC AREA, 2019-2035
    609. (USD Billions)
    610. Rest of South America Active Pharmaceutical
    611. Ingredients Market SIZE ESTIMATES & FORECAST, BY MANUFACTURING PROCESS, 2019-2035
    612. (USD Billions)
    613. Rest of South America Active Pharmaceutical
    614. Ingredients Market SIZE ESTIMATES & FORECAST, BY REGIONAL, 2019-2035 (USD Billions)
    615. MEA
    616. Active Pharmaceutical Ingredients Market SIZE ESTIMATES & FORECAST, BY TYPE,
    617. 2035 (USD Billions)
    618. MEA Active Pharmaceutical Ingredients
    619. Market SIZE ESTIMATES & FORECAST, BY FORMULATION, 2019-2035 (USD Billions)
    620. MEA
    621. Active Pharmaceutical Ingredients Market SIZE ESTIMATES & FORECAST, BY THERAPEUTIC
    622. AREA, 2019-2035 (USD Billions)
    623. MEA Active Pharmaceutical
    624. Ingredients Market SIZE ESTIMATES & FORECAST, BY MANUFACTURING PROCESS, 2019-2035
    625. (USD Billions)
    626. MEA Active Pharmaceutical Ingredients
    627. Market SIZE ESTIMATES & FORECAST, BY REGIONAL, 2019-2035 (USD Billions)
    628. GCC
    629. Countries Active Pharmaceutical Ingredients Market SIZE ESTIMATES & FORECAST,
    630. BY TYPE, 2019-2035 (USD Billions)
    631. GCC Countries Active
    632. Pharmaceutical Ingredients Market SIZE ESTIMATES & FORECAST, BY FORMULATION,
    633. 2035 (USD Billions)
    634. GCC Countries Active Pharmaceutical
    635. Ingredients Market SIZE ESTIMATES & FORECAST, BY THERAPEUTIC AREA, 2019-2035
    636. (USD Billions)
    637. GCC Countries Active Pharmaceutical Ingredients
    638. Market SIZE ESTIMATES & FORECAST, BY MANUFACTURING PROCESS, 2019-2035 (USD Billions)
    639. GCC
    640. Countries Active Pharmaceutical Ingredients Market SIZE ESTIMATES & FORECAST,
    641. BY REGIONAL, 2019-2035 (USD Billions)
    642. South Africa Active
    643. Pharmaceutical Ingredients Market SIZE ESTIMATES & FORECAST, BY TYPE, 2019-2035
    644. (USD Billions)
    645. South Africa Active Pharmaceutical Ingredients
    646. Market SIZE ESTIMATES & FORECAST, BY FORMULATION, 2019-2035 (USD Billions)
    647. South
    648. Africa Active Pharmaceutical Ingredients Market SIZE ESTIMATES & FORECAST, BY
    649. THERAPEUTIC AREA, 2019-2035 (USD Billions)
    650. South Africa
    651. Active Pharmaceutical Ingredients Market SIZE ESTIMATES & FORECAST, BY MANUFACTURING
    652. PROCESS, 2019-2035 (USD Billions)
    653. South Africa Active
    654. Pharmaceutical Ingredients Market SIZE ESTIMATES & FORECAST, BY REGIONAL, 2019-2035
    655. (USD Billions)
    656. Rest of MEA Active Pharmaceutical Ingredients
    657. Market SIZE ESTIMATES & FORECAST, BY TYPE, 2019-2035 (USD Billions)
    658. Rest
    659. of MEA Active Pharmaceutical Ingredients Market SIZE ESTIMATES & FORECAST, BY
    660. FORMULATION, 2019-2035 (USD Billions)
    661. Rest of MEA Active
    662. Pharmaceutical Ingredients Market SIZE ESTIMATES & FORECAST, BY THERAPEUTIC
    663. AREA, 2019-2035 (USD Billions)
    664. Rest of MEA Active Pharmaceutical
    665. Ingredients Market SIZE ESTIMATES & FORECAST, BY MANUFACTURING PROCESS, 2019-2035
    666. (USD Billions)
    667. Rest of MEA Active Pharmaceutical Ingredients
    668. Market SIZE ESTIMATES & FORECAST, BY REGIONAL, 2019-2035 (USD Billions)
    669. PRODUCT
    670. LAUNCH/PRODUCT DEVELOPMENT/APPROVAL
    671. ACQUISITION/PARTNERSHIP
    672. LIST
    673. Of figures
    674. MARKET SYNOPSIS
    675. NORTH
    676. AMERICA ACTIVE PHARMACEUTICAL INGREDIENTS MARKET ANALYSIS
    677. US
    678. ACTIVE PHARMACEUTICAL INGREDIENTS MARKET ANALYSIS BY TYPE
    679. US
    680. ACTIVE PHARMACEUTICAL INGREDIENTS MARKET ANALYSIS BY FORMULATION
    681. US
    682. ACTIVE PHARMACEUTICAL INGREDIENTS MARKET ANALYSIS BY THERAPEUTIC AREA
    683. US
    684. ACTIVE PHARMACEUTICAL INGREDIENTS MARKET ANALYSIS BY MANUFACTURING PROCESS
    685. US
    686. ACTIVE PHARMACEUTICAL INGREDIENTS MARKET ANALYSIS BY REGIONAL
    687. CANADA
    688. ACTIVE PHARMACEUTICAL INGREDIENTS MARKET ANALYSIS BY TYPE
    689. CANADA
    690. ACTIVE PHARMACEUTICAL INGREDIENTS MARKET ANALYSIS BY FORMULATION
    691. CANADA
    692. ACTIVE PHARMACEUTICAL INGREDIENTS MARKET ANALYSIS BY THERAPEUTIC AREA
    693. CANADA
    694. ACTIVE PHARMACEUTICAL INGREDIENTS MARKET ANALYSIS BY MANUFACTURING PROCESS
    695. CANADA
    696. ACTIVE PHARMACEUTICAL INGREDIENTS MARKET ANALYSIS BY REGIONAL
    697. EUROPE
    698. ACTIVE PHARMACEUTICAL INGREDIENTS MARKET ANALYSIS
    699. GERMANY
    700. ACTIVE PHARMACEUTICAL INGREDIENTS MARKET ANALYSIS BY TYPE
    701. GERMANY
    702. ACTIVE PHARMACEUTICAL INGREDIENTS MARKET ANALYSIS BY FORMULATION
    703. GERMANY
    704. ACTIVE PHARMACEUTICAL INGREDIENTS MARKET ANALYSIS BY THERAPEUTIC AREA
    705. GERMANY
    706. ACTIVE PHARMACEUTICAL INGREDIENTS MARKET ANALYSIS BY MANUFACTURING PROCESS
    707. GERMANY
    708. ACTIVE PHARMACEUTICAL INGREDIENTS MARKET ANALYSIS BY REGIONAL
    709. UK
    710. ACTIVE PHARMACEUTICAL INGREDIENTS MARKET ANALYSIS BY TYPE
    711. UK
    712. ACTIVE PHARMACEUTICAL INGREDIENTS MARKET ANALYSIS BY FORMULATION
    713. UK
    714. ACTIVE PHARMACEUTICAL INGREDIENTS MARKET ANALYSIS BY THERAPEUTIC AREA
    715. UK
    716. ACTIVE PHARMACEUTICAL INGREDIENTS MARKET ANALYSIS BY MANUFACTURING PROCESS
    717. UK
    718. ACTIVE PHARMACEUTICAL INGREDIENTS MARKET ANALYSIS BY REGIONAL
    719. FRANCE
    720. ACTIVE PHARMACEUTICAL INGREDIENTS MARKET ANALYSIS BY TYPE
    721. FRANCE
    722. ACTIVE PHARMACEUTICAL INGREDIENTS MARKET ANALYSIS BY FORMULATION
    723. FRANCE
    724. ACTIVE PHARMACEUTICAL INGREDIENTS MARKET ANALYSIS BY THERAPEUTIC AREA
    725. FRANCE
    726. ACTIVE PHARMACEUTICAL INGREDIENTS MARKET ANALYSIS BY MANUFACTURING PROCESS
    727. FRANCE
    728. ACTIVE PHARMACEUTICAL INGREDIENTS MARKET ANALYSIS BY REGIONAL
    729. RUSSIA
    730. ACTIVE PHARMACEUTICAL INGREDIENTS MARKET ANALYSIS BY TYPE
    731. RUSSIA
    732. ACTIVE PHARMACEUTICAL INGREDIENTS MARKET ANALYSIS BY FORMULATION
    733. RUSSIA
    734. ACTIVE PHARMACEUTICAL INGREDIENTS MARKET ANALYSIS BY THERAPEUTIC AREA
    735. RUSSIA
    736. ACTIVE PHARMACEUTICAL INGREDIENTS MARKET ANALYSIS BY MANUFACTURING PROCESS
    737. RUSSIA
    738. ACTIVE PHARMACEUTICAL INGREDIENTS MARKET ANALYSIS BY REGIONAL
    739. ITALY
    740. ACTIVE PHARMACEUTICAL INGREDIENTS MARKET ANALYSIS BY TYPE
    741. ITALY
    742. ACTIVE PHARMACEUTICAL INGREDIENTS MARKET ANALYSIS BY FORMULATION
    743. ITALY
    744. ACTIVE PHARMACEUTICAL INGREDIENTS MARKET ANALYSIS BY THERAPEUTIC AREA
    745. ITALY
    746. ACTIVE PHARMACEUTICAL INGREDIENTS MARKET ANALYSIS BY MANUFACTURING PROCESS
    747. ITALY
    748. ACTIVE PHARMACEUTICAL INGREDIENTS MARKET ANALYSIS BY REGIONAL
    749. SPAIN
    750. ACTIVE PHARMACEUTICAL INGREDIENTS MARKET ANALYSIS BY TYPE
    751. SPAIN
    752. ACTIVE PHARMACEUTICAL INGREDIENTS MARKET ANALYSIS BY FORMULATION
    753. SPAIN
    754. ACTIVE PHARMACEUTICAL INGREDIENTS MARKET ANALYSIS BY THERAPEUTIC AREA
    755. SPAIN
    756. ACTIVE PHARMACEUTICAL INGREDIENTS MARKET ANALYSIS BY MANUFACTURING PROCESS
    757. SPAIN
    758. ACTIVE PHARMACEUTICAL INGREDIENTS MARKET ANALYSIS BY REGIONAL
    759. REST
    760. OF EUROPE ACTIVE PHARMACEUTICAL INGREDIENTS MARKET ANALYSIS BY TYPE
    761. REST
    762. OF EUROPE ACTIVE PHARMACEUTICAL INGREDIENTS MARKET ANALYSIS BY FORMULATION
    763. REST
    764. OF EUROPE ACTIVE PHARMACEUTICAL INGREDIENTS MARKET ANALYSIS BY THERAPEUTIC AREA
    765. REST
    766. OF EUROPE ACTIVE PHARMACEUTICAL INGREDIENTS MARKET ANALYSIS BY MANUFACTURING PROCESS
    767. REST
    768. OF EUROPE ACTIVE PHARMACEUTICAL INGREDIENTS MARKET ANALYSIS BY REGIONAL
    769. APAC
    770. ACTIVE PHARMACEUTICAL INGREDIENTS MARKET ANALYSIS
    771. CHINA
    772. ACTIVE PHARMACEUTICAL INGREDIENTS MARKET ANALYSIS BY TYPE
    773. CHINA
    774. ACTIVE PHARMACEUTICAL INGREDIENTS MARKET ANALYSIS BY FORMULATION
    775. CHINA
    776. ACTIVE PHARMACEUTICAL INGREDIENTS MARKET ANALYSIS BY THERAPEUTIC AREA
    777. CHINA
    778. ACTIVE PHARMACEUTICAL INGREDIENTS MARKET ANALYSIS BY MANUFACTURING PROCESS
    779. CHINA
    780. ACTIVE PHARMACEUTICAL INGREDIENTS MARKET ANALYSIS BY REGIONAL
    781. INDIA
    782. ACTIVE PHARMACEUTICAL INGREDIENTS MARKET ANALYSIS BY TYPE
    783. INDIA
    784. ACTIVE PHARMACEUTICAL INGREDIENTS MARKET ANALYSIS BY FORMULATION
    785. INDIA
    786. ACTIVE PHARMACEUTICAL INGREDIENTS MARKET ANALYSIS BY THERAPEUTIC AREA
    787. INDIA
    788. ACTIVE PHARMACEUTICAL INGREDIENTS MARKET ANALYSIS BY MANUFACTURING PROCESS
    789. INDIA
    790. ACTIVE PHARMACEUTICAL INGREDIENTS MARKET ANALYSIS BY REGIONAL
    791. JAPAN
    792. ACTIVE PHARMACEUTICAL INGREDIENTS MARKET ANALYSIS BY TYPE
    793. JAPAN
    794. ACTIVE PHARMACEUTICAL INGREDIENTS MARKET ANALYSIS BY FORMULATION
    795. JAPAN
    796. ACTIVE PHARMACEUTICAL INGREDIENTS MARKET ANALYSIS BY THERAPEUTIC AREA
    797. JAPAN
    798. ACTIVE PHARMACEUTICAL INGREDIENTS MARKET ANALYSIS BY MANUFACTURING PROCESS
    799. JAPAN
    800. ACTIVE PHARMACEUTICAL INGREDIENTS MARKET ANALYSIS BY REGIONAL
    801. SOUTH
    802. KOREA ACTIVE PHARMACEUTICAL INGREDIENTS MARKET ANALYSIS BY TYPE
    803. SOUTH
    804. KOREA ACTIVE PHARMACEUTICAL INGREDIENTS MARKET ANALYSIS BY FORMULATION
    805. SOUTH
    806. KOREA ACTIVE PHARMACEUTICAL INGREDIENTS MARKET ANALYSIS BY THERAPEUTIC AREA
    807. SOUTH
    808. KOREA ACTIVE PHARMACEUTICAL INGREDIENTS MARKET ANALYSIS BY MANUFACTURING PROCESS
    809. SOUTH
    810. KOREA ACTIVE PHARMACEUTICAL INGREDIENTS MARKET ANALYSIS BY REGIONAL
    811. MALAYSIA
    812. ACTIVE PHARMACEUTICAL INGREDIENTS MARKET ANALYSIS BY TYPE
    813. MALAYSIA
    814. ACTIVE PHARMACEUTICAL INGREDIENTS MARKET ANALYSIS BY FORMULATION
    815. MALAYSIA
    816. ACTIVE PHARMACEUTICAL INGREDIENTS MARKET ANALYSIS BY THERAPEUTIC AREA
    817. MALAYSIA
    818. ACTIVE PHARMACEUTICAL INGREDIENTS MARKET ANALYSIS BY MANUFACTURING PROCESS
    819. MALAYSIA
    820. ACTIVE PHARMACEUTICAL INGREDIENTS MARKET ANALYSIS BY REGIONAL
    821. THAILAND
    822. ACTIVE PHARMACEUTICAL INGREDIENTS MARKET ANALYSIS BY TYPE
    823. THAILAND
    824. ACTIVE PHARMACEUTICAL INGREDIENTS MARKET ANALYSIS BY FORMULATION
    825. THAILAND
    826. ACTIVE PHARMACEUTICAL INGREDIENTS MARKET ANALYSIS BY THERAPEUTIC AREA
    827. THAILAND
    828. ACTIVE PHARMACEUTICAL INGREDIENTS MARKET ANALYSIS BY MANUFACTURING PROCESS
    829. THAILAND
    830. ACTIVE PHARMACEUTICAL INGREDIENTS MARKET ANALYSIS BY REGIONAL
    831. INDONESIA
    832. ACTIVE PHARMACEUTICAL INGREDIENTS MARKET ANALYSIS BY TYPE
    833. INDONESIA
    834. ACTIVE PHARMACEUTICAL INGREDIENTS MARKET ANALYSIS BY FORMULATION
    835. INDONESIA
    836. ACTIVE PHARMACEUTICAL INGREDIENTS MARKET ANALYSIS BY THERAPEUTIC AREA
    837. INDONESIA
    838. ACTIVE PHARMACEUTICAL INGREDIENTS MARKET ANALYSIS BY MANUFACTURING PROCESS
    839. INDONESIA
    840. ACTIVE PHARMACEUTICAL INGREDIENTS MARKET ANALYSIS BY REGIONAL
    841. REST
    842. OF APAC ACTIVE PHARMACEUTICAL INGREDIENTS MARKET ANALYSIS BY TYPE
    843. REST
    844. OF APAC ACTIVE PHARMACEUTICAL INGREDIENTS MARKET ANALYSIS BY FORMULATION
    845. REST
    846. OF APAC ACTIVE PHARMACEUTICAL INGREDIENTS MARKET ANALYSIS BY THERAPEUTIC AREA
    847. REST
    848. OF APAC ACTIVE PHARMACEUTICAL INGREDIENTS MARKET ANALYSIS BY MANUFACTURING PROCESS
    849. REST
    850. OF APAC ACTIVE PHARMACEUTICAL INGREDIENTS MARKET ANALYSIS BY REGIONAL
    851. SOUTH
    852. AMERICA ACTIVE PHARMACEUTICAL INGREDIENTS MARKET ANALYSIS
    853. BRAZIL
    854. ACTIVE PHARMACEUTICAL INGREDIENTS MARKET ANALYSIS BY TYPE
    855. BRAZIL
    856. ACTIVE PHARMACEUTICAL INGREDIENTS MARKET ANALYSIS BY FORMULATION
    857. BRAZIL
    858. ACTIVE PHARMACEUTICAL INGREDIENTS MARKET ANALYSIS BY THERAPEUTIC AREA
    859. BRAZIL
    860. ACTIVE PHARMACEUTICAL INGREDIENTS MARKET ANALYSIS BY MANUFACTURING PROCESS
    861. BRAZIL
    862. ACTIVE PHARMACEUTICAL INGREDIENTS MARKET ANALYSIS BY REGIONAL
    863. MEXICO
    864. ACTIVE PHARMACEUTICAL INGREDIENTS MARKET ANALYSIS BY TYPE
    865. MEXICO
    866. ACTIVE PHARMACEUTICAL INGREDIENTS MARKET ANALYSIS BY FORMULATION
    867. MEXICO
    868. ACTIVE PHARMACEUTICAL INGREDIENTS MARKET ANALYSIS BY THERAPEUTIC AREA
    869. MEXICO
    870. ACTIVE PHARMACEUTICAL INGREDIENTS MARKET ANALYSIS BY MANUFACTURING PROCESS
    871. MEXICO
    872. ACTIVE PHARMACEUTICAL INGREDIENTS MARKET ANALYSIS BY REGIONAL
    873. ARGENTINA
    874. ACTIVE PHARMACEUTICAL INGREDIENTS MARKET ANALYSIS BY TYPE
    875. ARGENTINA
    876. ACTIVE PHARMACEUTICAL INGREDIENTS MARKET ANALYSIS BY FORMULATION
    877. ARGENTINA
    878. ACTIVE PHARMACEUTICAL INGREDIENTS MARKET ANALYSIS BY THERAPEUTIC AREA
    879. ARGENTINA
    880. ACTIVE PHARMACEUTICAL INGREDIENTS MARKET ANALYSIS BY MANUFACTURING PROCESS
    881. ARGENTINA
    882. ACTIVE PHARMACEUTICAL INGREDIENTS MARKET ANALYSIS BY REGIONAL
    883. REST
    884. OF SOUTH AMERICA ACTIVE PHARMACEUTICAL INGREDIENTS MARKET ANALYSIS BY TYPE
    885. REST
    886. OF SOUTH AMERICA ACTIVE PHARMACEUTICAL INGREDIENTS MARKET ANALYSIS BY FORMULATION
    887. REST
    888. OF SOUTH AMERICA ACTIVE PHARMACEUTICAL INGREDIENTS MARKET ANALYSIS BY THERAPEUTIC
    889. AREA
    890. REST OF SOUTH AMERICA ACTIVE PHARMACEUTICAL INGREDIENTS
    891. MARKET ANALYSIS BY MANUFACTURING PROCESS
    892. REST OF SOUTH
    893. AMERICA ACTIVE PHARMACEUTICAL INGREDIENTS MARKET ANALYSIS BY REGIONAL
    894. MEA
    895. ACTIVE PHARMACEUTICAL INGREDIENTS MARKET ANALYSIS
    896. GCC
    897. COUNTRIES ACTIVE PHARMACEUTICAL INGREDIENTS MARKET ANALYSIS BY TYPE
    898. GCC
    899. COUNTRIES ACTIVE PHARMACEUTICAL INGREDIENTS MARKET ANALYSIS BY FORMULATION
    900. GCC
    901. COUNTRIES ACTIVE PHARMACEUTICAL INGREDIENTS MARKET ANALYSIS BY THERAPEUTIC AREA
    902. GCC
    903. COUNTRIES ACTIVE PHARMACEUTICAL INGREDIENTS MARKET ANALYSIS BY MANUFACTURING PROCESS
    904. GCC
    905. COUNTRIES ACTIVE PHARMACEUTICAL INGREDIENTS MARKET ANALYSIS BY REGIONAL
    906. SOUTH
    907. AFRICA ACTIVE PHARMACEUTICAL INGREDIENTS MARKET ANALYSIS BY TYPE
    908. SOUTH
    909. AFRICA ACTIVE PHARMACEUTICAL INGREDIENTS MARKET ANALYSIS BY FORMULATION
    910. SOUTH
    911. AFRICA ACTIVE PHARMACEUTICAL INGREDIENTS MARKET ANALYSIS BY THERAPEUTIC AREA
    912. SOUTH
    913. AFRICA ACTIVE PHARMACEUTICAL INGREDIENTS MARKET ANALYSIS BY MANUFACTURING PROCESS
    914. SOUTH
    915. AFRICA ACTIVE PHARMACEUTICAL INGREDIENTS MARKET ANALYSIS BY REGIONAL
    916. REST
    917. OF MEA ACTIVE PHARMACEUTICAL INGREDIENTS MARKET ANALYSIS BY TYPE
    918. REST
    919. OF MEA ACTIVE PHARMACEUTICAL INGREDIENTS MARKET ANALYSIS BY FORMULATION
    920. REST
    921. OF MEA ACTIVE PHARMACEUTICAL INGREDIENTS MARKET ANALYSIS BY THERAPEUTIC AREA
    922. REST
    923. OF MEA ACTIVE PHARMACEUTICAL INGREDIENTS MARKET ANALYSIS BY MANUFACTURING PROCESS
    924. REST
    925. OF MEA ACTIVE PHARMACEUTICAL INGREDIENTS MARKET ANALYSIS BY REGIONAL
    926. KEY
    927. BUYING CRITERIA OF ACTIVE PHARMACEUTICAL INGREDIENTS MARKET
    928. RESEARCH
    929. PROCESS OF MRFR
    930. DRO ANALYSIS OF ACTIVE PHARMACEUTICAL
    931. INGREDIENTS MARKET
    932. DRIVERS IMPACT ANALYSIS: ACTIVE PHARMACEUTICAL
    933. INGREDIENTS MARKET
    934. RESTRAINTS IMPACT ANALYSIS: ACTIVE
    935. PHARMACEUTICAL INGREDIENTS MARKET
    936. SUPPLY / VALUE CHAIN:
    937. ACTIVE PHARMACEUTICAL INGREDIENTS MARKET
    938. ACTIVE PHARMACEUTICAL
    939. INGREDIENTS MARKET, BY TYPE, 2025 (% SHARE)
    940. ACTIVE PHARMACEUTICAL
    941. INGREDIENTS MARKET, BY TYPE, 2019 TO 2035 (USD Billions)
    942. ACTIVE
    943. PHARMACEUTICAL INGREDIENTS MARKET, BY FORMULATION, 2025 (% SHARE)
    944. ACTIVE
    945. PHARMACEUTICAL INGREDIENTS MARKET, BY FORMULATION, 2019 TO 2035 (USD Billions)
    946. ACTIVE
    947. PHARMACEUTICAL INGREDIENTS MARKET, BY THERAPEUTIC AREA, 2025 (% SHARE)
    948. ACTIVE
    949. PHARMACEUTICAL INGREDIENTS MARKET, BY THERAPEUTIC AREA, 2019 TO 2035 (USD Billions)
    950. ACTIVE
    951. PHARMACEUTICAL INGREDIENTS MARKET, BY MANUFACTURING PROCESS, 2025 (% SHARE)
    952. ACTIVE
    953. PHARMACEUTICAL INGREDIENTS MARKET, BY MANUFACTURING PROCESS, 2019 TO 2035 (USD Billions)
    954. ACTIVE
    955. PHARMACEUTICAL INGREDIENTS MARKET, BY REGIONAL, 2025 (% SHARE)
    956. ACTIVE
    957. PHARMACEUTICAL INGREDIENTS MARKET, BY REGIONAL, 2019 TO 2035 (USD Billions)
    958. BENCHMARKING
    959. OF MAJOR COMPETITORS

    Active Pharmaceutical Ingredients Market Segmentation

    • Active Pharmaceutical Ingredients Market By Type (USD Billion, 2019-2035)

      • Synthetic APIs
      • Biotech APIs
      • Natural APIs
    • Active Pharmaceutical Ingredients Market By Formulation (USD Billion, 2019-2035)

      • Tablets
      • Injectables
      • Capsules
      • Others


    • Active Pharmaceutical Ingredients Market By Therapeutic Area (USD Billion, 2019-2035)

      • Cardiovascular
      • Oncology
      • Diabetes
      • Psychiatry
      • Infectious Diseases


    • Active Pharmaceutical Ingredients Market By Manufacturing Process (USD Billion, 2019-2035)

      • Batch Manufacturing
      • Continuous Manufacturing
      • Contract Manufacturing


    • Active Pharmaceutical Ingredients Market By Regional (USD Billion, 2019-2035)

      • North America
      • Europe
      • South America
      • Asia Pacific
      • Middle East and Africa


    Active Pharmaceutical Ingredients Market Regional Outlook (USD Billion, 2019-2035)


    • North America Outlook (USD Billion, 2019-2035)

      • North America Active Pharmaceutical Ingredients Market by Type

        • Synthetic APIs
        • Biotech APIs
        • Natural APIs
      • North America Active Pharmaceutical Ingredients Market by Formulation Type

        • Tablets
        • Injectables
        • Capsules
        • Others
      • North America Active Pharmaceutical Ingredients Market by Therapeutic Area Type

        • Cardiovascular
        • Oncology
        • Diabetes
        • Psychiatry
        • Infectious Diseases
      • North America Active Pharmaceutical Ingredients Market by Manufacturing Process Type

        • Batch Manufacturing
        • Continuous Manufacturing
        • Contract Manufacturing
      • North America Active Pharmaceutical Ingredients Market by Regional Type

        • US
        • Canada
      • US Outlook (USD Billion, 2019-2035)
      • US Active Pharmaceutical Ingredients Market by Type

        • Synthetic APIs
        • Biotech APIs
        • Natural APIs
      • US Active Pharmaceutical Ingredients Market by Formulation Type

        • Tablets
        • Injectables
        • Capsules
        • Others
      • US Active Pharmaceutical Ingredients Market by Therapeutic Area Type

        • Cardiovascular
        • Oncology
        • Diabetes
        • Psychiatry
        • Infectious Diseases
      • US Active Pharmaceutical Ingredients Market by Manufacturing Process Type

        • Batch Manufacturing
        • Continuous Manufacturing
        • Contract Manufacturing
      • CANADA Outlook (USD Billion, 2019-2035)
      • CANADA Active Pharmaceutical Ingredients Market by Type

        • Synthetic APIs
        • Biotech APIs
        • Natural APIs
      • CANADA Active Pharmaceutical Ingredients Market by Formulation Type

        • Tablets
        • Injectables
        • Capsules
        • Others
      • CANADA Active Pharmaceutical Ingredients Market by Therapeutic Area Type

        • Cardiovascular
        • Oncology
        • Diabetes
        • Psychiatry
        • Infectious Diseases
      • CANADA Active Pharmaceutical Ingredients Market by Manufacturing Process Type

        • Batch Manufacturing
        • Continuous Manufacturing
        • Contract Manufacturing
    • Europe Outlook (USD Billion, 2019-2035)

      • Europe Active Pharmaceutical Ingredients Market by Type

        • Synthetic APIs
        • Biotech APIs
        • Natural APIs
      • Europe Active Pharmaceutical Ingredients Market by Formulation Type

        • Tablets
        • Injectables
        • Capsules
        • Others
      • Europe Active Pharmaceutical Ingredients Market by Therapeutic Area Type

        • Cardiovascular
        • Oncology
        • Diabetes
        • Psychiatry
        • Infectious Diseases
      • Europe Active Pharmaceutical Ingredients Market by Manufacturing Process Type

        • Batch Manufacturing
        • Continuous Manufacturing
        • Contract Manufacturing
      • Europe Active Pharmaceutical Ingredients Market by Regional Type

        • Germany
        • UK
        • France
        • Russia
        • Italy
        • Spain
        • Rest of Europe
      • GERMANY Outlook (USD Billion, 2019-2035)
      • GERMANY Active Pharmaceutical Ingredients Market by Type

        • Synthetic APIs
        • Biotech APIs
        • Natural APIs
      • GERMANY Active Pharmaceutical Ingredients Market by Formulation Type

        • Tablets
        • Injectables
        • Capsules
        • Others
      • GERMANY Active Pharmaceutical Ingredients Market by Therapeutic Area Type

        • Cardiovascular
        • Oncology
        • Diabetes
        • Psychiatry
        • Infectious Diseases
      • GERMANY Active Pharmaceutical Ingredients Market by Manufacturing Process Type

        • Batch Manufacturing
        • Continuous Manufacturing
        • Contract Manufacturing
      • UK Outlook (USD Billion, 2019-2035)
      • UK Active Pharmaceutical Ingredients Market by Type

        • Synthetic APIs
        • Biotech APIs
        • Natural APIs
      • UK Active Pharmaceutical Ingredients Market by Formulation Type

        • Tablets
        • Injectables
        • Capsules
        • Others
      • UK Active Pharmaceutical Ingredients Market by Therapeutic Area Type

        • Cardiovascular
        • Oncology
        • Diabetes
        • Psychiatry
        • Infectious Diseases
      • UK Active Pharmaceutical Ingredients Market by Manufacturing Process Type

        • Batch Manufacturing
        • Continuous Manufacturing
        • Contract Manufacturing
      • FRANCE Outlook (USD Billion, 2019-2035)
      • FRANCE Active Pharmaceutical Ingredients Market by Type

        • Synthetic APIs
        • Biotech APIs
        • Natural APIs
      • FRANCE Active Pharmaceutical Ingredients Market by Formulation Type

        • Tablets
        • Injectables
        • Capsules
        • Others
      • FRANCE Active Pharmaceutical Ingredients Market by Therapeutic Area Type

        • Cardiovascular
        • Oncology
        • Diabetes
        • Psychiatry
        • Infectious Diseases
      • FRANCE Active Pharmaceutical Ingredients Market by Manufacturing Process Type

        • Batch Manufacturing
        • Continuous Manufacturing
        • Contract Manufacturing
      • RUSSIA Outlook (USD Billion, 2019-2035)
      • RUSSIA Active Pharmaceutical Ingredients Market by Type

        • Synthetic APIs
        • Biotech APIs
        • Natural APIs
      • RUSSIA Active Pharmaceutical Ingredients Market by Formulation Type

        • Tablets
        • Injectables
        • Capsules
        • Others
      • RUSSIA Active Pharmaceutical Ingredients Market by Therapeutic Area Type

        • Cardiovascular
        • Oncology
        • Diabetes
        • Psychiatry
        • Infectious Diseases
      • RUSSIA Active Pharmaceutical Ingredients Market by Manufacturing Process Type

        • Batch Manufacturing
        • Continuous Manufacturing
        • Contract Manufacturing
      • ITALY Outlook (USD Billion, 2019-2035)
      • ITALY Active Pharmaceutical Ingredients Market by Type

        • Synthetic APIs
        • Biotech APIs
        • Natural APIs
      • ITALY Active Pharmaceutical Ingredients Market by Formulation Type

        • Tablets
        • Injectables
        • Capsules
        • Others
      • ITALY Active Pharmaceutical Ingredients Market by Therapeutic Area Type

        • Cardiovascular
        • Oncology
        • Diabetes
        • Psychiatry
        • Infectious Diseases
      • ITALY Active Pharmaceutical Ingredients Market by Manufacturing Process Type

        • Batch Manufacturing
        • Continuous Manufacturing
        • Contract Manufacturing
      • SPAIN Outlook (USD Billion, 2019-2035)
      • SPAIN Active Pharmaceutical Ingredients Market by Type

        • Synthetic APIs
        • Biotech APIs
        • Natural APIs
      • SPAIN Active Pharmaceutical Ingredients Market by Formulation Type

        • Tablets
        • Injectables
        • Capsules
        • Others
      • SPAIN Active Pharmaceutical Ingredients Market by Therapeutic Area Type

        • Cardiovascular
        • Oncology
        • Diabetes
        • Psychiatry
        • Infectious Diseases
      • SPAIN Active Pharmaceutical Ingredients Market by Manufacturing Process Type

        • Batch Manufacturing
        • Continuous Manufacturing
        • Contract Manufacturing
      • REST OF EUROPE Outlook (USD Billion, 2019-2035)
      • REST OF EUROPE Active Pharmaceutical Ingredients Market by Type

        • Synthetic APIs
        • Biotech APIs
        • Natural APIs
      • REST OF EUROPE Active Pharmaceutical Ingredients Market by Formulation Type

        • Tablets
        • Injectables
        • Capsules
        • Others
      • REST OF EUROPE Active Pharmaceutical Ingredients Market by Therapeutic Area Type

        • Cardiovascular
        • Oncology
        • Diabetes
        • Psychiatry
        • Infectious Diseases
      • REST OF EUROPE Active Pharmaceutical Ingredients Market by Manufacturing Process Type

        • Batch Manufacturing
        • Continuous Manufacturing
        • Contract Manufacturing
    • APAC Outlook (USD Billion, 2019-2035)

      • APAC Active Pharmaceutical Ingredients Market by Type

        • Synthetic APIs
        • Biotech APIs
        • Natural APIs
      • APAC Active Pharmaceutical Ingredients Market by Formulation Type

        • Tablets
        • Injectables
        • Capsules
        • Others
      • APAC Active Pharmaceutical Ingredients Market by Therapeutic Area Type

        • Cardiovascular
        • Oncology
        • Diabetes
        • Psychiatry
        • Infectious Diseases
      • APAC Active Pharmaceutical Ingredients Market by Manufacturing Process Type

        • Batch Manufacturing
        • Continuous Manufacturing
        • Contract Manufacturing
      • APAC Active Pharmaceutical Ingredients Market by Regional Type

        • China
        • India
        • Japan
        • South Korea
        • Malaysia
        • Thailand
        • Indonesia
        • Rest of APAC
      • CHINA Outlook (USD Billion, 2019-2035)
      • CHINA Active Pharmaceutical Ingredients Market by Type

        • Synthetic APIs
        • Biotech APIs
        • Natural APIs
      • CHINA Active Pharmaceutical Ingredients Market by Formulation Type

        • Tablets
        • Injectables
        • Capsules
        • Others
      • CHINA Active Pharmaceutical Ingredients Market by Therapeutic Area Type

        • Cardiovascular
        • Oncology
        • Diabetes
        • Psychiatry
        • Infectious Diseases
      • CHINA Active Pharmaceutical Ingredients Market by Manufacturing Process Type

        • Batch Manufacturing
        • Continuous Manufacturing
        • Contract Manufacturing
      • INDIA Outlook (USD Billion, 2019-2035)
      • INDIA Active Pharmaceutical Ingredients Market by Type

        • Synthetic APIs
        • Biotech APIs
        • Natural APIs
      • INDIA Active Pharmaceutical Ingredients Market by Formulation Type

        • Tablets
        • Injectables
        • Capsules
        • Others
      • INDIA Active Pharmaceutical Ingredients Market by Therapeutic Area Type

        • Cardiovascular
        • Oncology
        • Diabetes
        • Psychiatry
        • Infectious Diseases
      • INDIA Active Pharmaceutical Ingredients Market by Manufacturing Process Type

        • Batch Manufacturing
        • Continuous Manufacturing
        • Contract Manufacturing
      • JAPAN Outlook (USD Billion, 2019-2035)
      • JAPAN Active Pharmaceutical Ingredients Market by Type

        • Synthetic APIs
        • Biotech APIs
        • Natural APIs
      • JAPAN Active Pharmaceutical Ingredients Market by Formulation Type

        • Tablets
        • Injectables
        • Capsules
        • Others
      • JAPAN Active Pharmaceutical Ingredients Market by Therapeutic Area Type

        • Cardiovascular
        • Oncology
        • Diabetes
        • Psychiatry
        • Infectious Diseases
      • JAPAN Active Pharmaceutical Ingredients Market by Manufacturing Process Type

        • Batch Manufacturing
        • Continuous Manufacturing
        • Contract Manufacturing
      • SOUTH KOREA Outlook (USD Billion, 2019-2035)
      • SOUTH KOREA Active Pharmaceutical Ingredients Market by Type

        • Synthetic APIs
        • Biotech APIs
        • Natural APIs
      • SOUTH KOREA Active Pharmaceutical Ingredients Market by Formulation Type

        • Tablets
        • Injectables
        • Capsules
        • Others
      • SOUTH KOREA Active Pharmaceutical Ingredients Market by Therapeutic Area Type

        • Cardiovascular
        • Oncology
        • Diabetes
        • Psychiatry
        • Infectious Diseases
      • SOUTH KOREA Active Pharmaceutical Ingredients Market by Manufacturing Process Type

        • Batch Manufacturing
        • Continuous Manufacturing
        • Contract Manufacturing
      • MALAYSIA Outlook (USD Billion, 2019-2035)
      • MALAYSIA Active Pharmaceutical Ingredients Market by Type

        • Synthetic APIs
        • Biotech APIs
        • Natural APIs
      • MALAYSIA Active Pharmaceutical Ingredients Market by Formulation Type

        • Tablets
        • Injectables
        • Capsules
        • Others
      • MALAYSIA Active Pharmaceutical Ingredients Market by Therapeutic Area Type

        • Cardiovascular
        • Oncology
        • Diabetes
        • Psychiatry
        • Infectious Diseases
      • MALAYSIA Active Pharmaceutical Ingredients Market by Manufacturing Process Type

        • Batch Manufacturing
        • Continuous Manufacturing
        • Contract Manufacturing
      • THAILAND Outlook (USD Billion, 2019-2035)
      • THAILAND Active Pharmaceutical Ingredients Market by Type

        • Synthetic APIs
        • Biotech APIs
        • Natural APIs
      • THAILAND Active Pharmaceutical Ingredients Market by Formulation Type

        • Tablets
        • Injectables
        • Capsules
        • Others
      • THAILAND Active Pharmaceutical Ingredients Market by Therapeutic Area Type

        • Cardiovascular
        • Oncology
        • Diabetes
        • Psychiatry
        • Infectious Diseases
      • THAILAND Active Pharmaceutical Ingredients Market by Manufacturing Process Type

        • Batch Manufacturing
        • Continuous Manufacturing
        • Contract Manufacturing
      • INDONESIA Outlook (USD Billion, 2019-2035)
      • INDONESIA Active Pharmaceutical Ingredients Market by Type

        • Synthetic APIs
        • Biotech APIs
        • Natural APIs
      • INDONESIA Active Pharmaceutical Ingredients Market by Formulation Type

        • Tablets
        • Injectables
        • Capsules
        • Others
      • INDONESIA Active Pharmaceutical Ingredients Market by Therapeutic Area Type

        • Cardiovascular
        • Oncology
        • Diabetes
        • Psychiatry
        • Infectious Diseases
      • INDONESIA Active Pharmaceutical Ingredients Market by Manufacturing Process Type

        • Batch Manufacturing
        • Continuous Manufacturing
        • Contract Manufacturing
      • REST OF APAC Outlook (USD Billion, 2019-2035)
      • REST OF APAC Active Pharmaceutical Ingredients Market by Type

        • Synthetic APIs
        • Biotech APIs
        • Natural APIs
      • REST OF APAC Active Pharmaceutical Ingredients Market by Formulation Type

        • Tablets
        • Injectables
        • Capsules
        • Others
      • REST OF APAC Active Pharmaceutical Ingredients Market by Therapeutic Area Type

        • Cardiovascular
        • Oncology
        • Diabetes
        • Psychiatry
        • Infectious Diseases
      • REST OF APAC Active Pharmaceutical Ingredients Market by Manufacturing Process Type

        • Batch Manufacturing
        • Continuous Manufacturing
        • Contract Manufacturing
    • South America Outlook (USD Billion, 2019-2035)

      • South America Active Pharmaceutical Ingredients Market by Type

        • Synthetic APIs
        • Biotech APIs
        • Natural APIs
      • South America Active Pharmaceutical Ingredients Market by Formulation Type

        • Tablets
        • Injectables
        • Capsules
        • Others
      • South America Active Pharmaceutical Ingredients Market by Therapeutic Area Type

        • Cardiovascular
        • Oncology
        • Diabetes
        • Psychiatry
        • Infectious Diseases
      • South America Active Pharmaceutical Ingredients Market by Manufacturing Process Type

        • Batch Manufacturing
        • Continuous Manufacturing
        • Contract Manufacturing
      • South America Active Pharmaceutical Ingredients Market by Regional Type

        • Brazil
        • Mexico
        • Argentina
        • Rest of South America
      • BRAZIL Outlook (USD Billion, 2019-2035)
      • BRAZIL Active Pharmaceutical Ingredients Market by Type

        • Synthetic APIs
        • Biotech APIs
        • Natural APIs
      • BRAZIL Active Pharmaceutical Ingredients Market by Formulation Type

        • Tablets
        • Injectables
        • Capsules
        • Others
      • BRAZIL Active Pharmaceutical Ingredients Market by Therapeutic Area Type

        • Cardiovascular
        • Oncology
        • Diabetes
        • Psychiatry
        • Infectious Diseases
      • BRAZIL Active Pharmaceutical Ingredients Market by Manufacturing Process Type

        • Batch Manufacturing
        • Continuous Manufacturing
        • Contract Manufacturing
      • MEXICO Outlook (USD Billion, 2019-2035)
      • MEXICO Active Pharmaceutical Ingredients Market by Type

        • Synthetic APIs
        • Biotech APIs
        • Natural APIs
      • MEXICO Active Pharmaceutical Ingredients Market by Formulation Type

        • Tablets
        • Injectables
        • Capsules
        • Others
      • MEXICO Active Pharmaceutical Ingredients Market by Therapeutic Area Type

        • Cardiovascular
        • Oncology
        • Diabetes
        • Psychiatry
        • Infectious Diseases
      • MEXICO Active Pharmaceutical Ingredients Market by Manufacturing Process Type

        • Batch Manufacturing
        • Continuous Manufacturing
        • Contract Manufacturing
      • ARGENTINA Outlook (USD Billion, 2019-2035)
      • ARGENTINA Active Pharmaceutical Ingredients Market by Type

        • Synthetic APIs
        • Biotech APIs
        • Natural APIs
      • ARGENTINA Active Pharmaceutical Ingredients Market by Formulation Type

        • Tablets
        • Injectables
        • Capsules
        • Others
      • ARGENTINA Active Pharmaceutical Ingredients Market by Therapeutic Area Type

        • Cardiovascular
        • Oncology
        • Diabetes
        • Psychiatry
        • Infectious Diseases
      • ARGENTINA Active Pharmaceutical Ingredients Market by Manufacturing Process Type

        • Batch Manufacturing
        • Continuous Manufacturing
        • Contract Manufacturing
      • REST OF SOUTH AMERICA Outlook (USD Billion, 2019-2035)
      • REST OF SOUTH AMERICA Active Pharmaceutical Ingredients Market by Type

        • Synthetic APIs
        • Biotech APIs
        • Natural APIs
      • REST OF SOUTH AMERICA Active Pharmaceutical Ingredients Market by Formulation Type

        • Tablets
        • Injectables
        • Capsules
        • Others
      • REST OF SOUTH AMERICA Active Pharmaceutical Ingredients Market by Therapeutic Area Type

        • Cardiovascular
        • Oncology
        • Diabetes
        • Psychiatry
        • Infectious Diseases
      • REST OF SOUTH AMERICA Active Pharmaceutical Ingredients Market by Manufacturing Process Type

        • Batch Manufacturing
        • Continuous Manufacturing
        • Contract Manufacturing
    • MEA Outlook (USD Billion, 2019-2035)

      • MEA Active Pharmaceutical Ingredients Market by Type

        • Synthetic APIs
        • Biotech APIs
        • Natural APIs
      • MEA Active Pharmaceutical Ingredients Market by Formulation Type

        • Tablets
        • Injectables
        • Capsules
        • Others
      • MEA Active Pharmaceutical Ingredients Market by Therapeutic Area Type

        • Cardiovascular
        • Oncology
        • Diabetes
        • Psychiatry
        • Infectious Diseases
      • MEA Active Pharmaceutical Ingredients Market by Manufacturing Process Type

        • Batch Manufacturing
        • Continuous Manufacturing
        • Contract Manufacturing
      • MEA Active Pharmaceutical Ingredients Market by Regional Type

        • GCC Countries
        • South Africa
        • Rest of MEA
      • GCC COUNTRIES Outlook (USD Billion, 2019-2035)
      • GCC COUNTRIES Active Pharmaceutical Ingredients Market by Type

        • Synthetic APIs
        • Biotech APIs
        • Natural APIs
      • GCC COUNTRIES Active Pharmaceutical Ingredients Market by Formulation Type

        • Tablets
        • Injectables
        • Capsules
        • Others
      • GCC COUNTRIES Active Pharmaceutical Ingredients Market by Therapeutic Area Type

        • Cardiovascular
        • Oncology
        • Diabetes
        • Psychiatry
        • Infectious Diseases
      • GCC COUNTRIES Active Pharmaceutical Ingredients Market by Manufacturing Process Type

        • Batch Manufacturing
        • Continuous Manufacturing
        • Contract Manufacturing
      • SOUTH AFRICA Outlook (USD Billion, 2019-2035)
      • SOUTH AFRICA Active Pharmaceutical Ingredients Market by Type

        • Synthetic APIs
        • Biotech APIs
        • Natural APIs
      • SOUTH AFRICA Active Pharmaceutical Ingredients Market by Formulation Type

        • Tablets
        • Injectables
        • Capsules
        • Others
      • SOUTH AFRICA Active Pharmaceutical Ingredients Market by Therapeutic Area Type

        • Cardiovascular
        • Oncology
        • Diabetes
        • Psychiatry
        • Infectious Diseases
      • SOUTH AFRICA Active Pharmaceutical Ingredients Market by Manufacturing Process Type

        • Batch Manufacturing
        • Continuous Manufacturing
        • Contract Manufacturing
      • REST OF MEA Outlook (USD Billion, 2019-2035)
      • REST OF MEA Active Pharmaceutical Ingredients Market by Type

        • Synthetic APIs
        • Biotech APIs
        • Natural APIs
      • REST OF MEA Active Pharmaceutical Ingredients Market by Formulation Type

        • Tablets
        • Injectables
        • Capsules
        • Others
      • REST OF MEA Active Pharmaceutical Ingredients Market by Therapeutic Area Type

        • Cardiovascular
        • Oncology
        • Diabetes
        • Psychiatry
        • Infectious Diseases
      • REST OF MEA Active Pharmaceutical Ingredients Market by Manufacturing Process Type

        • Batch Manufacturing
        • Continuous Manufacturing
        • Contract Manufacturing


    Active Pharmaceutical Ingredients (API) Market Research Report - Forecast till 2035 Infographic
    Free Sample Request

    Kindly complete the form below to receive a free sample of this Report

    Customer Strories

    “I am very pleased with how market segments have been defined in a relevant way for my purposes (such as "Portable Freezers & refrigerators" and "last-mile"). In general the report is well structured. Thanks very much for your efforts.”

    Victoria Milne Founder
    Case Study

    Chemicals and Materials