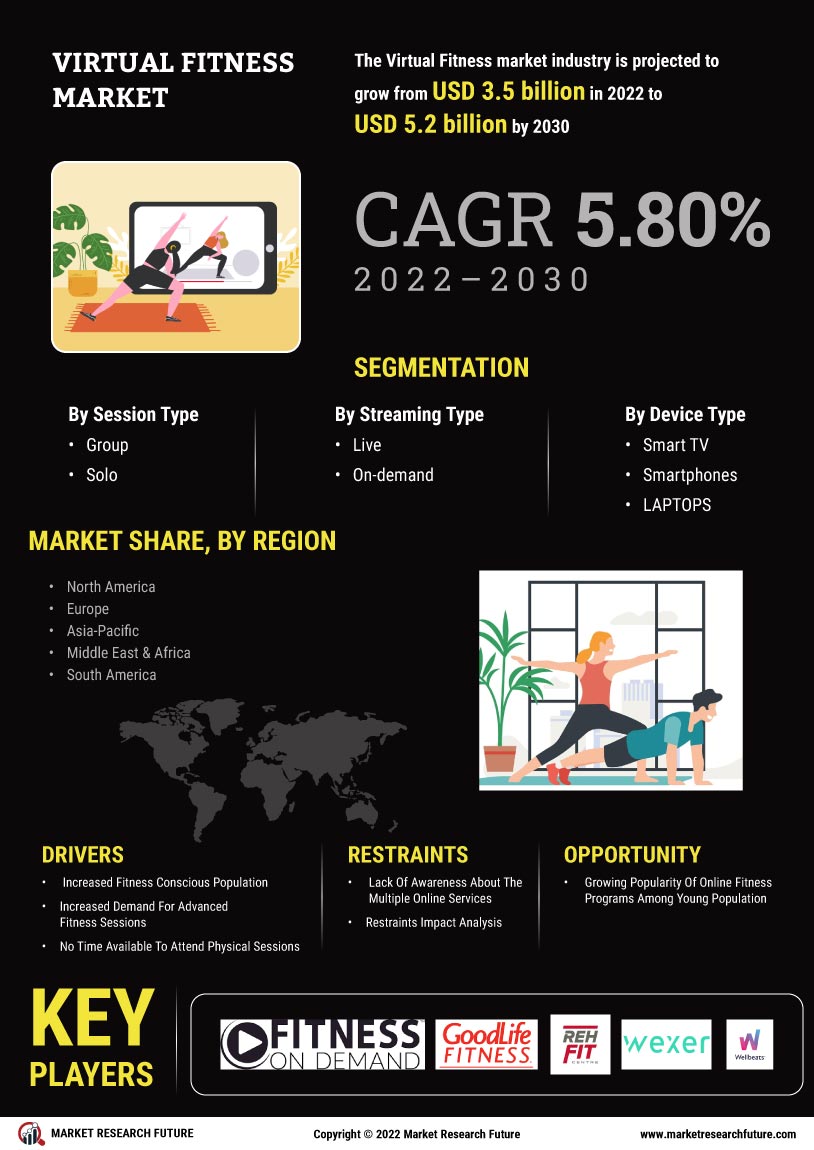


Segmentation du marché
Perspectives des types de séances de fitness virtuel (milliards USD, 2018-2030)
Groupe
Solo
Perspectives des types de streaming de fitness virtuel (milliards USD, 2018-2030)
En direct
À la demande
Perspectives des types de dispositifs de fitness virtuel (milliards USD, 2018-2030)
Smart TV
Smartphones
ORDINATEURS PORTABLES
Ordinateurs de bureau
Tablettes
Perspectives régionales du fitness virtuel (milliards USD, 2018-2030)
Perspectives de l'Amérique du Nord (milliards USD, 2018-2030)
Fitness virtuel en Amérique du Nord par type de séance
Groupe
Solo
Fitness virtuel en Amérique du Nord par type de streaming
En direct
À la demande
Fitness virtuel en Amérique du Nord par type de dispositif
Smart TV
Smartphones
ORDINATEURS PORTABLES
Ordinateurs de bureau
Tablettes
Perspectives des États-Unis (milliards USD, 2018-2030)
Fitness virtuel aux États-Unis par type de séance
Groupe
Solo
Fitness virtuel aux États-Unis par type de streaming
En direct
À la demande
Fitness virtuel aux États-Unis par type de dispositif
Smart TV
Smartphones
ORDINATEURS PORTABLES
Ordinateurs de bureau
Tablettes
Perspectives du Canada (milliards USD, 2018-2030)
Fitness virtuel au Canada par type de séance
Groupe
Solo
Fitness virtuel au Canada par type de streaming
En direct
À la demande
Fitness virtuel au Canada par type de dispositif
Smart TV
Smartphones
ORDINATEURS PORTABLES
Ordinateurs de bureau
Tablettes
Perspectives de l'Europe (milliards USD, 2018-2030)
Fitness virtuel en Europe par type de séance
Groupe
Solo
Fitness virtuel en Europe par type de streaming
En direct
À la demande
Fitness virtuel en Europe par type de dispositif
Smart TV
Smartphones
ORDINATEURS PORTABLES
Ordinateurs de bureau
Tablettes
Perspectives de l'Allemagne (milliards USD, 2018-2030)
Fitness virtuel en Allemagne par type de séance
Groupe
Solo
Fitness virtuel en Allemagne par type de streaming
En direct
À la demande
Fitness virtuel en Allemagne par type de dispositif
Smart TV
Smartphones
ORDINATEURS PORTABLES
Ordinateurs de bureau
Tablettes
Perspectives de la France (milliards USD, 2018-2030)
Fitness virtuel en France par type de séance
Groupe
Solo
Fitness virtuel en France par type de streaming
En direct
À la demande
Fitness virtuel en France par type de dispositif
Smart TV
Smartphones
ORDINATEURS PORTABLES
Ordinateurs de bureau
Tablettes
Perspectives du Royaume-Uni (milliards USD, 2018-2030)
Fitness virtuel au Royaume-Uni par type de séance
Groupe
Solo
Fitness virtuel au Royaume-Uni par type de streaming
En direct
À la demande
Fitness virtuel au Royaume-Uni par type de dispositif
Smart TV
Smartphones
ORDINATEURS PORTABLES
Ordinateurs de bureau
Tablettes
Perspectives de l'Italie (milliards USD, 2018-2030)
Fitness virtuel en Italie par type de séance
Groupe
Solo
Fitness virtuel en Italie par type de streaming
En direct
À la demande
Fitness virtuel en Italie par type de dispositif
Smart TV
Smartphones
ORDINATEURS PORTABLES
Ordinateurs de bureau
Tablettes
Perspectives de l'Espagne (milliards USD, 2018-2030)
Fitness virtuel en Espagne par type de séance
Groupe
Solo
Fitness virtuel en Espagne par type de streaming
En direct
À la demande
Fitness virtuel en Espagne par type de dispositif
Smart TV
Smartphones
ORDINATEURS PORTABLES
Ordinateurs de bureau
Tablettes
Perspectives du reste de l'Europe (milliards USD, 2018-2030)
Fitness virtuel dans le reste de l'Europe par type de séance
Groupe
Solo
Fitness virtuel dans le reste de l'Europe par type de streaming
En direct
À la demande
Fitness virtuel dans le reste de l'Europe par type de dispositif
Smart TV
Smartphones
ORDINATEURS PORTABLES
Ordinateurs de bureau
Tablettes
Perspectives de la région Asie-Pacifique (milliards USD, 2018-2030)
Fitness virtuel dans la région Asie-Pacifique par type de séance
Groupe
Solo
Fitness virtuel dans la région Asie-Pacifique par type de streaming
En direct
À la demande
Fitness virtuel dans la région Asie-Pacifique par type de dispositif
Smart TV
Smartphones
ORDINATEURS PORTABLES
Ordinateurs de bureau
Tablettes
Perspectives de la Chine (milliards USD, 2018-2030)
Fitness virtuel en Chine par type de séance
Groupe
Solo
Fitness virtuel en Chine par type de streaming
En direct
À la demande
Fitness virtuel en Chine par type de dispositif
Smart TV
Smartphones
ORDINATEURS PORTABLES
Ordinateurs de bureau
Tablettes
Perspectives du Japon (milliards USD, 2018-2030)
Fitness virtuel au Japon par type de séance
Groupe
Solo
Fitness virtuel au Japon par type de streaming
En direct
À la demande
Fitness virtuel au Japon par type de dispositif
Smart TV
Smartphones
ORDINATEURS PORTABLES
Ordinateurs de bureau
Tablettes
Perspectives de l'Inde (milliards USD, 2018-2030)
Fitness virtuel en Inde par type de séance
Groupe
Solo
Fitness virtuel en Inde par type de streaming
En direct
À la demande
Fitness virtuel en Inde par type de dispositif
Smart TV
Smartphones
ORDINATEURS PORTABLES
Ordinateurs de bureau
Tablettes
Perspectives de l'Australie (milliards USD, 2018-2030)
Fitness virtuel en Australie par type de séance
Groupe
Solo
Fitness virtuel en Australie par type de streaming
En direct
À la demande
Fitness virtuel en Australie par type de dispositif
Smart TV
Smartphones
ORDINATEURS PORTABLES
Ordinateurs de bureau
Tablettes
Perspectives du reste de la région Asie-Pacifique (milliards USD, 2018-2030)
Fitness virtuel dans le reste de la région Asie-Pacifique par type de séance
Groupe
Solo
Fitness virtuel dans le reste de la région Asie-Pacifique par type de streaming
En direct
À la demande
Fitness virtuel dans le reste de la région Asie-Pacifique par type de dispositif
Smart TV
Smartphones
ORDINATEURS PORTABLES
Ordinateurs de bureau
Tablettes
Perspectives du reste du monde (milliards USD, 2018-2030)
Fitness virtuel dans le reste du monde par type de séance
Groupe
Solo
Fitness virtuel dans le reste du monde par type de streaming
En direct
À la demande
Fitness virtuel dans le reste du monde par type de dispositif
Smart TV
Smartphones
ORDINATEURS PORTABLES
Ordinateurs de bureau
Tablettes
Perspectives du Moyen-Orient (milliards USD, 2018-2030)
Fitness virtuel au Moyen-Orient par type de séance
Groupe
Solo
Fitness virtuel au Moyen-Orient par type de streaming
En direct
À la demande
Fitness virtuel au Moyen-Orient par type de dispositif
Smart TV
Smartphones
ORDINATEURS PORTABLES
Ordinateurs de bureau
Tablettes
Perspectives de l'Afrique (milliards USD, 2018-2030)
Fitness virtuel en Afrique par type de séance
Groupe
Solo
Fitness virtuel en Afrique par type de streaming
En direct
À la demande
Fitness virtuel en Afrique par type de dispositif
Smart TV
Smartphones
ORDINATEURS PORTABLES
Ordinateurs de bureau
Tablettes
Perspectives de l'Amérique latine (milliards USD, 2018-2030)
Fitness virtuel en Amérique latine par type de séance
Groupe
Solo
Fitness virtuel en Amérique latine par type de streaming
En direct
À la demande
Fitness virtuel en Amérique latine par type de dispositif
Smart TV
Smartphones
ORDINATEURS PORTABLES
Ordinateurs de bureau
Tablettes


