Request Free Sample ×

Kindly complete the form below to receive a free sample of this Report

* Please use a valid business email

Leading companies partner with us for data-driven Insights

clients tt-cursor
Hero Background

Energy as a Service Market

ID: MRFR/ICT/5146-HCR
200 Pages
Nirmit Biswas
Last Updated: April 06, 2026

Informe de investigación de mercado de Energía como Servicio (EaaS) por tipo de servicio (servicios de gestión energética, servicios de respuesta a la demanda, servicios de gestión de recursos energéticos distribuidos, servicios de suministro de energía), por usuario final (residencial, comercial, industrial, gubernamental), por fuente de energía (energía renovable, energía convencional, energía híbrida), por tipo de solución (soluciones de software, soluciones de hardware, soluciones integradas) y por región (Norteamérica, Europa, Sudamérica, Asia Pacífico, Oriente Medio y África): pronóstico hasta 2035.

Compartir
Download PDF ×

We do not share your information with anyone. However, we may send you emails based on your report interest from time to time. You may contact us at any time to opt-out.

Energy as a Service Market Infographic
Purchase Options
  1. ÍNDICE
  2. RESUMEN EJECUTIVO
  3. 1.1. Descripción general del mercado
  4. 1.2. Hallazgos clave
  5. 1.3. Segmentación del mercado
  6. 1.4. Panorama competitivo
  7. 1.5. Desafíos y oportunidades
  8. 1.6. Perspectivas futuras
  9. INTRODUCCIÓN AL MERCADO
  10. 2.1. Definición
  11. 2.2. Alcance del estudio
  12. 2.2.1. Objetivo de la investigación
  13. 2.2.2. Supuesto
  14. 2.2.3. Limitaciones
  15. METODOLOGÍA DE LA INVESTIGACIÓN
  16. 3.1. Descripción general
  17. 3.2. Minería de datos
  18. 3.3. Investigación secundaria
  19. 3.4. Investigación primaria
  20. 3.4.1. Entrevistas primarias y proceso de recopilación de información
  21. 3.4.2. Desglose de los encuestados primarios
  22. 3.5. Modelo de pronóstico
  23. 3.6. Estimación del tamaño del mercado
  24. 3.6.1. Enfoque ascendente
  25. 3.6.2. Enfoque descendente
  26. 3.7. Triangulación de datos
  27. 3.8. Validación
  28. DINÁMICA DEL MERCADO
  29. 4.1. Descripción general
  30. 4.2. Impulsores
  31. 4.3. Restricciones
  32. 4.4. Oportunidades
  33. ANÁLISIS DE FACTORES DE MERCADO
  34. 5.1. Análisis de la cadena de valor
  35. 5.2. Análisis de las cinco fuerzas de Porter
  36. 5.2.1. Poder de negociación de los proveedores
  37. 5.2.2. Poder de negociación de los compradores
  38. 5.2.3. Amenaza de nuevos participantes
  39. 5.2.4. Amenaza de sustitutos
  40. 5.2.5. Intensidad de la rivalidad
  41. 5.3. Análisis del impacto de la COVID-19
  42. 5.3.1. Análisis del impacto en el mercado
  43. 5.3.2. Impacto regional
  44. 5.3.3. Análisis de oportunidades y amenazas
  45. MERCADO DE ENERGÍA COMO SERVICIO (EAAS), POR TIPO DE SERVICIO (MILES DE MILLONES DE USD)
  46. 6.1. Servicios de gestión energética
  47. 6.2. Servicios de Respuesta a la Demanda
  48. 6.3. Servicios de Gestión de Recursos Energéticos Distribuidos
  49. 6.4. Servicios de Suministro de Energía
  50. MERCADO DE ENERGÍA COMO SERVICIO (EAAS), POR USUARIO FINAL (MILES DE MILLONES DE USD)
  51. 7.1. Residencial
  52. 7.2. Comercial
  53. 7.3. Industrial
  54. 7.4. Gobierno
  55. MERCADO DE ENERGÍA COMO SERVICIO (EAAS), POR FUENTE DE ENERGÍA (MILES DE MILLONES DE USD)
  56. 8.1. Energía renovable
  57. 8.2. Energía convencional
  58. 8.3. Energía híbrida
  59. MERCADO DE ENERGÍA COMO SERVICIO (EAAS), POR TIPO DE SOLUCIÓN (MILES DE MILLONES DE USD)
  60. 9.1. Soluciones de software
  61. 9.2. Soluciones de hardware
  62. 9.3. Soluciones integradas
  63. MERCADO DE ENERGÍA COMO SERVICIO (EAAS), POR REGION (MILES DE MILLONES DE USD)
  64. 10.1. Norteamérica
  65. 10.1.1. EE. UU.
  66. 10.1.2. Canadá
  67. 10.2. Europa
  68. 10.2.1. Alemania
  69. 10.2.2. Reino Unido
  70. 10.2.3. Francia
  71. 10.2.4. Rusia
  72. 10.2.5. Italia
  73. 10.2.6. España
  74. 10.2.7. Resto de Europa
  75. 10.3. APAC
  76. 10.3.1. China
  77. 10.3.2. India
  78. 10.3.3. Japón
  79. 10.3.4. Corea del Sur
  80. 10.3.5. Malasia
  81. 10.3.6. Tailandia
  82. 10.3.7. Indonesia
  83. 10.3.8. Resto de APAC
  84. 10.4. Sudamérica
  85. 10.4.1. Brasil
  86. 10.4.2. México
  87. 10.4.3. Argentina
  88. 10.4.4. Resto de Sudamérica
  89. 10.5. MEA
  90. 10.5.1. Países del CCG
  91. 10.5.2. Sudáfrica
  92. 10.5.3. Resto de MEA
  93. PANORAMA COMPETITIVO
  94. 11.1. Descripción general
  95. 11.2. Análisis competitivo
  96. 11.3. Análisis de la cuota de mercado
  97. 11.4. Estrategia de crecimiento importante en el mercado de energía como servicio (EaaS)
  98. 11.5. Benchmarking competitivo
  99. 11.6. Actores líderes en términos de número de desarrollos en el mercado de energía como servicio (EaaS)
  100. 11.7. Desarrollos clave y estrategias de crecimiento
  101. 11.7.1. Lanzamiento de nuevos productos/Implementación de servicios
  102. 11.7.2. Fusiones y adquisiciones
  103. 11.7.3. Empresas conjuntas
  104. 11.8. Matriz financiera de los principales actores
  105. 11.8.1. Ventas e ingresos operativos
  106. 11.8.2. Gasto en I+D de los principales actores. 2023
  107. PERFILES DE LAS EMPRESAS
  108. 12.1. IBM
  109. 12.1.1. Resumen financiero
  110. 12.1.2. Productos ofrecidos
  111. 12.1.3. Desarrollos clave
  112. 12.1.4. Análisis FODA
  113. 12.1.5. Estrategias clave
  114. 12.2. NextEra Energy
  115. 12.2.1. Descripción general financiera
  116. 12.2.2. Productos ofrecidos
  117. 12.2.3. Desarrollos clave
  118. 12.2.4. Análisis FODA
  119. 12.2.5. Estrategias clave
  120. 12.3. Pacific Gas and Electric
  121. 12.3.1. Descripción general financiera
  122. 12.3.2. Productos ofrecidos
  123. 12.3.3. Desarrollos clave
  124. 12.3.4. Análisis FODA
  125. 12.3.5. Estrategias clave
  126. 12.4. Shell
  127. 12.4.1. Resumen financiero
  128. 12.4.2. Productos ofrecidos
  129. 12.4.3. Desarrollos clave
  130. 12.4.4. Análisis FODA
  131. 12.4.5. Estrategias clave
  132. 12.5. Energía real
  133. 12.5.1. Resumen financiero
  134. 12.5.2. Productos ofrecidos
  135. 12.5.3. Desarrollos clave
  136. 12.5.4. Análisis FODA
  137. 12.5.5. Estrategias clave
  138. 12.6. E.ON
  139. 12.6.1. Resumen financiero
  140. 12.6.2. Productos ofrecidos
  141. 12.6.3. Desarrollos clave
  142. 12.6.4. Análisis FODA
  143. 12.6.5. Estrategias clave
  144. 12.7. Enel
  145. 12.7.1. Resumen financiero
  146. 12.7.2. Productos ofrecidos
  147. 12.7.3. Desarrollos clave
  148. 12.7.4. Análisis FODA
  149. 12.7.5. Estrategias clave
  150. 12.8. Schneider Electric
  151. 12.8.1. Resumen financiero
  152. 12.8.2. Productos ofrecidos
  153. 12.8.3. Desarrollos clave
  154. 12.8.4. Análisis FODA
  155. 12.8.5. Estrategias clave
  156. 12.9. Duke Energy
  157. 12.9.1. Descripción general financiera
  158. 12.9.2. Productos ofrecidos
  159. 12.9.3. Desarrollos clave
  160. 12.9.4. Análisis FODA
  161. 12.9.5. Estrategias clave
  162. 12.10. Wipro
  163. 12.10.1. Resumen financiero
  164. 12.10.2. Productos ofrecidos
  165. 12.10.3. Desarrollos clave
  166. 12.10.4. Análisis FODA
  167. 12.10.5. Estrategias clave
  168. 12.11. Engie
  169. 12.11.1. Resumen financiero
  170. 12.11.2. Productos ofrecidos
  171. 12.11.3. Desarrollos clave
  172. 12.11.4. Análisis FODA
  173. 12.11.5. Estrategias clave
  174. 12.12. Honeywell
  175. 12.12.1. Resumen financiero
  176. 12.12.2. Productos ofrecidos
  177. 12.12.3. Desarrollos clave
  178. 12.12.4. Análisis FODA
  179. 12.12.5. Estrategias clave
  180. 12.13. C3.ai
  181. 12.13.1. Resumen financiero
  182. 12.13.2. Productos ofrecidos
  183. 12.13.3. Desarrollos clave
  184. 12.13.4. Análisis FODA
  185. 12.13.5. Estrategias clave
  186. 12.14. Siemens
  187. 12.14.1. Resumen financiero
  188. 12.14.2. Productos ofrecidos
  189. 12.14.3. Desarrollos clave
  190. 12.14.4. Análisis FODA
  191. 12.14.5. Estrategias clave
  192. 12.15. General Electric
  193. 12.15.1. Resumen financiero
  194. 12.15.2. Productos ofrecidos
  195. 12.15.3. Desarrollos clave
  196. 12.15.4. Análisis FODA
  197. 12.15.5. Estrategias clave
  198. APÉNDICE
  199. 13.1. Referencias
  200. 13.2. Informes relacionados
  201. LISTA DE TABLAS
  202. TABLA 1. LISTA DE SUPUESTOS
  203. TABLA 2. ESTIMACIONES Y PRONÓSTICOS DEL TAMAÑO DEL MERCADO DE ENERGÍA COMO SERVICIO (EAAS) DE AMÉRICA DEL NORTE, POR TIPO DE SERVICIO, 2019-2035 (MILES DE MILLONES DE USD)
  204. TABLA 3. ESTIMACIONES Y PRONÓSTICOS DEL TAMAÑO DEL MERCADO DE ENERGÍA COMO SERVICIO (EAAS) DE AMÉRICA DEL NORTE PRONÓSTICO, POR USUARIO FINAL, 2019-2035 (MILES DE MILLONES DE USD)
  205. TABLA 4. ESTIMACIONES Y PRONÓSTICOS DEL TAMAÑO DEL MERCADO DE ENERGÍA COMO SERVICIO (EAAS) DE AMÉRICA DEL NORTE, POR FUENTE DE ENERGÍA, 2019-2035 (MILES DE MILLONES DE USD)
  206. TABLA 5. ESTIMACIONES Y PRONÓSTICOS DEL TAMAÑO DEL MERCADO DE ENERGÍA COMO SERVICIO (EAAS) DE AMÉRICA DEL NORTE, POR TIPO DE SOLUCIÓN, 2019-2035 (MILES DE MILLONES DE USD)
  207. TABLA 6. ESTIMACIONES Y PRONÓSTICOS DEL TAMAÑO DEL MERCADO DE ENERGÍA COMO SERVICIO (EAAS) DE AMÉRICA DEL NORTE PRONÓSTICO, POR REGION, 2019-2035 (MILES DE MILLONES DE USD)
  208. TABLA 7. ESTIMACIONES Y PRONÓSTICOS DEL TAMAÑO DEL MERCADO DE ENERGÍA COMO SERVICIO (EAAS) DE EE. UU., POR TIPO DE SERVICIO, 2019-2035 (MILES DE MILLONES DE USD)
  209. TABLA 8. ESTIMACIONES Y PRONÓSTICOS DEL TAMAÑO DEL MERCADO DE ENERGÍA COMO SERVICIO (EAAS) DE EE. UU., POR USUARIO FINAL, 2019-2035 (MILES DE MILLONES DE USD)
  210. TABLA 9. ESTIMACIONES Y PRONÓSTICOS DEL TAMAÑO DEL MERCADO DE ENERGÍA COMO SERVICIO (EAAS) DE EE. UU. PRONÓSTICO, POR FUENTE DE ENERGÍA, 2019-2035 (MILES DE MILLONES DE USD)
  211. TABLA 10. ESTIMACIONES Y PRONÓSTICOS DEL TAMAÑO DEL MERCADO DE ENERGÍA COMO SERVICIO (EAAS) DE EE. UU., POR TIPO DE SOLUCIÓN, 2019-2035 (MILES DE MILLONES DE USD)
  212. TABLA 11. ESTIMACIONES Y PRONÓSTICOS DEL TAMAÑO DEL MERCADO DE ENERGÍA COMO SERVICIO (EAAS) DE EE. UU., POR REGION, 2019-2035 (MILES DE MILLONES DE USD)
  213. TABLA 12. ESTIMACIONES Y PRONÓSTICOS DEL TAMAÑO DEL MERCADO DE ENERGÍA COMO SERVICIO (EAAS) DE CANADÁ, POR TIPO DE SERVICIO, 2019-2035 (MILES DE MILLONES DE USD)
  214. TABLA 13. ESTIMACIONES Y PRONÓSTICOS DEL TAMAÑO DEL MERCADO DE ENERGÍA COMO SERVICIO (EAAS) DE CANADÁ, POR TIPO DE SERVICIO, 2019-2035 (MILES DE MILLONES DE USD)
  215. TABLA 13. ESTIMACIONES Y PRONÓSTICOS DEL TAMAÑO DEL MERCADO DE ENERGÍA COMO SERVICIO (EAAS) DE CANADÁ, PRONÓSTICO, POR USUARIO FINAL, 2019-2035 (MILES DE MILLONES DE USD)
  216. TABLA 14. ESTIMACIONES Y PRONÓSTICOS DEL TAMAÑO DEL MERCADO DE ENERGÍA COMO SERVICIO (EAAS) DE CANADÁ, POR FUENTE DE ENERGÍA, 2019-2035 (MILES DE MILLONES DE USD)
  217. TABLA 15. ESTIMACIONES Y PRONÓSTICOS DEL TAMAÑO DEL MERCADO DE ENERGÍA COMO SERVICIO (EAAS) DE CANADÁ PRONÓSTICO, POR TIPO DE SOLUCIÓN, 2019-2035 (MILES DE MILLONES DE USD)
  218. TABLA 16. CANADÁ ESTIMACIONES Y PRONÓSTICOS DEL TAMAÑO DEL MERCADO DE ENERGÍA COMO SERVICIO (EAAS), POR REGION, 2019-2035 (MILES DE MILLONES DE USD)
  219. TABLA 17. EUROPA ESTIMACIONES Y PRONÓSTICOS DEL TAMAÑO DEL MERCADO DE ENERGÍA COMO SERVICIO (EAAS) PRONÓSTICO, POR TIPO DE SERVICIO, 2019-2035 (MILES DE MILLONES DE USD)
  220. TABLA 18. ESTIMACIONES Y PRONÓSTICOS DEL TAMAÑO DEL MERCADO DE ENERGÍA COMO SERVICIO (EAAS) EN EUROPA, POR USUARIO FINAL, 2019-2035 (MILES DE MILLONES DE USD)
  221. TABLA 19. ESTIMACIONES Y PRONÓSTICOS DEL TAMAÑO DEL MERCADO DE ENERGÍA COMO SERVICIO (EAAS) EN EUROPA, PRONÓSTICO, POR FUENTE DE ENERGÍA, 2019-2035 (MILES DE MILLONES DE USD)
  222. TABLA 20. ESTIMACIONES Y PRONÓSTICOS DEL TAMAÑO DEL MERCADO DE ENERGÍA COMO SERVICIO (EAAS) EN EUROPA, POR TIPO DE SOLUCIÓN, 2019-2035 (MILES DE MILLONES DE USD)
  223. TABLA 21. ESTIMACIONES Y PRONÓSTICOS DEL TAMAÑO DEL MERCADO DE ENERGÍA COMO SERVICIO (EAAS) EN EUROPA, PRONÓSTICO, POR REGION, 2019-2035 (MILES DE MILLONES DE USD)
  224. TABLA 22. ESTIMACIONES Y PRONÓSTICOS DEL TAMAÑO DEL MERCADO DE ENERGÍA COMO SERVICIO (EAAS) EN ALEMANIA, POR TIPO DE SERVICIO, 2019-2035 (MILES DE MILLONES DE USD)
  225. TABLA 23. ESTIMACIONES Y PRONÓSTICOS DEL TAMAÑO DEL MERCADO DE ENERGÍA COMO SERVICIO (EAAS) EN ALEMANIA, PRONÓSTICO, POR USUARIO FINAL, 2019-2035 (MILES DE MILLONES DE USD)
  226. TABLA 24. ESTIMACIONES Y PRONÓSTICOS DEL TAMAÑO DEL MERCADO DE ENERGÍA COMO SERVICIO (EAAS) DE ALEMANIA, POR FUENTE DE ENERGÍA, 2019-2035 (MILES DE MILLONES DE USD)
  227. TABLA 25. ESTIMACIONES Y PRONÓSTICOS DEL TAMAÑO DEL MERCADO DE ENERGÍA COMO SERVICIO (EAAS) DE ALEMANIA PRONÓSTICO, POR TIPO DE SOLUCIÓN, 2019-2035 (MILES DE MILLONES DE USD)
  228. TABLA 26. ESTIMACIONES Y PRONÓSTICOS DEL TAMAÑO DEL MERCADO DE ENERGÍA COMO SERVICIO (EAAS) DE ALEMANIA, POR REGION, 2019-2035 (MILES DE MILLONES DE USD)
  229. TABLA 27. ESTIMACIONES Y PRONÓSTICOS DEL TAMAÑO DEL MERCADO DE ENERGÍA COMO SERVICIO (EAAS) DEL REINO UNIDO PRONÓSTICO, POR TIPO DE SERVICIO, 2019-2035 (MILES DE MILLONES DE USD)
  230. TABLA 28. ESTIMACIONES Y PRONÓSTICOS DEL TAMAÑO DEL MERCADO DE ENERGÍA COMO SERVICIO (EAAS) DEL REINO UNIDO, POR USUARIO FINAL, 2019-2035 (MILES DE MILLONES DE USD)
  231. TABLA 29. ESTIMACIONES Y PRONÓSTICOS DEL TAMAÑO DEL MERCADO DE ENERGÍA COMO SERVICIO (EAAS) DEL REINO UNIDO, PRONÓSTICO, POR FUENTE DE ENERGÍA, 2019-2035 (MILES DE MILLONES DE USD)
  232. TABLA 30. ESTIMACIONES Y PRONÓSTICOS DEL TAMAÑO DEL MERCADO DE ENERGÍA COMO SERVICIO (EAAS) DEL REINO UNIDO, POR TIPO DE SOLUCIÓN, 2019-2035 (MILES DE MILLONES DE USD)
  233. TABLA 31. ESTIMACIONES Y PRONÓSTICOS DEL TAMAÑO DEL MERCADO DE ENERGÍA COMO SERVICIO (EAAS) DEL REINO UNIDO PRONÓSTICO, POR REGION, 2019-2035 (MILES DE MILLONES DE USD)
  234. TABLA 32. ESTIMACIONES Y PRONÓSTICOS DEL TAMAÑO DEL MERCADO DE ENERGÍA COMO SERVICIO (EAAS) EN FRANCIA, POR TIPO DE SERVICIO, 2019-2035 (MILES DE MILLONES DE USD)
  235. TABLA 33. ESTIMACIONES Y PRONÓSTICOS DEL TAMAÑO DEL MERCADO DE ENERGÍA COMO SERVICIO (EAAS) EN FRANCIA, PRONÓSTICO, POR USUARIO FINAL, 2019-2035 (MILES DE MILLONES DE USD)
  236. TABLA 34. ESTIMACIONES Y PRONÓSTICOS DEL TAMAÑO DEL MERCADO DE ENERGÍA COMO SERVICIO (EAAS) EN FRANCIA, POR FUENTE DE ENERGÍA, 2019-2035 (MILES DE MILLONES DE USD)
  237. TABLA 35. ESTIMACIONES Y PRONÓSTICOS DEL TAMAÑO DEL MERCADO DE ENERGÍA COMO SERVICIO (EAAS) EN FRANCIA, PRONÓSTICO, POR TIPO DE SOLUCIÓN, 2019-2035 (MILES DE MILLONES DE USD)
  238. TABLA 36. FRANCIA ESTIMACIONES Y PRONÓSTICOS DEL TAMAÑO DEL MERCADO DE ENERGÍA COMO SERVICIO (EAAS), POR REGION, 2019-2035 (MILES DE MILLONES DE USD)
  239. TABLA 37. RUSIA ESTIMACIONES Y PRONÓSTICOS DEL TAMAÑO DEL MERCADO DE ENERGÍA COMO SERVICIO (EAAS) PRONÓSTICO, POR TIPO DE SERVICIO, 2019-2035 (MILES DE MILLONES DE USD)
  240. TABLA 38. ESTIMACIONES Y PRONÓSTICOS DEL TAMAÑO DEL MERCADO DE ENERGÍA COMO SERVICIO (EAAS) EN RUSIA, POR USUARIO FINAL, 2019-2035 (MILES DE MILLONES DE USD)
  241. TABLA 39. ESTIMACIONES Y PRONÓSTICOS DEL TAMAÑO DEL MERCADO DE ENERGÍA COMO SERVICIO (EAAS) EN RUSIA, PRONÓSTICO, POR FUENTE DE ENERGÍA, 2019-2035 (MILES DE MILLONES DE USD)
  242. TABLA 40. ESTIMACIONES Y PRONÓSTICOS DEL TAMAÑO DEL MERCADO DE ENERGÍA COMO SERVICIO (EAAS) EN RUSIA, POR TIPO DE SOLUCIÓN, 2019-2035 (MILES DE MILLONES DE USD)
  243. TABLA 41. ESTIMACIONES Y PRONÓSTICOS DEL TAMAÑO DEL MERCADO DE ENERGÍA COMO SERVICIO (EAAS) EN RUSIA PRONÓSTICO, POR REGION, 2019-2035 (MILES DE MILLONES DE USD)
  244. TABLA 42. ITALIA ESTIMACIONES Y PRONÓSTICOS DEL TAMAÑO DEL MERCADO DE ENERGÍA COMO SERVICIO (EAAS), POR TIPO DE SERVICIO, 2019-2035 (MILES DE MILLONES DE USD)
  245. TABLA 43. ITALIA ESTIMACIONES Y PRONÓSTICOS DEL TAMAÑO DEL MERCADO DE ENERGÍA COMO SERVICIO (EAAS) PRONÓSTICO, POR USUARIO FINAL, 2019-2035 (MILES DE MILLONES DE USD)
  246. TABLA 44. ITALIA ESTIMACIONES Y PRONÓSTICOS DEL TAMAÑO DEL MERCADO DE ENERGÍA COMO SERVICIO (EAAS), POR FUENTE DE ENERGÍA, 2019-2035 (MILES DE MILLONES DE USD)
  247. TABLA 45. ITALIA ESTIMACIONES Y PRONÓSTICOS DEL TAMAÑO DEL MERCADO DE ENERGÍA COMO SERVICIO (EAAS) PRONÓSTICO, POR TIPO DE SOLUCIÓN, 2019-2035 (MILES DE MILLONES DE USD)
  248. TABLA 46. ITALIA ESTIMACIONES Y PRONÓSTICOS DEL TAMAÑO DEL MERCADO DE ENERGÍA COMO SERVICIO (EAAS), POR REGION, 2019-2035 (MILES DE MILLONES DE USD)
  249. TABLA 47. ESPAÑA ESTIMACIONES Y PRONÓSTICOS DEL TAMAÑO DEL MERCADO DE ENERGÍA COMO SERVICIO (EAAS) PRONÓSTICO, POR TIPO DE SERVICIO, 2019-2035 (MILES DE MILLONES DE USD)
  250. TABLA 48. ESTIMACIONES Y PRONÓSTICOS DEL TAMAÑO DEL MERCADO DE ENERGÍA COMO SERVICIO (EAAS) EN ESPAÑA, POR USUARIO FINAL, 2019-2035 (MILES DE MILLONES DE USD)
  251. TABLA 49. ESTIMACIONES Y PRONÓSTICOS DEL TAMAÑO DEL MERCADO DE ENERGÍA COMO SERVICIO (EAAS) EN ESPAÑA, PRONÓSTICO, POR FUENTE DE ENERGÍA, 2019-2035 (MILES DE MILLONES DE USD)
  252. TABLA 50. ESTIMACIONES Y PRONÓSTICOS DEL TAMAÑO DEL MERCADO DE ENERGÍA COMO SERVICIO (EAAS) EN ESPAÑA, POR TIPO DE SOLUCIÓN, 2019-2035 (MILES DE MILLONES DE USD)
  253. TABLA 51. ESTIMACIONES Y PRONÓSTICOS DEL TAMAÑO DEL MERCADO DE ENERGÍA COMO SERVICIO (EAAS) EN ESPAÑA, PRONÓSTICO, POR REGION, 2019-2035 (MILES DE MILLONES DE USD)
  254. TABLA 52. RESTO DE EUROPA ESTIMACIONES Y PRONÓSTICOS DEL TAMAÑO DEL MERCADO DE ENERGÍA COMO SERVICIO (EAAS), POR TIPO DE SERVICIO, 2019-2035 (MILES DE MILLONES DE USD)
  255. TABLA 53. RESTO DE EUROPA ESTIMACIONES Y PRONÓSTICOS DEL TAMAÑO DEL MERCADO DE ENERGÍA COMO SERVICIO (EAAS) PRONÓSTICO, POR USUARIO FINAL, 2019-2035 (MILES DE MILLONES DE USD)
  256. TABLA 54. ESTIMACIONES Y PRONÓSTICOS DEL TAMAÑO DEL MERCADO DE ENERGÍA COMO SERVICIO (EAAS) EN EL RESTO DE EUROPA, POR FUENTE DE ENERGÍA, 2019-2035 (MILES DE MILLONES DE USD)
  257. TABLA 55. ESTIMACIONES Y PRONÓSTICOS DEL TAMAÑO DEL MERCADO DE ENERGÍA COMO SERVICIO (EAAS) EN EL RESTO DE EUROPA PRONÓSTICO, POR TIPO DE SOLUCIÓN, 2019-2035 (MILES DE MILLONES DE USD)
  258. TABLA 56. RESTO DE EUROPA ESTIMACIONES Y PRONÓSTICOS DEL TAMAÑO DEL MERCADO DE ENERGÍA COMO SERVICIO (EAAS), POR REGION, 2019-2035 (MILES DE MILLONES DE USD)
  259. TABLA 57. APAC ESTIMACIONES Y PRONÓSTICOS DEL TAMAÑO DEL MERCADO DE ENERGÍA COMO SERVICIO (EAAS) PRONÓSTICO, POR TIPO DE SERVICIO, 2019-2035 (MILES DE MILLONES DE USD)
  260. TABLA 58. ESTIMACIONES Y PRONÓSTICOS DEL TAMAÑO DEL MERCADO DE ENERGÍA COMO SERVICIO (EAAS) DE APAC, POR USUARIO FINAL, 2019-2035 (MILES DE MILLONES DE USD)
  261. TABLA 59. ESTIMACIONES Y PRONÓSTICOS DEL TAMAÑO DEL MERCADO DE ENERGÍA COMO SERVICIO (EAAS) DE APAC, PRONÓSTICO, POR FUENTE DE ENERGÍA, 2019-2035 (MILES DE MILLONES DE USD)
  262. TABLA 60. ESTIMACIONES Y PRONÓSTICOS DEL TAMAÑO DEL MERCADO DE ENERGÍA COMO SERVICIO (EAAS) DE APAC, POR TIPO DE SOLUCIÓN, 2019-2035 (MILES DE MILLONES DE USD)
  263. TABLA 61. ESTIMACIONES Y PRONÓSTICOS DEL TAMAÑO DEL MERCADO DE ENERGÍA COMO SERVICIO (EAAS) DE APAC, PRONÓSTICO, POR REGION, 2019-2035 (MILES DE MILLONES DE USD)
  264. TABLA 62. ESTIMACIONES Y PRONÓSTICOS DEL TAMAÑO DEL MERCADO DE ENERGÍA COMO SERVICIO (EAAS) DE CHINA, POR TIPO DE SERVICIO, 2019-2035 (MILES DE MILLONES DE USD)
  265. TABLA 63. ESTIMACIONES Y PRONÓSTICOS DEL TAMAÑO DEL MERCADO DE ENERGÍA COMO SERVICIO (EAAS) DE CHINA PRONÓSTICO, POR USUARIO FINAL, 2019-2035 (MILES DE MILLONES DE USD)
  266. TABLA 64. ESTIMACIONES Y PRONÓSTICOS DEL TAMAÑO DEL MERCADO DE ENERGÍA COMO SERVICIO (EAAS) DE CHINA, POR FUENTE DE ENERGÍA, 2019-2035 (MILES DE MILLONES DE USD)
  267. TABLA 65. ESTIMACIONES Y PRONÓSTICOS DEL TAMAÑO DEL MERCADO DE ENERGÍA COMO SERVICIO (EAAS) DE CHINA PRONÓSTICO, POR TIPO DE SOLUCIÓN, 2019-2035 (MILES DE MILLONES DE USD)
  268. TABLA 66. ESTIMACIONES Y PRONÓSTICOS DEL TAMAÑO DEL MERCADO DE ENERGÍA COMO SERVICIO (EAAS) DE CHINA, POR REGION, 2019-2035 (MILES DE MILLONES DE USD)
  269. TABLA 67. ESTIMACIONES Y PRONÓSTICOS DEL TAMAÑO DEL MERCADO DE ENERGÍA COMO SERVICIO (EAAS) DE INDIA PRONÓSTICO, POR TIPO DE SERVICIO, 2019-2035 (MILES DE MILLONES DE USD)
  270. TABLA 68. ESTIMACIONES Y PRONÓSTICOS DEL TAMAÑO DEL MERCADO DE ENERGÍA COMO SERVICIO (EAAS) EN INDIA, POR USUARIO FINAL, 2019-2035 (MILES DE MILLONES DE USD)
  271. TABLA 69. ESTIMACIONES Y PRONÓSTICOS DEL TAMAÑO DEL MERCADO DE ENERGÍA COMO SERVICIO (EAAS) EN INDIA, PRONÓSTICO, POR FUENTE DE ENERGÍA, 2019-2035 (MILES DE MILLONES DE USD)
  272. TABLA 70. ESTIMACIONES Y PRONÓSTICOS DEL TAMAÑO DEL MERCADO DE ENERGÍA COMO SERVICIO (EAAS) EN INDIA, POR TIPO DE SOLUCIÓN, 2019-2035 (MILES DE MILLONES DE USD)
  273. TABLA 71. ESTIMACIONES Y PRONÓSTICOS DEL TAMAÑO DEL MERCADO DE ENERGÍA COMO SERVICIO (EAAS) EN INDIA, PRONÓSTICO, POR REGION, 2019-2035 (MILES DE MILLONES DE USD)
  274. TABLA 72. ESTIMACIONES Y PRONÓSTICOS DEL TAMAÑO DEL MERCADO DE ENERGÍA COMO SERVICIO (EAAS) EN JAPÓN, POR TIPO DE SERVICIO, 2019-2035 (MILES DE MILLONES DE USD)
  275. TABLA 73. ESTIMACIONES Y PRONÓSTICOS DEL TAMAÑO DEL MERCADO DE ENERGÍA COMO SERVICIO (EAAS) EN JAPÓN, PRONÓSTICO, POR USUARIO FINAL, 2019-2035 (MILES DE MILLONES DE USD)
  276. TABLA 74. ESTIMACIONES Y PRONÓSTICOS DEL TAMAÑO DEL MERCADO DE ENERGÍA COMO SERVICIO (EAAS) EN JAPÓN, POR FUENTE DE ENERGÍA, 2019-2035 (MILES DE MILLONES DE USD)
  277. TABLA 75. ESTIMACIONES Y PRONÓSTICOS DEL TAMAÑO DEL MERCADO DE ENERGÍA COMO SERVICIO (EAAS) EN JAPÓN PRONÓSTICO, POR TIPO DE SOLUCIÓN, 2019-2035 (MILES DE MILLONES DE USD)
  278. TABLA 76. ESTIMACIONES Y PRONÓSTICOS DEL TAMAÑO DEL MERCADO DE ENERGÍA COMO SERVICIO (EAAS) EN JAPÓN, POR REGION, 2019-2035 (MILES DE MILLONES DE USD)
  279. TABLA 77. COREA DEL SUR ESTIMACIONES Y PRONÓSTICOS DEL TAMAÑO DEL MERCADO DE ENERGÍA COMO SERVICIO (EAAS) PRONÓSTICO, POR TIPO DE SERVICIO, 2019-2035 (MILES DE MILLONES DE USD)
  280. TABLA 78. ESTIMACIONES Y PRONÓSTICOS DEL TAMAÑO DEL MERCADO DE ENERGÍA COMO SERVICIO (EAAS) DE COREA DEL SUR, POR USUARIO FINAL, 2019-2035 (MILES DE MILLONES DE USD)
  281. TABLA 79. ESTIMACIONES Y PRONÓSTICOS DEL TAMAÑO DEL MERCADO DE ENERGÍA COMO SERVICIO (EAAS) DE COREA DEL SUR PRONÓSTICO, POR FUENTE DE ENERGÍA, 2019-2035 (MILES DE MILLONES DE USD)
  282. TABLA 80. ESTIMACIONES Y PRONÓSTICOS DEL TAMAÑO DEL MERCADO DE ENERGÍA COMO SERVICIO (EAAS) DE COREA DEL SUR, POR TIPO DE SOLUCIÓN, 2019-2035 (MILES DE MILLONES DE USD)
  283. TABLA 81. ESTIMACIONES Y PRONÓSTICOS DEL TAMAÑO DEL MERCADO DE ENERGÍA COMO SERVICIO (EAAS) DE COREA DEL SUR PRONÓSTICO, POR REGION, 2019-2035 (MILES DE MILLONES DE USD)
  284. TABLA 82. ESTIMACIONES Y PRONÓSTICOS DEL TAMAÑO DEL MERCADO DE ENERGÍA COMO SERVICIO (EAAS) DE MALASIA, POR TIPO DE SERVICIO, 2019-2035 (MILES DE MILLONES DE USD)
  285. TABLA 83. ESTIMACIONES Y PRONÓSTICOS DEL TAMAÑO DEL MERCADO DE ENERGÍA COMO SERVICIO (EAAS) DE MALASIA, PRONÓSTICO, POR USUARIO FINAL, 2019-2035 (MILES DE MILLONES DE USD)
  286. TABLA 84. ESTIMACIONES Y PRONÓSTICOS DEL TAMAÑO DEL MERCADO DE ENERGÍA COMO SERVICIO (EAAS) DE MALASIA, POR FUENTE DE ENERGÍA, 2019-2035 (MILES DE MILLONES DE USD)
  287. TABLA 85. ESTIMACIONES Y PRONÓSTICOS DEL TAMAÑO DEL MERCADO DE ENERGÍA COMO SERVICIO (EAAS) DE MALASIA, PRONÓSTICO, POR TIPO DE SOLUCIÓN, 2019-2035 (MILES DE MILLONES DE USD)
  288. TABLA 86. ESTIMACIONES Y PRONÓSTICOS DEL TAMAÑO DEL MERCADO DE ENERGÍA COMO SERVICIO (EAAS) DE MALASIA, POR REGION, 2019-2035 (MILES DE MILLONES DE USD)
  289. TABLA 87. ESTIMACIONES Y PRONÓSTICOS DEL TAMAÑO DEL MERCADO DE ENERGÍA COMO SERVICIO (EAAS) DE TAILANDIA, POR TIPO DE SERVICIO, 2019-2035 (MILES DE MILLONES DE USD)
  290. TABLA 88. ESTIMACIONES Y PRONÓSTICOS DEL TAMAÑO DEL MERCADO DE ENERGÍA COMO SERVICIO (EAAS) DE TAILANDIA, POR USUARIO FINAL, 2019-2035 (MILES DE MILLONES DE USD)
  291. TABLA 89. ESTIMACIONES Y PRONÓSTICOS DEL TAMAÑO DEL MERCADO DE ENERGÍA COMO SERVICIO (EAAS) DE TAILANDIA, POR USUARIO FINAL, 2019-2035 (MILES DE MILLONES DE USD)
  292. TABLA 89. ESTIMACIONES Y PRONÓSTICOS DEL TAMAÑO DEL MERCADO DE ENERGÍA COMO SERVICIO (EAAS) DE TAILANDIA, PRONÓSTICO, POR FUENTE DE ENERGÍA, 2019-2035 (MILES DE MILLONES DE USD)
  293. TABLA 90. ESTIMACIONES Y PRONÓSTICOS DEL TAMAÑO DEL MERCADO DE ENERGÍA COMO SERVICIO (EAAS) DE TAILANDIA, POR TIPO DE SOLUCIÓN, 2019-2035 (MILES DE MILLONES DE USD)
  294. TABLA 91. ESTIMACIONES Y PRONÓSTICOS DEL TAMAÑO DEL MERCADO DE ENERGÍA COMO SERVICIO (EAAS) DE TAILANDIA PRONÓSTICO, POR REGION, 2019-2035 (MILES DE MILLONES DE USD)
  295. TABLA 92. ESTIMACIONES Y PRONÓSTICOS DEL TAMAÑO DEL MERCADO DE ENERGÍA COMO SERVICIO (EAAS) DE INDONESIA, POR TIPO DE SERVICIO, 2019-2035 (MILES DE MILLONES DE USD)
  296. TABLA 93. ESTIMACIONES Y PRONÓSTICOS DEL TAMAÑO DEL MERCADO DE ENERGÍA COMO SERVICIO (EAAS) DE INDONESIA PRONÓSTICO, POR USUARIO FINAL, 2019-2035 (MILES DE MILLONES DE USD)
  297. TABLA 94. ESTIMACIONES Y PRONÓSTICOS DEL TAMAÑO DEL MERCADO DE ENERGÍA COMO SERVICIO (EAAS) DE INDONESIA, POR FUENTE DE ENERGÍA, 2019-2035 (MILES DE MILLONES DE USD)
  298. TABLA 95. ESTIMACIONES Y PRONÓSTICOS DEL TAMAÑO DEL MERCADO DE ENERGÍA COMO SERVICIO (EAAS) DE INDONESIA PRONÓSTICO, POR TIPO DE SOLUCIÓN, 2019-2035 (MILES DE MILLONES DE USD)
  299. TABLA 96. INDONESIA ESTIMACIONES Y PRONÓSTICOS DEL TAMAÑO DEL MERCADO DE ENERGÍA COMO SERVICIO (EAAS), POR REGION, 2019-2035 (MILES DE MILLONES DE USD)
  300. TABLA 97. RESTO DE APAC ESTIMACIONES Y PRONÓSTICOS DEL TAMAÑO DEL MERCADO DE ENERGÍA COMO SERVICIO (EAAS) PRONÓSTICO, POR TIPO DE SERVICIO, 2019-2035 (MILES DE MILLONES DE USD)
  301. TABLA 98. RESTO DE APAC ESTIMACIONES DEL TAMAÑO DEL MERCADO DE ENERGÍA COMO SERVICIO (EAAS) Y PRONÓSTICO, POR USUARIO FINAL, 2019-2035 (MILES DE MILLONES DE USD)
  302. TABLA 99. RESTO DE APAC ESTIMACIONES DEL TAMAÑO DEL MERCADO DE ENERGÍA COMO SERVICIO (EAAS) Y PRONÓSTICO, POR FUENTE DE ENERGÍA, 2019-2035 (MILES DE MILLONES DE USD)
  303. TABLA 100. RESTO DE APAC ESTIMACIONES Y PRONÓSTICOS DEL TAMAÑO DEL MERCADO DE ENERGÍA COMO SERVICIO (EAAS), POR TIPO DE SOLUCIÓN, 2019-2035 (MILES DE MILLONES DE USD)
  304. TABLA 101. RESTO DE APAC ESTIMACIONES Y PRONÓSTICOS DEL TAMAÑO DEL MERCADO DE ENERGÍA COMO SERVICIO (EAAS) PRONÓSTICO, POR REGION, 2019-2035 (MILES DE MILLONES DE USD)
  305. TABLA 102. ESTIMACIONES Y PRONÓSTICOS DEL TAMAÑO DEL MERCADO DE ENERGÍA COMO SERVICIO (EAAS) EN SUDAMÉRICA, POR TIPO DE SERVICIO, 2019-2035 (MILES DE MILLONES DE USD)
  306. TABLA 103. ESTIMACIONES Y PRONÓSTICOS DEL TAMAÑO DEL MERCADO DE ENERGÍA COMO SERVICIO (EAAS) EN SUDAMÉRICA PRONÓSTICO, POR USUARIO FINAL, 2019-2035 (MILES DE MILLONES DE USD)
  307. TABLA 104. ESTIMACIONES Y PRONÓSTICOS DEL TAMAÑO DEL MERCADO DE ENERGÍA COMO SERVICIO (EAAS) EN SUDAMÉRICA, POR FUENTE DE ENERGÍA, 2019-2035 (MILES DE MILLONES DE USD)
  308. TABLA 105. ESTIMACIONES Y PRONÓSTICOS DEL TAMAÑO DEL MERCADO DE ENERGÍA COMO SERVICIO (EAAS) EN SUDAMÉRICA PRONÓSTICO, POR TIPO DE SOLUCIÓN, 2019-2035 (MILES DE MILLONES DE USD)
  309. TABLA 106. ESTIMACIONES Y PRONÓSTICOS DEL TAMAÑO DEL MERCADO DE ENERGÍA COMO SERVICIO (EAAS) EN SUDAMÉRICA, POR REGION, 2019-2035 (MILES DE MILLONES DE USD)
  310. TABLA 107. BRASIL ESTIMACIONES Y PRONÓSTICOS DEL TAMAÑO DEL MERCADO DE ENERGÍA COMO SERVICIO (EAAS) PRONÓSTICO, POR TIPO DE SERVICIO, 2019-2035 (MILES DE MILLONES DE USD)
  311. TABLA 108. ESTIMACIONES Y PRONÓSTICOS DEL TAMAÑO DEL MERCADO DE ENERGÍA COMO SERVICIO (EAAS) DE BRASIL, POR USUARIO FINAL, 2019-2035 (MILES DE MILLONES DE USD)
  312. TABLA 109. ESTIMACIONES Y PRONÓSTICOS DEL TAMAÑO DEL MERCADO DE ENERGÍA COMO SERVICIO (EAAS) DE BRASIL, PRONÓSTICO, POR FUENTE DE ENERGÍA, 2019-2035 (MILES DE MILLONES DE USD)
  313. TABLA 110. ESTIMACIONES Y PRONÓSTICOS DEL TAMAÑO DEL MERCADO DE ENERGÍA COMO SERVICIO (EAAS) DE BRASIL, POR TIPO DE SOLUCIÓN, 2019-2035 (MILES DE MILLONES DE USD)
  314. TABLA 111. ESTIMACIONES Y PRONÓSTICOS DEL TAMAÑO DEL MERCADO DE ENERGÍA COMO SERVICIO (EAAS) DE BRASIL, PRONÓSTICO, POR REGION, 2019-2035 (MILES DE MILLONES DE USD)
  315. TABLA 112. ESTIMACIONES Y PRONÓSTICOS DEL TAMAÑO DEL MERCADO DE ENERGÍA COMO SERVICIO (EAAS) EN MÉXICO, POR TIPO DE SERVICIO, 2019-2035 (MILES DE MILLONES DE USD)
  316. TABLA 113. ESTIMACIONES Y PRONÓSTICOS DEL TAMAÑO DEL MERCADO DE ENERGÍA COMO SERVICIO (EAAS) EN MÉXICO PRONÓSTICO, POR USUARIO FINAL, 2019-2035 (MILES DE MILLONES DE USD)
  317. TABLA 114. ESTIMACIONES Y PRONÓSTICOS DEL TAMAÑO DEL MERCADO DE ENERGÍA COMO SERVICIO (EAAS) EN MÉXICO, POR FUENTE DE ENERGÍA, 2019-2035 (MILES DE MILLONES DE USD)
  318. TABLA 115. ESTIMACIONES Y PRONÓSTICOS DEL TAMAÑO DEL MERCADO DE ENERGÍA COMO SERVICIO (EAAS) EN MÉXICO PRONÓSTICO, POR TIPO DE SOLUCIÓN, 2019-2035 (MILES DE MILLONES DE USD)
  319. TABLA 116. ESTIMACIONES Y PRONÓSTICOS DEL TAMAÑO DEL MERCADO DE ENERGÍA COMO SERVICIO (EAAS) DE MÉXICO, POR REGION, 2019-2035 (MILES DE MILLONES DE USD)
  320. TABLA 117. ARGENTINA ESTIMACIONES Y PRONÓSTICOS DEL TAMAÑO DEL MERCADO DE ENERGÍA COMO SERVICIO (EAAS) PRONÓSTICO, POR TIPO DE SERVICIO, 2019-2035 (MILES DE MILLONES DE USD)
  321. TABLA 118. ESTIMACIONES Y PRONÓSTICOS DEL TAMAÑO DEL MERCADO DE ENERGÍA COMO SERVICIO (EAAS) DE ARGENTINA, POR USUARIO FINAL, 2019-2035 (MILES DE MILLONES DE USD)
  322. TABLA 119. ESTIMACIONES Y PRONÓSTICOS DEL TAMAÑO DEL MERCADO DE ENERGÍA COMO SERVICIO (EAAS) DE ARGENTINA PRONÓSTICO, POR FUENTE DE ENERGÍA, 2019-2035 (MILES DE MILLONES DE USD)
  323. TABLA 120. ESTIMACIONES Y PRONÓSTICOS DEL TAMAÑO DEL MERCADO DE ENERGÍA COMO SERVICIO (EAAS) DE ARGENTINA, POR TIPO DE SOLUCIÓN, 2019-2035 (MILES DE MILLONES DE USD)
  324. TABLA 121. ESTIMACIONES Y PRONÓSTICOS DEL TAMAÑO DEL MERCADO DE ENERGÍA COMO SERVICIO (EAAS) DE ARGENTINA PRONÓSTICO, POR REGION, 2019-2035 (MILES DE MILLONES DE USD)
  325. TABLA 122. RESTO DE SUDAMÉRICA ESTIMACIONES Y PRONÓSTICOS DEL TAMAÑO DEL MERCADO DE ENERGÍA COMO SERVICIO (EAAS), POR TIPO DE SERVICIO, 2019-2035 (MILES DE MILLONES DE USD)
  326. TABLA 123. RESTO DE SUDAMÉRICA ESTIMACIONES Y PRONÓSTICOS DEL TAMAÑO DEL MERCADO DE ENERGÍA COMO SERVICIO (EAAS) PRONÓSTICO, POR USUARIO FINAL, 2019-2035 (MILES DE MILLONES DE USD)
  327. TABLA 124. RESTO DE SUDAMÉRICA ESTIMACIONES Y PRONÓSTICOS DEL TAMAÑO DEL MERCADO DE ENERGÍA COMO SERVICIO (EAAS), POR FUENTE DE ENERGÍA, 2019-2035 (MILES DE MILLONES DE USD)
  328. TABLA 125. RESTO DE SUDAMÉRICA ESTIMACIONES Y PRONÓSTICOS DEL TAMAÑO DEL MERCADO DE ENERGÍA COMO SERVICIO (EAAS) PRONÓSTICO, POR TIPO DE SOLUCIÓN, 2019-2035 (MILES DE MILLONES DE USD)
  329. TABLA 126. RESTO DE SUDAMÉRICA ESTIMACIONES Y PRONÓSTICOS DEL TAMAÑO DEL MERCADO DE ENERGÍA COMO SERVICIO (EAAS), POR REGION, 2019-2035 (MILES DE MILLONES DE USD)
  330. TABLA 127. MEA ESTIMACIONES Y PRONÓSTICOS DEL TAMAÑO DEL MERCADO DE ENERGÍA COMO SERVICIO (EAAS) PRONÓSTICO, POR TIPO DE SERVICIO, 2019-2035 (MILES DE MILLONES DE USD)
  331. TABLA 128. ESTIMACIONES Y PRONÓSTICOS DEL TAMAÑO DEL MERCADO DE ENERGÍA COMO SERVICIO (EAAS) DE MEA, POR USUARIO FINAL, 2019-2035 (MILES DE MILLONES DE USD)
  332. TABLA 129. ESTIMACIONES Y PRONÓSTICOS DEL TAMAÑO DEL MERCADO DE ENERGÍA COMO SERVICIO (EAAS) DE MEA, PRONÓSTICO, POR FUENTE DE ENERGÍA, 2019-2035 (MILES DE MILLONES DE USD)
  333. TABLA 130. ESTIMACIONES Y PRONÓSTICOS DEL TAMAÑO DEL MERCADO DE ENERGÍA COMO SERVICIO (EAAS) DE MEA, POR TIPO DE SOLUCIÓN, 2019-2035 (MILES DE MILLONES DE USD)
  334. TABLA 131. ESTIMACIONES Y PRONÓSTICOS DEL TAMAÑO DEL MERCADO DE ENERGÍA COMO SERVICIO (EAAS) DE MEA, PRONÓSTICO, POR REGION, 2019-2035 (MILES DE MILLONES DE USD)
  335. TABLA 132. ESTIMACIONES Y PRONÓSTICOS DEL TAMAÑO DEL MERCADO DE ENERGÍA COMO SERVICIO (EAAS) DE LOS PAÍSES DEL CCG, POR TIPO DE SERVICIO, 2019-2035 (MILES DE MILLONES DE USD)
  336. TABLA 133. ESTIMACIONES Y PRONÓSTICOS DEL TAMAÑO DEL MERCADO DE ENERGÍA COMO SERVICIO (EAAS) DE LOS PAÍSES DEL CCG PRONÓSTICO, POR USUARIO FINAL, 2019-2035 (MILES DE MILLONES DE USD)
  337. TABLA 134. ESTIMACIONES Y PRONÓSTICOS DEL TAMAÑO DEL MERCADO DE ENERGÍA COMO SERVICIO (EAAS) DE LOS PAÍSES DEL CCG, POR FUENTE DE ENERGÍA, 2019-2035 (MILES DE MILLONES DE USD)
  338. TABLA 135. ESTIMACIONES Y PRONÓSTICOS DEL TAMAÑO DEL MERCADO DE ENERGÍA COMO SERVICIO (EAAS) DE LOS PAÍSES DEL CCG PRONÓSTICO, POR TIPO DE SOLUCIÓN, 2019-2035 (MILES DE MILLONES DE USD)
  339. TABLA 136. ESTIMACIONES Y PRONÓSTICOS DEL TAMAÑO DEL MERCADO DE ENERGÍA COMO SERVICIO (EAAS) DE LOS PAÍSES DEL CCG, POR REGION, 2019-2035 (MILES DE MILLONES DE USD)
  340. TABLA 137. SUDÁFRICA ESTIMACIONES Y PRONÓSTICOS DEL TAMAÑO DEL MERCADO DE ENERGÍA COMO SERVICIO (EAAS) PRONÓSTICO, POR TIPO DE SERVICIO, 2019-2035 (MILES DE MILLONES DE USD)
  341. TABLA 138. ESTIMACIONES Y PRONÓSTICOS DEL TAMAÑO DEL MERCADO DE ENERGÍA COMO SERVICIO (EAAS) DE SUDÁFRICA, POR USUARIO FINAL, 2019-2035 (MILES DE MILLONES DE USD)
  342. TABLA 139. ESTIMACIONES Y PRONÓSTICOS DEL TAMAÑO DEL MERCADO DE ENERGÍA COMO SERVICIO (EAAS) DE SUDÁFRICA PRONÓSTICO, POR FUENTE DE ENERGÍA, 2019-2035 (MILES DE MILLONES DE USD)
  343. TABLA 140. ESTIMACIONES Y PRONÓSTICOS DEL TAMAÑO DEL MERCADO DE ENERGÍA COMO SERVICIO (EAAS) DE SUDÁFRICA, POR TIPO DE SOLUCIÓN, 2019-2035 (MILES DE MILLONES DE USD)
  344. TABLA 141. ESTIMACIONES Y PRONÓSTICOS DEL TAMAÑO DEL MERCADO DE ENERGÍA COMO SERVICIO (EAAS) DE SUDÁFRICA PRONÓSTICO, POR REGION, 2019-2035 (MILES DE MILLONES DE USD)
  345. TABLA 142. RESTO DE MEA ESTIMACIONES Y PRONÓSTICOS DEL TAMAÑO DEL MERCADO DE ENERGÍA COMO SERVICIO (EAAS), POR TIPO DE SERVICIO, 2019-2035 (MILES DE MILLONES DE USD)
  346. TABLA 143. RESTO DE MEA ESTIMACIONES Y PRONÓSTICOS DEL TAMAÑO DEL MERCADO DE ENERGÍA COMO SERVICIO (EAAS) PRONÓSTICO, POR USUARIO FINAL, 2019-2035 (MILES DE MILLONES DE USD)
  347. TABLA 144. RESTO DE MEA ESTIMACIONES Y PRONÓSTICOS DEL TAMAÑO DEL MERCADO DE ENERGÍA COMO SERVICIO (EAAS), POR FUENTE DE ENERGÍA, 2019-2035 (MILES DE MILLONES DE USD)
  348. TABLA 145. RESTO DE MEA ESTIMACIONES Y PRONÓSTICOS DEL TAMAÑO DEL MERCADO DE ENERGÍA COMO SERVICIO (EAAS) PRONÓSTICO, POR TIPO DE SOLUCIÓN, 2019-2035 (MILES DE MILLONES DE USD)
  349. TABLA 146. RESTO DE MEA ESTIMACIONES Y PRONÓSTICOS DEL TAMAÑO DEL MERCADO DE ENERGÍA COMO SERVICIO (EAAS), POR REGION, 2019-2035 (MILES DE MILLONES DE USD)
  350. TABLA 147. LANZAMIENTO DE PRODUCTO/DESARROLLO DE PRODUCTO/APROBACIÓN
  351. TABLA 148. ADQUISICIÓN/SOCIEDAD
  352. LISTA DE CIFRAS
  353. FIGURA 1. SINOPSIS DEL MERCADO
  354. FIGURA 2. ANÁLISIS DEL MERCADO DE ENERGÍA COMO SERVICIO (EAAS) EN AMÉRICA DEL NORTE
  355. FIGURA 3. ANÁLISIS DEL MERCADO DE ENERGÍA COMO SERVICIO (EAAS) EN EE. UU. POR TIPO DE SERVICIO
  356. FIGURA 4. ANÁLISIS DEL MERCADO DE ENERGÍA COMO SERVICIO (EAAS) EN EE. UU. POR USUARIO FINAL
  357. FIGURA 5. ANÁLISIS DEL MERCADO DE ENERGÍA COMO SERVICIO (EAAS) DE EE. UU. POR FUENTE DE ENERGÍA
  358. FIGURA 6. ANÁLISIS DEL MERCADO DE ENERGÍA COMO SERVICIO (EAAS) DE EE. UU. POR TIPO DE SOLUCIÓN
  359. FIGURA 7. ANÁLISIS DEL MERCADO DE ENERGÍA COMO SERVICIO (EAAS) DE EE. UU. POR REGIONAL
  360. FIGURA 8. ANÁLISIS DEL MERCADO DE ENERGÍA COMO SERVICIO (EAAS) DE CANADÁ POR TIPO DE SERVICIO
  361. FIGURA 9. ANÁLISIS DEL MERCADO DE ENERGÍA COMO SERVICIO (EAAS) DE CANADÁ POR USUARIO FINAL
  362. FIGURA 10. ANÁLISIS DEL MERCADO DE ENERGÍA COMO SERVICIO (EAAS) DE CANADÁ POR FUENTE DE ENERGÍA
  363. FIGURA 11. ANÁLISIS DEL MERCADO DE ENERGÍA COMO SERVICIO (EAAS) DE CANADÁ POR TIPO DE SOLUCIÓN
  364. FIGURA 12. ANÁLISIS DEL MERCADO DE ENERGÍA COMO SERVICIO (EAAS) DE CANADÁ POR REGION
  365. FIGURA 13. ANÁLISIS DEL MERCADO DE ENERGÍA COMO SERVICIO (EAAS) EN EUROPA
  366. FIGURA 14. ANÁLISIS DEL MERCADO DE ENERGÍA COMO SERVICIO (EAAS) EN ALEMANIA POR TIPO DE SERVICIO
  367. FIGURA 15. ANÁLISIS DEL MERCADO DE ENERGÍA COMO SERVICIO (EAAS) EN ALEMANIA POR USUARIO FINAL
  368. FIGURA 16. ANÁLISIS DEL MERCADO DE ENERGÍA COMO SERVICIO (EAAS) EN ALEMANIA POR FUENTE DE ENERGÍA
  369. FIGURA 17. ANÁLISIS DEL MERCADO DE ENERGÍA COMO SERVICIO (EAAS) EN ALEMANIA POR TIPO DE SOLUCIÓN
  370. FIGURA 18. ANÁLISIS DEL MERCADO DE ENERGÍA COMO SERVICIO (EAAS) EN ALEMANIA POR REGION
  371. FIGURA 19. ANÁLISIS DEL MERCADO DE ENERGÍA COMO SERVICIO (EAAS) EN EL REINO UNIDO POR TIPO DE SERVICIO
  372. FIGURA 20. ANÁLISIS DEL MERCADO DE ENERGÍA COMO SERVICIO (EAAS) EN EL REINO UNIDO POR USUARIO FINAL
  373. FIGURA 21. ANÁLISIS DEL MERCADO DE ENERGÍA COMO SERVICIO (EAAS) DEL REINO UNIDO POR FUENTE DE ENERGÍA
  374. FIGURA 22. ANÁLISIS DEL MERCADO DE ENERGÍA COMO SERVICIO (EAAS) DEL REINO UNIDO POR TIPO DE SOLUCIÓN
  375. FIGURA 23. ANÁLISIS DEL MERCADO DE ENERGÍA COMO SERVICIO (EAAS) DEL REINO UNIDO POR REGION
  376. FIGURA 24. ANÁLISIS DEL MERCADO DE ENERGÍA COMO SERVICIO (EAAS) DE FRANCIA POR TIPO DE SERVICIO
  377. FIGURA 25. ANÁLISIS DEL MERCADO DE ENERGÍA COMO SERVICIO (EAAS) EN FRANCIA POR USUARIO FINAL
  378. FIGURA 26. ANÁLISIS DEL MERCADO DE ENERGÍA COMO SERVICIO (EAAS) EN FRANCIA POR FUENTE DE ENERGÍA
  379. FIGURA 27. ANÁLISIS DEL MERCADO DE ENERGÍA COMO SERVICIO (EAAS) EN FRANCIA POR TIPO DE SOLUCIÓN
  380. FIGURA 28. ANÁLISIS DEL MERCADO DE ENERGÍA COMO SERVICIO (EAAS) EN FRANCIA POR REGION
  381. FIGURA 29. ANÁLISIS DEL MERCADO DE ENERGÍA COMO SERVICIO (EAAS) EN RUSIA POR TIPO DE SERVICIO
  382. FIGURA 30. ANÁLISIS DEL MERCADO DE ENERGÍA COMO SERVICIO (EAAS) EN RUSIA POR USUARIO FINAL
  383. FIGURA 31. ANÁLISIS DEL MERCADO DE ENERGÍA COMO SERVICIO (EAAS) EN RUSIA POR FUENTE DE ENERGÍA
  384. FIGURA 32. ANÁLISIS DEL MERCADO DE ENERGÍA COMO SERVICIO (EAAS) EN RUSIA POR TIPO DE SOLUCIÓN
  385. FIGURA 33. ANÁLISIS DEL MERCADO DE ENERGÍA COMO SERVICIO (EAAS) EN RUSIA POR REGION
  386. FIGURA 34. ITALIA ANÁLISIS DEL MERCADO DE ENERGÍA COMO SERVICIO (EAAS) POR TIPO DE SERVICIO
  387. FIGURA 35. ITALIA ANÁLISIS DEL MERCADO DE ENERGÍA COMO SERVICIO (EAAS) POR USUARIO FINAL
  388. FIGURA 36. ITALIA ANÁLISIS DEL MERCADO DE ENERGÍA COMO SERVICIO (EAAS) POR FUENTE DE ENERGÍA
  389. FIGURA 37. ANÁLISIS DEL MERCADO DE ENERGÍA COMO SERVICIO (EAAS) EN ITALIA POR TIPO DE SOLUCIÓN
  390. FIGURA 38. ANÁLISIS DEL MERCADO DE ENERGÍA COMO SERVICIO (EAAS) EN ITALIA POR REGIONAL
  391. FIGURA 39. ANÁLISIS DEL MERCADO DE ENERGÍA COMO SERVICIO (EAAS) EN ESPAÑA POR TIPO DE SERVICIO
  392. FIGURA 40. ANÁLISIS DEL MERCADO DE ENERGÍA COMO SERVICIO (EAAS) EN ESPAÑA POR USUARIO FINAL
  393. FIGURA 41. ANÁLISIS DEL MERCADO DE ENERGÍA COMO SERVICIO (EAAS) EN ESPAÑA POR FUENTE DE ENERGÍA
  394. FIGURA 42. ANÁLISIS DEL MERCADO DE ENERGÍA COMO SERVICIO (EAAS) EN ESPAÑA POR TIPO DE SOLUCIÓN
  395. FIGURA 43. ANÁLISIS DEL MERCADO DE ENERGÍA COMO SERVICIO (EAAS) EN ESPAÑA POR REGION
  396. FIGURA 44. RESTO DE EUROPA ANÁLISIS DEL MERCADO DE ENERGÍA COMO SERVICIO (EAAS) POR TIPO DE SERVICIO
  397. FIGURA 45. ANÁLISIS DEL MERCADO DE ENERGÍA COMO SERVICIO (EAAS) EN EL RESTO DE EUROPA POR USUARIO FINAL
  398. FIGURA 46. ANÁLISIS DEL MERCADO DE ENERGÍA COMO SERVICIO (EAAS) EN EL RESTO DE EUROPA POR FUENTE DE ENERGÍA
  399. FIGURA 47. ANÁLISIS DEL MERCADO DE ENERGÍA COMO SERVICIO (EAAS) EN EL RESTO DE EUROPA POR TIPO DE SOLUCIÓN
  400. FIGURA 48. ANÁLISIS DEL MERCADO DE ENERGÍA COMO SERVICIO (EAAS) EN EL RESTO DE EUROPA POR REGION
  401. FIGURA 49. ANÁLISIS DEL MERCADO DE ENERGÍA COMO SERVICIO (EAAS) DE APAC
  402. FIGURA 50. ANÁLISIS DEL MERCADO DE ENERGÍA COMO SERVICIO (EAAS) DE CHINA POR TIPO DE SERVICIO
  403. FIGURA 51. ANÁLISIS DEL MERCADO DE ENERGÍA COMO SERVICIO (EAAS) DE CHINA POR USUARIO FINAL
  404. FIGURA 52. ANÁLISIS DEL MERCADO DE ENERGÍA COMO SERVICIO (EAAS) DE CHINA POR FUENTE DE ENERGÍA
  405. FIGURA 53. ANÁLISIS DEL MERCADO DE ENERGÍA COMO SERVICIO (EAAS) EN CHINA POR TIPO DE SOLUCIÓN
  406. FIGURA 54. ANÁLISIS DEL MERCADO DE ENERGÍA COMO SERVICIO (EAAS) EN CHINA POR REGIONAL
  407. FIGURA 55. ANÁLISIS DEL MERCADO DE ENERGÍA COMO SERVICIO (EAAS) EN INDIA POR TIPO DE SERVICIO
  408. FIGURA 56. ANÁLISIS DEL MERCADO DE ENERGÍA COMO SERVICIO (EAAS) EN INDIA POR USUARIO FINAL
  409. FIGURA 57. ANÁLISIS DEL MERCADO DE ENERGÍA COMO SERVICIO (EAAS) EN INDIA POR FUENTE DE ENERGÍA
  410. FIGURA 58. ANÁLISIS DEL MERCADO DE ENERGÍA COMO SERVICIO (EAAS) EN INDIA POR TIPO DE SOLUCIÓN
  411. FIGURA 59. ANÁLISIS DEL MERCADO DE ENERGÍA COMO SERVICIO (EAAS) EN INDIA POR REGION
  412. FIGURA 60. ANÁLISIS DEL MERCADO DE ENERGÍA COMO SERVICIO (EAAS) EN JAPÓN POR TIPO DE SERVICIO
  413. FIGURA 61. ANÁLISIS DEL MERCADO DE ENERGÍA COMO SERVICIO (EAAS) EN JAPÓN POR USUARIO FINAL
  414. FIGURA 62. ANÁLISIS DEL MERCADO DE ENERGÍA COMO SERVICIO (EAAS) EN JAPÓN POR FUENTE DE ENERGÍA
  415. FIGURA 63. ANÁLISIS DEL MERCADO DE ENERGÍA COMO SERVICIO (EAAS) EN JAPÓN POR TIPO DE SOLUCIÓN
  416. FIGURA 64. ANÁLISIS DEL MERCADO DE ENERGÍA COMO SERVICIO (EAAS) EN JAPÓN POR REGION
  417. FIGURA 65. ANÁLISIS DEL MERCADO DE ENERGÍA COMO SERVICIO (EAAS) DE COREA DEL SUR POR TIPO DE SERVICIO
  418. FIGURA 66. ANÁLISIS DEL MERCADO DE ENERGÍA COMO SERVICIO (EAAS) DE COREA DEL SUR POR USUARIO FINAL
  419. FIGURA 67. ANÁLISIS DEL MERCADO DE ENERGÍA COMO SERVICIO (EAAS) DE COREA DEL SUR POR FUENTE DE ENERGÍA
  420. FIGURA 68. ANÁLISIS DEL MERCADO DE ENERGÍA COMO SERVICIO (EAAS) DE COREA DEL SUR POR TIPO DE SOLUCIÓN
  421. FIGURA 69. ANÁLISIS DEL MERCADO DE ENERGÍA COMO SERVICIO (EAAS) DE COREA DEL SUR POR REGION
  422. FIGURA 70. ANÁLISIS DEL MERCADO DE ENERGÍA COMO SERVICIO (EAAS) DE MALASIA POR TIPO DE SERVICIO
  423. FIGURA 71. ANÁLISIS DEL MERCADO DE ENERGÍA COMO SERVICIO (EAAS) DE MALASIA POR USUARIO FINAL
  424. FIGURA 72. ANÁLISIS DEL MERCADO DE ENERGÍA COMO SERVICIO (EAAS) DE MALASIA POR FUENTE DE ENERGÍA
  425. FIGURA 73. ANÁLISIS DEL MERCADO DE ENERGÍA COMO SERVICIO (EAAS) DE MALASIA POR TIPO DE SOLUCIÓN
  426. FIGURA 74. ANÁLISIS DEL MERCADO DE ENERGÍA COMO SERVICIO (EAAS) DE MALASIA POR REGION
  427. FIGURA 75. ANÁLISIS DEL MERCADO DE ENERGÍA COMO SERVICIO (EAAS) DE TAILANDIA POR TIPO DE SERVICIO
  428. FIGURA 76. ANÁLISIS DEL MERCADO DE ENERGÍA COMO SERVICIO (EAAS) DE TAILANDIA POR USUARIO FINAL
  429. FIGURA 77. ANÁLISIS DEL MERCADO DE ENERGÍA COMO SERVICIO (EAAS) DE TAILANDIA POR FUENTE DE ENERGÍA
  430. FIGURA 78. ANÁLISIS DEL MERCADO DE ENERGÍA COMO SERVICIO (EAAS) DE TAILANDIA POR TIPO DE SOLUCIÓN
  431. FIGURA 79. ANÁLISIS DEL MERCADO DE ENERGÍA COMO SERVICIO (EAAS) DE TAILANDIA POR REGIONAL
  432. FIGURA 80. ANÁLISIS DEL MERCADO DE ENERGÍA COMO SERVICIO (EAAS) DE INDONESIA POR TIPO DE SERVICIO
  433. FIGURA 81. ANÁLISIS DEL MERCADO DE ENERGÍA COMO SERVICIO (EAAS) DE INDONESIA POR USUARIO FINAL
  434. FIGURA 82. ANÁLISIS DEL MERCADO DE ENERGÍA COMO SERVICIO (EAAS) DE INDONESIA POR FUENTE DE ENERGÍA
  435. FIGURA 83. ANÁLISIS DEL MERCADO DE ENERGÍA COMO SERVICIO (EAAS) DE INDONESIA POR TIPO DE SOLUCIÓN
  436. FIGURA 84. ANÁLISIS DEL MERCADO DE ENERGÍA COMO SERVICIO (EAAS) DE INDONESIA POR REGION
  437. FIGURA 85. ANÁLISIS DEL MERCADO DE ENERGÍA COMO SERVICIO (EAAS) EN EL RESTO DE APAC POR TIPO DE SERVICIO
  438. FIGURA 86. ANÁLISIS DEL MERCADO DE ENERGÍA COMO SERVICIO (EAAS) EN EL RESTO DE APAC POR USUARIO FINAL
  439. FIGURA 87. ANÁLISIS DEL MERCADO DE ENERGÍA COMO SERVICIO (EAAS) EN EL RESTO DE APAC POR FUENTE DE ENERGÍA
  440. FIGURA 88. ANÁLISIS DEL MERCADO DE ENERGÍA COMO SERVICIO (EAAS) EN EL RESTO DE APAC POR TIPO DE SOLUCIÓN
  441. FIGURA 89. ANÁLISIS DEL MERCADO DE ENERGÍA COMO SERVICIO (EAAS) DEL RESTO DE APAC POR REGION
  442. FIGURA 90. ANÁLISIS DEL MERCADO DE ENERGÍA COMO SERVICIO (EAAS) DE SUDAMÉRICA
  443. FIGURA 91. ANÁLISIS DEL MERCADO DE ENERGÍA COMO SERVICIO (EAAS) DE BRASIL POR TIPO DE SERVICIO
  444. FIGURA 92. ANÁLISIS DEL MERCADO DE ENERGÍA COMO SERVICIO (EAAS) DE BRASIL POR USUARIO FINAL
  445. FIGURA 93. ANÁLISIS DEL MERCADO DE ENERGÍA COMO SERVICIO (EAAS) DE BRASIL POR FUENTE DE ENERGÍA
  446. FIGURA 94. ANÁLISIS DEL MERCADO DE ENERGÍA COMO SERVICIO (EAAS) DE BRASIL POR TIPO DE SOLUCIÓN
  447. FIGURA 95. ANÁLISIS DEL MERCADO DE ENERGÍA COMO SERVICIO (EAAS) DE BRASIL POR REGIONAL
  448. FIGURA 96. ANÁLISIS DEL MERCADO DE ENERGÍA COMO SERVICIO (EAAS) DE MÉXICO POR TIPO DE SERVICIO
  449. FIGURA 97. ANÁLISIS DEL MERCADO DE ENERGÍA COMO SERVICIO (EAAS) EN MÉXICO POR USUARIO FINAL
  450. FIGURA 98. ANÁLISIS DEL MERCADO DE ENERGÍA COMO SERVICIO (EAAS) EN MÉXICO POR FUENTE DE ENERGÍA
  451. FIGURA 99. ANÁLISIS DEL MERCADO DE ENERGÍA COMO SERVICIO (EAAS) EN MÉXICO POR TIPO DE SOLUCIÓN
  452. FIGURA 100. ANÁLISIS DEL MERCADO DE ENERGÍA COMO SERVICIO (EAAS) EN MÉXICO POR REGIONAL
  453. FIGURA 101. ANÁLISIS DEL MERCADO DE ENERGÍA COMO SERVICIO (EAAS) EN ARGENTINA POR TIPO DE SERVICIO
  454. FIGURA 102. ANÁLISIS DEL MERCADO DE ENERGÍA COMO SERVICIO (EAAS) EN ARGENTINA POR USUARIO FINAL
  455. FIGURA 103. ANÁLISIS DEL MERCADO DE ENERGÍA COMO SERVICIO (EAAS) EN ARGENTINA POR FUENTE DE ENERGÍA
  456. FIGURA 104. ANÁLISIS DEL MERCADO DE ENERGÍA COMO SERVICIO (EAAS) EN ARGENTINA POR TIPO DE SOLUCIÓN
  457. FIGURA 105. ANÁLISIS DEL MERCADO DE ENERGÍA COMO SERVICIO (EAAS) EN ARGENTINA POR REGIONAL
  458. FIGURA 106. ANÁLISIS DEL MERCADO DE ENERGÍA COMO SERVICIO (EAAS) EN EL RESTO DE SUDAMÉRICA POR TIPO DE SERVICIO
  459. FIGURA 107. ANÁLISIS DEL MERCADO DE ENERGÍA COMO SERVICIO (EAAS) EN EL RESTO DE SUDAMÉRICA POR USUARIO FINAL
  460. FIGURA 108. ANÁLISIS DEL MERCADO DE ENERGÍA COMO SERVICIO (EAAS) EN EL RESTO DE SUDAMÉRICA POR FUENTE DE ENERGÍA
  461. FIGURA 109. ANÁLISIS DEL MERCADO DE ENERGÍA COMO SERVICIO (EAAS) EN EL RESTO DE SUDAMÉRICA POR TIPO DE SOLUCIÓN
  462. FIGURA 110. ANÁLISIS DEL MERCADO DE ENERGÍA COMO SERVICIO (EAAS) EN EL RESTO DE SUDAMÉRICA POR REGION
  463. FIGURA 111. ANÁLISIS DEL MERCADO DE ENERGÍA COMO SERVICIO (EAAS) EN MEA
  464. FIGURA 112. ANÁLISIS DEL MERCADO DE ENERGÍA COMO SERVICIO (EAAS) EN LOS PAÍSES DEL CCG POR TIPO DE SERVICIO
  465. FIGURA 113. ANÁLISIS DEL MERCADO DE ENERGÍA COMO SERVICIO (EAAS) DE LOS PAÍSES DEL CCG POR USUARIO FINAL
  466. FIGURA 114. ANÁLISIS DEL MERCADO DE ENERGÍA COMO SERVICIO (EAAS) DE LOS PAÍSES DEL CCG POR FUENTE DE ENERGÍA
  467. FIGURA 115. ANÁLISIS DEL MERCADO DE ENERGÍA COMO SERVICIO (EAAS) DE LOS PAÍSES DEL CCG POR TIPO DE SOLUCIÓN
  468. FIGURA 116. ANÁLISIS DEL MERCADO DE ENERGÍA COMO SERVICIO (EAAS) DE LOS PAÍSES DEL CCG POR REGION
  469. FIGURA 117. ANÁLISIS DEL MERCADO DE ENERGÍA COMO SERVICIO (EAAS) DE SUDÁFRICA POR TIPO DE SERVICIO
  470. FIGURA 118. ANÁLISIS DEL MERCADO DE ENERGÍA COMO SERVICIO (EAAS) DE SUDÁFRICA POR USUARIO FINAL
  471. FIGURA 119. ANÁLISIS DEL MERCADO DE ENERGÍA COMO SERVICIO (EAAS) DE SUDÁFRICA POR FUENTE DE ENERGÍA
  472. FIGURA 120. ANÁLISIS DEL MERCADO DE ENERGÍA COMO SERVICIO (EAAS) DE SUDÁFRICA POR TIPO DE SOLUCIÓN
  473. FIGURA 121. ANÁLISIS DEL MERCADO DE ENERGÍA COMO SERVICIO (EAAS) DE SUDÁFRICA POR REGION
  474. FIGURA 122. RESTO DE MEA ANÁLISIS DEL MERCADO DE ENERGÍA COMO SERVICIO (EAAS) POR TIPO DE SERVICIO
  475. FIGURA 123. RESTO DE MEA ANÁLISIS DEL MERCADO DE ENERGÍA COMO SERVICIO (EAAS) POR USUARIO FINAL
  476. FIGURA 124. RESTO DE MEA ANÁLISIS DEL MERCADO DE ENERGÍA COMO SERVICIO (EAAS) POR FUENTE DE ENERGÍA
  477. FIGURA 125. ANÁLISIS DEL RESTO DEL MERCADO DE ENERGÍA COMO SERVICIO (EAAS) DE MEA POR TIPO DE SOLUCIÓN
  478. FIGURA 126. ANÁLISIS DEL RESTO DEL MERCADO DE ENERGÍA COMO SERVICIO (EAAS) DE MEA POR REGION
  479. FIGURA 127. CRITERIOS CLAVE DE COMPRA DEL MERCADO DE ENERGÍA COMO SERVICIO (EAAS)
  480. FIGURA 128. PROCESO DE INVESTIGACIÓN DE MRFR
  481. FIGURA 129. ANÁLISIS DE DRO DE ENERGÍA COMO SERVICIO (EAAS) MERCADO
  482. FIGURA 130. ANÁLISIS DEL IMPACTO DE LOS IMPULSORES: MERCADO DE ENERGÍA COMO SERVICIO (EAAS)
  483. FIGURA 131. ANÁLISIS DEL IMPACTO DE LAS RESTRICCIONES: MERCADO DE ENERGÍA COMO SERVICIO (EAAS)
  484. FIGURA 132. CADENA DE SUMINISTRO/VALOR: MERCADO DE ENERGÍA COMO SERVICIO (EAAS)
  485. FIGURA 133. MERCADO DE ENERGÍA COMO SERVICIO (EAAS), POR TIPO DE SERVICIO, 2025 (% PARTICIPACIÓN)
  486. FIGURA 134. MERCADO DE ENERGÍA COMO SERVICIO (EAAS), POR TIPO DE SERVICIO, 2019 A 2035 (miles de millones de USD)
  487. FIGURA 135. MERCADO DE ENERGÍA COMO SERVICIO (EAAS), POR USUARIO FINAL, 2025 (% PARTICIPACIÓN)

Segmentación del mercado de energía como servicio (EaaS)


  • Mercado de energía como servicio (EaaS) por tipo de servicio (miles de millones de USD, 2019-2035)

    • Servicios de gestión energética

    • Servicios de respuesta a la demanda

    • Servicios de gestión de recursos energéticos distribuidos

    • Servicios de suministro de energía


  • Mercado de energía como servicio (EaaS) por usuario final (miles de millones de USD, 2019-2035)

    • Residencial

    • Comercial

    • Industrial

    • Gobierno


  • Mercado de Energía como Servicio (EaaS) por fuente de energía (miles de millones de USD, 2019-2035)

    • Energía renovable

    • Energía convencional

    • Energía híbrida


  • Energía como Mercado de Servicios (EaaS) por Tipo de Solución (Miles de Millones de USD, 2019-2035)

    • Soluciones de Software

    • Soluciones de Hardware

    • Soluciones Integradas


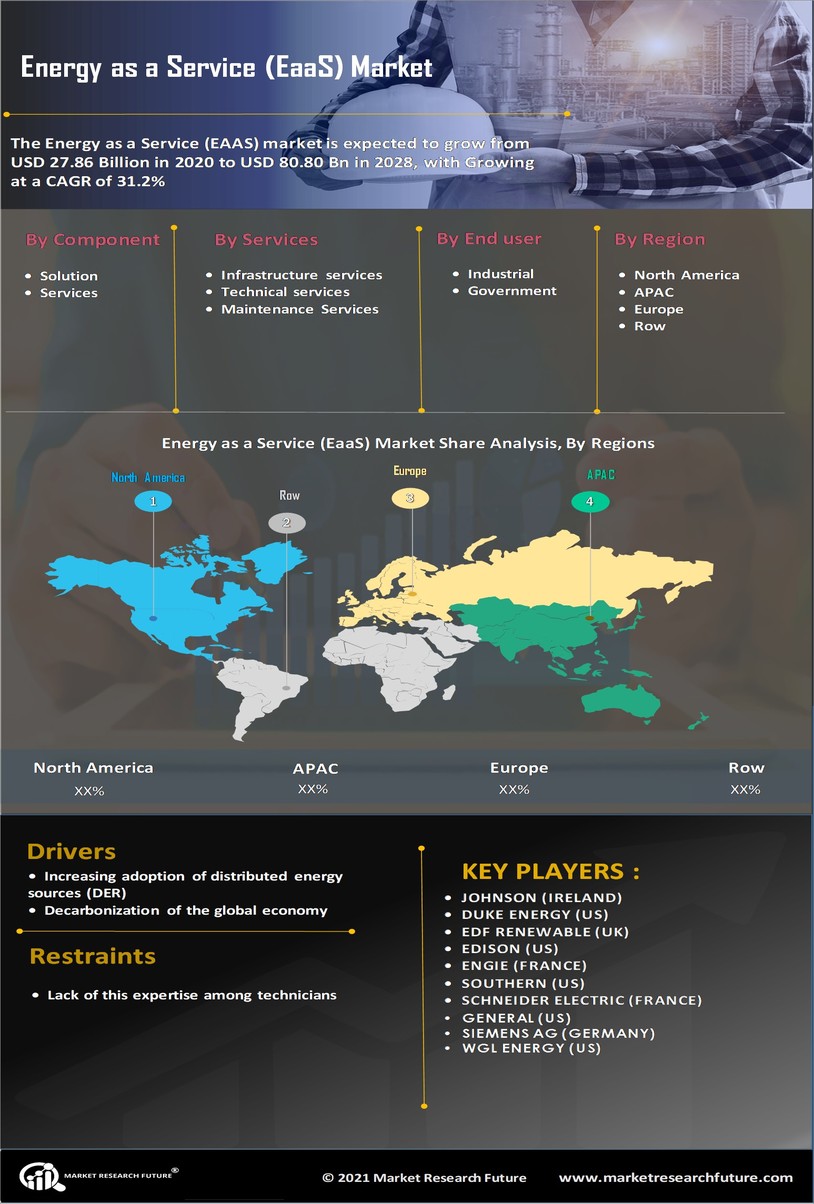
  • Mercado de Energía como Servicio (EaaS) por Región (Miles de Millones de USD, 2019-2035)

    • América del Norte

    • Europa

    • América del Sur

    • Asia Pacífico

    • Oriente Medio y África


Perspectivas regionales del mercado de energía como servicio (EaaS) (miles de millones de USD, 2019-2035)


  • Perspectivas de América del Norte (miles de millones de USD, 2019-2035)

    • Mercado de Energía como Servicio (EaaS) en América del Norte por tipo de servicio

      • Servicios de Gestión Energética

      • Servicios de Respuesta a la Demanda

      • Servicios de Gestión de Recursos Energéticos Distribuidos

      • Servicios de Suministro de Energía

    • Mercado de Energía como Servicio (EaaS) en América del Norte por usuario final Tipo

      • Residencial

      • Comercial

      • Industrial

      • Gobierno

    • Mercado de Energía como Servicio (EaaS) en Norteamérica por tipo de fuente de energía

      • Energía renovable

      • Energía convencional

      • Energía híbrida

    • Mercado de Energía como Servicio (EaaS) en Norteamérica por tipo de solución

      • Soluciones de software

      • Hardware Soluciones

      • Soluciones integradas

    • Mercado de energía como servicio (EaaS) en Norteamérica por tipo de región

      • EE. UU.

      • Canadá

    • Perspectivas para EE. UU. (miles de millones de USD, 2019-2035)

    • Mercado de energía como servicio (EaaS) en EE. UU. por tipo de servicio

      • Servicios de gestión energética

      • Servicios de respuesta a la demanda

      • Servicios de gestión de recursos energéticos distribuidos

      • Suministro de energía Servicios

    • Mercado de Energía como Servicio (EaaS) en EE. UU. por tipo de usuario final

      • Residencial

      • Comercial

      • Industrial

      • Gobierno

    • Mercado de Energía como Servicio (EaaS) en EE. UU. por tipo de fuente de energía

      • Energía renovable

      • Energía convencional

      • Energía híbrida

    • Mercado de Energía como Servicio (EaaS) en EE. UU. por solución Tipo

      • Soluciones de software

      • Soluciones de hardware

      • Soluciones integradas

    • Perspectivas de Canadá (miles de millones de USD, 2019-2035)

    • Mercado de energía como servicio (EaaS) en Canadá por tipo de servicio

      • Servicios de gestión energética

      • Servicios de respuesta a la demanda

      • Servicios de gestión de recursos energéticos distribuidos

      • Servicios de suministro de energía

    • Mercado de energía como servicio (EaaS) en Canadá por usuario final Tipo

      • Residencial

      • Comercial

      • Industrial

      • Gobierno

    • Mercado de Energía como Servicio (EaaS) en Canadá por tipo de fuente de energía

      • Energía renovable

      • Energía convencional

      • Energía híbrida

    • Mercado de Energía como Servicio (EaaS) en Canadá por tipo de solución

      • Soluciones de software

      • Hardware Soluciones

      • Soluciones integradas

  • Perspectivas en Europa (miles de millones de USD, 2019-2035)

    • Mercado europeo de energía como servicio (EaaS) por tipo de servicio

      • Servicios de gestión energética

      • Servicios de respuesta a la demanda

      • Servicios de gestión de recursos energéticos distribuidos

      • Servicios de suministro de energía

    • Mercado europeo de energía como servicio (EaaS) por usuario final Tipo

      • Residencial

      • Comercial

      • Industrial

      • Gobierno

    • Mercado europeo de energía como servicio (EaaS) por tipo de fuente de energía

      • Energía renovable

      • Energía convencional

      • Energía híbrida

    • Mercado europeo de energía como servicio (EaaS) por tipo de solución

      • Soluciones de software

      • Hardware Soluciones

      • Soluciones integradas

    • Mercado europeo de energía como servicio (EaaS) por tipo regional

      • Alemania

      • Reino Unido

      • Francia

      • Rusia

      • Italia

      • España

      • Resto de Europa

    • Perspectivas para ALEMANIA (miles de millones de USD, 2019-2035)

    • ALEMANIA Energía como servicio (EaaS) Mercado por tipo de servicio

      • Servicios de gestión energética

      • Servicios de respuesta a la demanda

      • Servicios de gestión de recursos energéticos distribuidos

      • Servicios de suministro de energía

    • ALEMANIA Mercado de energía como servicio (EaaS) por tipo de usuario final

      • Residencial

      • Comercial

      • Industrial

      • Gobierno

    • ALEMANIA Mercado de energía como servicio (EaaS) por fuente de energía Tipo

      • Energía renovable

      • Energía convencional

      • Energía híbrida

    • ALEMANIA Mercado de energía como servicio (EaaS) por tipo de solución

      • Soluciones de software

      • Soluciones de hardware

      • Soluciones integradas

    • Perspectivas para el Reino Unido (miles de millones de USD, 2019-2035)

    • Mercado de energía como servicio (EaaS) del Reino Unido por tipo de servicio

      • Gestión energética Servicios

      • Servicios de Respuesta a la Demanda

      • Servicios de Gestión de Recursos Energéticos Distribuidos

      • Servicios de Suministro de Energía

    • Mercado de Energía como Servicio (EaaS) del Reino Unido por tipo de usuario final

      • Residencial

      • Comercial

      • Industrial

      • Gobierno

    • Mercado de Energía como Servicio (EaaS) del Reino Unido por tipo de fuente de energía

      • Energía Renovable

      • Convencional Energía

      • Energía híbrida

    • Mercado de energía como servicio (EaaS) en el Reino Unido por tipo de solución

      • Soluciones de software

      • Soluciones de hardware

      • Soluciones integradas

    • Perspectivas para Francia (miles de millones de USD, 2019-2035)

    • Mercado de energía como servicio (EaaS) en Francia por tipo de servicio

      • Servicios de gestión energética

      • Servicios de respuesta a la demanda

      • Gestión distribuida de recursos energéticos Servicios

      • Servicios de suministro de energía

    • Mercado de energía como servicio (EaaS) en Francia por tipo de usuario final

      • Residencial

      • Comercial

      • Industrial

      • Gobierno

    • Mercado de energía como servicio (EaaS) en Francia por tipo de fuente de energía

      • Energía renovable

      • Energía convencional

      • Híbrido Energía

    • Francia: Mercado de Energía como Servicio (EaaS) por tipo de solución

      • Soluciones de software

      • Soluciones de hardware

      • Soluciones integradas

    • Perspectivas para Rusia (miles de millones de USD, 2019-2035)

    • Rusia: Mercado de Energía como Servicio (EaaS) por tipo de servicio

      • Servicios de gestión energética

      • Servicios de respuesta a la demanda

      • Servicios de gestión de recursos energéticos distribuidos

      • Suministro de energía Servicios

    • Mercado de Energía como Servicio (EaaS) en Rusia por tipo de usuario final

      • Residencial

      • Comercial

      • Industrial

      • Gobierno

    • Mercado de Energía como Servicio (EaaS) en Rusia por tipo de fuente de energía

      • Energía renovable

      • Energía convencional

      • Energía híbrida

    • Mercado de Energía como Servicio (EaaS) en Rusia por Tipo de solución

      • Soluciones de software

      • Soluciones de hardware

      • Soluciones integradas

    • Perspectivas de ITALIA (miles de millones de USD, 2019-2035)

    • Mercado de energía como servicio (EaaS) en ITALIA por tipo de servicio

      • Servicios de gestión energética

      • Servicios de respuesta a la demanda

      • Servicios de gestión de recursos energéticos distribuidos

      • Servicios de suministro de energía

    • Mercado de energía como servicio (EaaS) en ITALIA por usuario final Tipo

      • Residencial

      • Comercial

      • Industrial

      • Gobierno

    • Mercado de Energía como Servicio (EaaS) en Italia por tipo de fuente de energía

      • Energía renovable

      • Energía convencional

      • Energía híbrida

    • Mercado de Energía como Servicio (EaaS) en Italia por tipo de solución

      • Soluciones de software

      • Hardware Soluciones

      • Soluciones Integradas

    • Perspectivas en ESPAÑA (Miles de millones de USD, 2019-2035)

    • Mercado de Energía como Servicio (EaaS) en ESPAÑA por Tipo de Servicio

      • Servicios de Gestión Energética

      • Servicios de Respuesta a la Demanda

      • Servicios de Gestión de Recursos Energéticos Distribuidos

      • Servicios de Suministro de Energía

    • Mercado de Energía como Servicio (EaaS) en ESPAÑA por Usuario Final Tipo

      • Residencial

      • Comercial

      • Industrial

      • Gobierno

    • Mercado de Energía como Servicio (EaaS) en ESPAÑA por tipo de fuente de energía

      • Energías renovables

      • Energía convencional

      • Energía híbrida

    • Mercado de Energía como Servicio (EaaS) en ESPAÑA por tipo de solución

      • Soluciones de software

      • Hardware Soluciones

      • Soluciones integradas

    • Perspectivas para el RESTO DE EUROPA (miles de millones de USD, 2019-2035)

    • Mercado de energía como servicio (EaaS) en el RESTO DE EUROPA por tipo de servicio

      • Servicios de gestión energética

      • Servicios de respuesta a la demanda

      • Servicios de gestión de recursos energéticos distribuidos

      • Servicios de suministro de energía

    • Mercado de energía como servicio (EaaS) en el RESTO DE EUROPA por usuario final Tipo

      • Residencial

      • Comercial

      • Industrial

      • Gobierno

    • RESTO DE EUROPA Mercado de Energía como Servicio (EaaS) por tipo de fuente de energía

      • Energía renovable

      • Energía convencional

      • Energía híbrida

    • RESTO DE EUROPA Mercado de Energía como Servicio (EaaS) por tipo de solución

      • Software Soluciones

      • Soluciones de hardware

      • Soluciones integradas

  • Perspectivas de Asia-Pacífico (miles de millones de USD, 2019-2035)

    • Mercado de energía como servicio (EaaS) en Asia-Pacífico por tipo de servicio

      • Servicios de gestión energética

      • Servicios de respuesta a la demanda

      • Servicios de gestión de recursos energéticos distribuidos

      • Servicios de suministro de energía

    • Mercado de energía como servicio (EaaS) en Asia-Pacífico por usuario final Tipo

      • Residencial

      • Comercial

      • Industrial

      • Gobierno

    • Mercado de Energía como Servicio (EaaS) de Asia-Pacífico por tipo de fuente de energía

      • Energía renovable

      • Energía convencional

      • Energía híbrida

    • Mercado de Energía como Servicio (EaaS) de Asia-Pacífico por tipo de solución

      • Soluciones de software

      • Hardware Soluciones

      • Soluciones integradas

    • Mercado de energía como servicio (EaaS) en Asia-Pacífico por tipo regional

      • China

      • India

      • Japón

      • Corea del Sur

      • Malasia

      • Tailandia

      • Indonesia

      • Resto de Asia-Pacífico

    • Perspectivas para China (miles de millones de USD, 2019-2035)

    • Mercado de Energía como Servicio (EaaS) en China por tipo de servicio

      • Servicios de Gestión Energética

      • Servicios de Respuesta a la Demanda

      • Servicios de Gestión de Recursos Energéticos Distribuidos

      • Servicios de Suministro de Energía

    • Mercado de Energía como Servicio (EaaS) en China por usuario final Tipo

      • Residencial

      • Comercial

      • Industrial

      • Gobierno

    • Mercado de Energía como Servicio (EaaS) en China por tipo de fuente de energía

      • Energía renovable

      • Energía convencional

      • Energía híbrida

    • Mercado de Energía como Servicio (EaaS) en China por tipo de solución

      • Soluciones de software

      • Hardware Soluciones

      • Soluciones integradas

    • Perspectivas de la India (miles de millones de USD, 2019-2035)

    • Mercado de Energía como Servicio (EaaS) en la India por tipo de servicio

      • Servicios de gestión energética

      • Servicios de respuesta a la demanda

      • Servicios de gestión de recursos energéticos distribuidos

      • Servicios de suministro de energía

    • Mercado de Energía como Servicio (EaaS) en la India por usuario final Tipo

      • Residencial

      • Comercial

      • Industrial

      • Gobierno

    • Mercado de Energía como Servicio (EaaS) en INDIA por tipo de fuente de energía

      • Energía renovable

      • Energía convencional

      • Energía híbrida

    • Mercado de Energía como Servicio (EaaS) en INDIA por tipo de solución

      • Soluciones de software

      • Hardware Soluciones

      • Soluciones integradas

    • Perspectivas en Japón (miles de millones de USD, 2019-2035)

    • Mercado de energía como servicio (EaaS) en Japón por tipo de servicio

      • Servicios de gestión energética

      • Servicios de respuesta a la demanda

      • Servicios de gestión de recursos energéticos distribuidos

      • Servicios de suministro de energía

    • Mercado de energía como servicio (EaaS) en Japón por usuario final Tipo

      • Residencial

      • Comercial

      • Industrial

      • Gobierno

    • Mercado de Energía como Servicio (EaaS) en Japón por tipo de fuente de energía

      • Energía renovable

      • Energía convencional

      • Energía híbrida

    • Mercado de Energía como Servicio (EaaS) en Japón por tipo de solución

      • Soluciones de software

      • Hardware Soluciones

      • Soluciones Integradas

    • Perspectivas de COREA DEL SUR (Miles de millones de USD, 2019-2035)

    • Mercado de Energía como Servicio (EaaS) en COREA DEL SUR por Tipo de Servicio

      • Servicios de Gestión Energética

      • Servicios de Respuesta a la Demanda

      • Servicios de Gestión de Recursos Energéticos Distribuidos

      • Servicios de Suministro de Energía

    • Mercado de Energía como Servicio (EaaS) en COREA DEL SUR por Usuario Final Tipo

      • Residencial

      • Comercial

      • Industrial

      • Gobierno

    • COREA DEL SUR Mercado de Energía como Servicio (EaaS) por tipo de fuente de energía

      • Energía renovable

      • Energía convencional

      • Energía híbrida

    • COREA DEL SUR Mercado de Energía como Servicio (EaaS) por tipo de solución

      • Software Soluciones

      • Soluciones de hardware

      • Soluciones integradas

    • Perspectivas de MALASIA (miles de millones de USD, 2019-2035)

    • Mercado de Energía como Servicio (EaaS) en MALASIA por tipo de servicio

      • Servicios de gestión energética

      • Servicios de respuesta a la demanda

      • Servicios de gestión de recursos energéticos distribuidos

      • Servicios de suministro de energía

    • Mercado de Energía como Servicio (EaaS) en MALASIA por usuario final Tipo

      • Residencial

      • Comercial

      • Industrial

      • Gobierno

    • Mercado de Energía como Servicio (EaaS) en MALASIA por tipo de fuente de energía

      • Energía renovable

      • Energía convencional

      • Energía híbrida

    • Mercado de Energía como Servicio (EaaS) en MALASIA por tipo de solución

      • Software Soluciones

      • Soluciones de hardware

      • Soluciones integradas

    • Perspectivas de Tailandia (miles de millones de USD, 2019-2035)

    • Mercado de energía como servicio (EaaS) en Tailandia por tipo de servicio

      • Servicios de gestión energética

      • Servicios de respuesta a la demanda

      • Servicios de gestión de recursos energéticos distribuidos

      • Servicios de suministro de energía

    • Mercado de energía como servicio (EaaS) en Tailandia por usuario final Tipo

      • Residencial

      • Comercial

      • Industrial

      • Gobierno

    • Mercado de Energía como Servicio (EaaS) en Tailandia por tipo de fuente de energía

      • Energía renovable

      • Energía convencional

      • Energía híbrida

    • Mercado de Energía como Servicio (EaaS) en Tailandia por tipo de solución

      • Soluciones de software

      • Hardware Soluciones

      • Soluciones integradas

    • Perspectivas de INDONESIA (miles de millones de USD, 2019-2035)

    • Mercado de Energía como Servicio (EaaS) en INDONESIA por tipo de servicio

      • Servicios de gestión energética

      • Servicios de respuesta a la demanda

      • Servicios de gestión de recursos energéticos distribuidos

      • Servicios de suministro de energía

    • Mercado de Energía como Servicio (EaaS) en INDONESIA por usuario final Tipo

      • Residencial

      • Comercial

      • Industrial

      • Gobierno

    • Mercado de Energía como Servicio (EaaS) en INDONESIA por tipo de fuente de energía

      • Energía renovable

      • Energía convencional

      • Energía híbrida

    • Mercado de Energía como Servicio (EaaS) en INDONESIA por tipo de solución

      • Software Soluciones

      • Soluciones de hardware

      • Soluciones integradas

    • Perspectivas para el resto de Asia-Pacífico (miles de millones de USD, 2019-2035)

    • Mercado de energía como servicio (EaaS) en el resto de Asia-Pacífico por tipo de servicio

      • Servicios de gestión energética

      • Servicios de respuesta a la demanda

      • Servicios de gestión de recursos energéticos distribuidos

      • Servicios de suministro de energía

    • Mercado de energía como servicio (EaaS) en el resto de Asia-Pacífico por usuario final Tipo

      • Residencial

      • Comercial

      • Industrial

      • Gobierno

    • RESTO DEL MERCADO DE ENERGÍA COMO SERVICIO (EaaS) DE APAC POR TIPO DE FUENTE DE ENERGÍA

      • Energía Renovable

      • Energía Convencional

      • Energía Híbrida

    • RESTO DEL MERCADO DE ENERGÍA COMO SERVICIO (EaaS) DE APAC POR TIPO DE SOLUCIÓN

      • Software Soluciones

      • Soluciones de hardware

      • Soluciones integradas

  • Perspectivas de Sudamérica (miles de millones de USD, 2019-2035)

    • Mercado de energía como servicio (EaaS) en Sudamérica por tipo de servicio

      • Servicios de gestión energética

      • Servicios de respuesta a la demanda

      • Servicios de gestión de recursos energéticos distribuidos

      • Servicios de suministro de energía

    • Entonces Mercado de Energía como Servicio (EaaS) en Sudamérica por tipo de usuario final

      • Residencial

      • Comercial

      • Industrial

      • Gobierno

    • Mercado de Energía como Servicio (EaaS) en Sudamérica por tipo de fuente de energía

      • Energía renovable

      • Energía convencional

      • Energía híbrida

    • Mercado de Energía como Servicio (EaaS) en Sudamérica por tipo de solución

      • Software Soluciones

      • Soluciones de hardware

      • Soluciones integradas

    • Mercado de Energía como Servicio (EaaS) en Sudamérica por tipo de región

      • Brasil

      • México

      • Argentina

      • Resto de Sudamérica

    • Perspectivas para BRASIL (miles de millones de USD, 2019-2035)

    • Mercado de Energía como Servicio (EaaS) en BRASIL por tipo de servicio

      • Gestión de la energía Servicios

      • Servicios de Respuesta a la Demanda

      • Servicios de Gestión de Recursos Energéticos Distribuidos

      • Servicios de Suministro de Energía

    • BRASIL Mercado de Energía como Servicio (EaaS) por Tipo de Usuario Final

      • Residencial

      • Comercial

      • Industrial

      • Gobierno

    • BRASIL Mercado de Energía como Servicio (EaaS) por Tipo de Fuente de Energía

      • Renovables Energía

      • Energía convencional

      • Energía híbrida

    • BRASIL Mercado de energía como servicio (EaaS) por tipo de solución

      • Soluciones de software

      • Soluciones de hardware

      • Soluciones integradas

    • Perspectivas para MÉXICO (miles de millones de USD, 2019-2035)

    • Mercado de energía como servicio (EaaS) en MÉXICO por tipo de servicio

      • Servicios de gestión de energía

      • Respuesta a la demanda Servicios

      • Servicios de Gestión de Recursos Energéticos Distribuidos

      • Servicios de Suministro de Energía

    • Mercado de Energía como Servicio (EaaS) en MÉXICO por Tipo de Usuario Final

      • Residencial

      • Comercial

      • Industrial

      • Gobierno

    • Mercado de Energía como Servicio (EaaS) en MÉXICO por Tipo de Fuente de Energía

      • Energía Renovable

      • Convencional Energía

      • Energía híbrida

    • Mercado de energía como servicio (EaaS) en MÉXICO por tipo de solución

      • Soluciones de software

      • Soluciones de hardware

      • Soluciones integradas

    • Perspectiva para ARGENTINA (miles de millones de USD, 2019-2035)

    • Mercado de energía como servicio (EaaS) en ARGENTINA por tipo de servicio

      • Servicios de gestión de energía

      • Servicios de respuesta a la demanda

      • Distribuido Servicios de Gestión de Recursos Energéticos

      • Servicios de Suministro de Energía

    • ARGENTINA Mercado de Energía como Servicio (EaaS) por Tipo de Usuario Final

      • Residencial

      • Comercial

      • Industrial

      • Gobierno

    • ARGENTINA Mercado de Energía como Servicio (EaaS) por Tipo de Fuente de Energía

      • Energía Renovable

      • Energía Convencional

      • Híbrida Energía

    • ARGENTINA Mercado de Energía como Servicio (EaaS) por tipo de solución

      • Soluciones de software

      • Soluciones de hardware

      • Soluciones integradas

    • RESTO DE SUDAMÉRICA Perspectivas (miles de millones de USD, 2019-2035)

    • RESTO DE SUDAMÉRICA Mercado de Energía como Servicio (EaaS) por tipo de servicio

      • Servicios de gestión energética

      • Servicios de respuesta a la demanda

      • Gestión distribuida de recursos energéticos Servicios

      • Servicios de suministro de energía

    • RESTO DE SUDAMÉRICA: Mercado de energía como servicio (EaaS) por tipo de usuario final

      • Residencial

      • Comercial

      • Industrial

      • Gobierno

    • RESTO DE SUDAMÉRICA: Mercado de energía como servicio (EaaS) por tipo de fuente de energía

      • Energía renovable

      • Energía convencional

      • Híbrido Energía

    • RESTO DE SUDAMÉRICA: Mercado de Energía como Servicio (EaaS) por tipo de solución

      • Soluciones de software

      • Soluciones de hardware

      • Soluciones integradas

  • Perspectivas de Oriente Medio y África (miles de millones de USD, 2019-2035)

    • Mercado de Energía como Servicio (EaaS) de Oriente Medio y África por tipo de servicio

      • Servicios de gestión energética

      • Servicios de respuesta a la demanda

      • Gestión distribuida de recursos energéticos Servicios

      • Servicios de suministro de energía

    • Mercado de energía como servicio (EaaS) de Oriente Medio y África por tipo de usuario final

      • Residencial

      • Comercial

      • Industrial

      • Gobierno

    • Mercado de energía como servicio (EaaS) de Oriente Medio y África por tipo de fuente de energía

      • Energía renovable

      • Energía convencional

      • Híbrido Energía

    • Mercado de Energía como Servicio (EaaS) en Oriente Medio y África por tipo de solución

      • Soluciones de software

      • Soluciones de hardware

      • Soluciones integradas

    • Mercado de Energía como Servicio (EaaS) en Oriente Medio y África por tipo regional

      • Países del CCG

      • Sudáfrica

      • Resto de Oriente Medio y África

    • Perspectiva de los países del CCG (miles de millones de USD, 2019-2035)

    • Países del CCG: Mercado de Energía como Servicio (EaaS) por tipo de servicio

      • Servicios de Gestión Energética

      • Servicios de Respuesta a la Demanda

      • Servicios de Gestión de Recursos Energéticos Distribuidos

      • Servicios de Suministro de Energía

    • Países del CCG: Mercado de Energía como Servicio (EaaS) por usuario final Tipo

      • Residencial

      • Comercial

      • Industrial

      • Gobierno

    • Países del CCG: Mercado de energía como servicio (EaaS) por tipo de fuente de energía

      • Energía renovable

      • Energía convencional

      • Energía híbrida

    • Países del CCG: Mercado de energía como servicio (EaaS) por tipo de solución

      • Software Soluciones

      • Soluciones de hardware

      • Soluciones integradas

    • Perspectivas de SUDÁFRICA (miles de millones de USD, 2019-2035)

    • Mercado de energía como servicio (EaaS) en SUDÁFRICA por tipo de servicio

      • Servicios de gestión energética

      • Servicios de respuesta a la demanda

      • Servicios de gestión de recursos energéticos distribuidos

      • Servicios de suministro de energía

    • Mercado de energía como servicio (EaaS) en SUDÁFRICA por usuario final Tipo

      • Residencial

      • Comercial

      • Industrial

      • Gobierno

    • SUDÁFRICA Mercado de Energía como Servicio (EaaS) por tipo de fuente de energía

      • Energía renovable

      • Energía convencional

      • Energía híbrida

    • SUDÁFRICA Mercado de Energía como Servicio (EaaS) por tipo de solución

      • Software Soluciones

      • Soluciones de hardware

      • Soluciones integradas

    • Perspectivas del resto de Oriente Medio y África (miles de millones de USD, 2019-2035)

    • Mercado de energía como servicio (EaaS) del resto de Oriente Medio y África por tipo de servicio

      • Servicios de gestión energética

      • Servicios de respuesta a la demanda

      • Servicios de gestión de recursos energéticos distribuidos

      • Servicios de suministro de energía

    • Mercado de energía como servicio (EaaS) del resto de Oriente Medio y África por usuario final Tipo

      • Residencial

      • Comercial

      • Industrial

      • Gobierno

    • RESTO DEL MERCADO DE ENERGÍA COMO SERVICIO (EaaS) DE OMEA POR TIPO DE FUENTE DE ENERGÍA

      • Energía Renovable

      • Energía Convencional

      • Energía Híbrida

    • RESTO DEL MERCADO DE ENERGÍA COMO SERVICIO (EaaS) DE OMEA POR TIPO DE SOLUCIÓN

      • Software Soluciones

      • Soluciones de hardware

      • Soluciones integradas

Compare Licence

×
Features License Type
Single User Multiuser License Enterprise User
Price $4,950 $5,950 $7,250
Maximum User Access Limit 1 User Upto 10 Users Unrestricted Access Throughout the Organization
Free Customization
Direct Access to Analyst
Deliverable Format
Platform Access
Discount on Next Purchase 10% 15% 15%
Printable Versions