Request Free Sample ×

Kindly complete the form below to receive a free sample of this Report

* Please use a valid business email

Leading companies partner with us for data-driven Insights

clients tt-cursor
Hero Background

Automotive Infotainment Market

ID: MRFR/AT/2676-CR
134 Pages
Shubham Munde
Last Updated: April 06, 2026

Informe de investigación del mercado de infoentretenimiento automotriz: pronóstico global hasta 2030

Compartir
Download PDF ×

We do not share your information with anyone. However, we may send you emails based on your report interest from time to time. You may contact us at any time to opt-out.

Automotive Infotainment Market Infographic
Purchase Options
  1. 1 Resumen ejecutivo
  2. 2 Introducción
    1. 2.1 Definición 13
    2. 2.2 Alcance del estudio 13
    3. 2.3 Supuestos 14
    4. 2.4 Estructura del mercado 14
  3. 3 Metodología de la investigación
    1. 3.1 Proceso de investigación 15
    2. 3.2 Investigación primaria 15
    3. 3.3 Investigación secundaria 16
    4. 3.4 Estimación del tamaño del mercado 16
    5. 3.5 Modelo de pronóstico 18
  4. 4 Dinámica del mercado
    1. 4.1 Introducción 19
    2. 4.2 Impulsores del mercado 20
      1. 4.2.1 Análisis de impacto: Impulsores del mercado 20
      2. 4.2.2 Creciente demanda de sistemas de infoentretenimiento en la producción en masa de vehículos 20
      3. 4.2.3 Provisión para la integración de teléfonos inteligentes Con sistemas IVI 20
      4. 4.2.4 Mayor compatibilidad con plataformas de código abierto y estándar para el desarrollo de aplicaciones 20
      5. 4.2.5 Integración del infoentretenimiento con otros sistemas 21
    3. 4.3 Desafíos del mercado 21
      1. 4.3.1 Análisis de impacto: Desafíos del mercado 21
      2. 4.3.2 Diferentes ciclos de vida de productos para teléfonos inteligentes y sistemas de infoentretenimiento integrados 21
      3. 4.3.3 Complejidad del diseño 22
      4. 4.3.4 Distracciones para los conductores 22
      5. 4.3.5 Creciente preocupación por la seguridad de los datos 23
    4. 4.4 Tendencias del mercado 23
      1. 4.4.1 Análisis de impacto: Tendencias del mercado 23
      2. 4.4.2 Análisis de datos en sistemas de infoentretenimiento 23
      3. 4.4.3 Adopción del Transporte de Sistemas Orientado a los Medios (MOST) Tecnología para simplificar las actualizaciones de sistemas y prolongar la vida útil del infoentretenimiento integrado 24
      4. 4.4.4 Actualizaciones inalámbricas (OTA) para sistemas de infoentretenimiento integrados 24
      5. 4.4.5 Tecnologías avanzadas como los sistemas de infoentretenimiento basados ​​en OLED 25
      6. 4.4.6 Reducción de la dependencia de los teléfonos inteligentes para las aplicaciones 25
  5. 5 Análisis de factores de mercado
    1. 5.1 Análisis de las cinco fuerzas 26
      1. 5.1.1 Amenaza de nuevos participantes 26
      2. 5.1.2 Poder de negociación del proveedor 27
      3. 5.1.3 Poder de negociación de los compradores 27
      4. 5.1.4 Amenaza de sustitutos 27
      5. 5.1.5 Amenaza de rivalidad 27
    2. 5.2 Análisis de la cadena de valor 28
  6. 6 Mercado global de infoentretenimiento automotriz, por sistema operativo
    1. 6.1 Introducción 29
    2. 6.2 QNX 31
    3. 6.3 Microsoft 31
    4. 6.4 Linux 31
    5. 6.5 Otros 31
  7. 7 Mercado global de infoentretenimiento automotriz, por región
    1. 7.1 Introducción 32
    2. 7.2 Norteamérica 34
      1. 7.2.1 EE. UU. 36
      2. 7.2.2 Canadá 37
    3. 7.3 Europa 38
      1. 7.3.1 Alemania 40
      2. 7.3.2 Reino Unido 41
      3. 7.3.3 Francia 42
      4. 7.3.4 España 43
      5. 7.3.5 Resto de Europa 44
    4. 7.4 Asia-Pacífico 45
      1. 7.4.1 China 48
      2. 7.4.2 Japón 49
      3. 7.4.3 India 50
      4. 7.4.4 Resto de Asia-Pacífico 51
    5. 7.5 Resto del mundo 52
      1. 7.5.1 Oriente Medio y África 54
      2. 7.5.2 Sudamérica 55
  8. 8 Panorama competitivo
  9. 8.1.1 Desarrollo de productos - 2022-2030 (%) 57
  10. 8.1.2 Colaboración y asociación 58
  11. 8.1.3 Expansión 58
  12. 8.1.4 Fusión y Adquisición 59
  13. 8.1.5 Acuerdo 59
  14. 9 Actores clave
    1. 9.1 Alpine Electronics, Inc. 60
      1. 9.1.1 Descripción general de la empresa 60
      2. 9.1.2 Descripción financiera 60
      3. 9.1.3 Oferta de productos/servicios 61
      4. 9.1.4 Estrategia 62
      5. 9.1.5 Análisis FODA 63
    2. 9.2 Continental AG 64
      1. 9.2.1 Descripción general de la empresa 64
      2. 9.2.2 Descripción financiera 64
      3. 9.2.3 Oferta de productos/servicios 65
      4. 9.2.4 Estrategia 65
      5. 9.2.5 Análisis FODA 66
    3. 9.3 Harman International 67
      1. 9.3.1 Descripción general de la empresa 67
      2. 9.3.2 Oferta de productos/servicios 67
      3. 9.3.3 Panorama financiero 68
      4. 9.3.4 Estrategia 68
      5. 9.3.5 Análisis FODA 69
    4. 9.4 Panasonic Corporation 70
      1. 9.4.1 Panorama de la empresa 70
      2. 9.4.2 Panorama financiero 70
      3. 9.4.3 Oferta de productos/servicios 71
      4. 9.4.4 Estrategia 71
      5. 9.4.5 Análisis FODA 72
    5. 9.5 Pioneer Corporation 73
      1. 9.5.1 Panorama de la empresa 73
      2. 9.5.2 Panorama financiero 73
      3. 9.5.3 Oferta de productos/servicios 74
      4. 9.5.4 Estrategia 75
      5. 9.5.5 Análisis FODA 76
    6. 9.6 DENSO CORPORATION 77
      1. 9.6.1 Descripción general de la empresa 77
      2. 9.6.2 Oferta de productos/servicios 77
      3. 9.6.3 Descripción general financiera 78
      4. 9.6.4 Estrategia 79
    7. 9.7 Garmin Ltd 80
      1. 9.7.1 Descripción general de la empresa 80
      2. 9.7.2 Oferta de productos/servicios 80
      3. 9.7.3 Descripción general financiera 81
      4. 9.7.4 Estrategia 81
    8. 9.8 KENWOOD Corporation 82
      1. 9.8.1 Descripción general de la empresa 82
      2. 9.8.2 Oferta de productos/servicios 82
      3. 9.8.3 Descripción general financiera 83
      4. 9.8.4 Estrategia 84
    9. 9.9 Delphi Automotive PLC 85
      1. 9.9.1 Descripción general de la empresa 85
      2. 9.9.2 Oferta de productos/servicios 85
      3. 9.9.3 Descripción financiera 86
      4. 9.9.4 Estrategia 86
    10. 9.10 ALLGo Embedded Systems Pvt Ltd 88
      1. 9.10.1 Descripción general de la empresa 88
      2. 9.10.1 Oferta de productos/servicios 88
      3. 9.10.2 Descripción financiera 88
      4. 9.10.3 Estrategia 88
  15. 10 Lista de tablas
    1. TABLA 1 MERCADO GLOBAL DE INFOTAINING AUTOMOTRIZ, POR SISTEMA OPERATIVO, 2022-2030 (MILLONES DE USD) 30
    2. TABLA 2 MERCADO GLOBAL DE INFOTAINING AUTOMOTRIZ, POR REGIÓN, 2022-2030 (USD MILLONES) 33
    3. TABLA 3 MERCADO DE INFOTAINING AUTOMOTRIZ DE AMÉRICA DEL NORTE, POR PAÍS 2022-2030 (USD MILLONES) 35
    4. TABLA 4 MERCADO DE INFOTAINING AUTOMOTRIZ DE AMÉRICA DEL NORTE, POR SISTEMAS OPERATIVOS 2022-2030 (USD MILLONES) 35
    5. TABLA 5 MERCADO DE INFOTAINING AUTOMOTRIZ DE EE. UU., POR SISTEMA OPERATIVO 2022-2030 (USD MILLONES) 36
    6. TABLA 6 MERCADO DE INFOTAINING AUTOMOTRIZ DE CANADÁ, POR SISTEMA OPERATIVO 2022-2030 (USD MILLONES) 37
    7. TABLA 7 MERCADO DE INFOTAINING AUTOMOTRIZ DE EUROPA, POR PAÍS 2022-2030 (USD MILLONES) 39
    8. TABLA 8 MERCADO EUROPEO DE INFOTAINING PARA AUTOMÓVILES, POR SISTEMA OPERATIVO 2022-2030 (MILLONES DE USD) 39
    9. TABLA 9 MERCADO ALEMANO DE INFOTAINING PARA AUTOMÓVILES, POR SISTEMA OPERATIVO 2022-2030 (MILLONES DE USD) 40
    10. TABLA 10 MERCADO REINO UNIDO DE INFOTAINING PARA AUTOMÓVILES, POR SISTEMA OPERATIVO 2022-2030 (MILLONES DE USD) 41
    11. TABLA 11 MERCADO FRANCESO DE INFOTAINING PARA AUTOMÓVILES, POR SISTEMA OPERATIVO 2022-2030 (MILLONES DE USD) 42
    12. TABLA 12 MERCADO ESPAÑOL DE INFOTAINING PARA AUTOMÓVILES, POR SISTEMA OPERATIVO 2022-2030 (MILLONES DE USD) 43
    13. TABLA 13 RESTO DE EUROPA MERCADO DE INFOTAINING PARA AUTOMÓVILES, POR SISTEMA OPERATIVO 2022-2030 (MILLONES DE USD) 44
    14. TABLA 14 MERCADO DE INFOTAINING AUTOMOTRIZ DE ASIA-PACÍFICO, POR PAÍS 2022-2030 (MILLONES DE USD) 47
    15. TABLA 15 MERCADO DE INFOTAINING AUTOMOTRIZ DE ASIA-PACÍFICO, POR SISTEMAS OPERATIVOS 2022-2030 (MILLONES DE USD) 47
    16. TABLA 16 MERCADO DE INFOTAINING AUTOMOTRIZ DE CHINA, POR SISTEMAS OPERATIVOS 2022-2030 (MILLONES DE USD) 48
    17. TABLA 17 MERCADO DE INFOTAINING AUTOMOTRIZ DE JAPÓN, POR SISTEMAS OPERATIVOS 2022-2030 (MILLONES DE USD) 49
    18. TABLA 18 MERCADO DE INFOTAINING AUTOMOTRIZ DE INDIA, POR SISTEMAS OPERATIVOS 2022-2030 (MILLONES DE USD) MILLONES) 50
    19. TABLA 19 RESTO DEL MERCADO DE INFOTAINING AUTOMOTRIZ DE ASIA-PACÍFICO, POR SISTEMAS OPERATIVOS 2022-2030 (MILLONES DE USD) 51
    20. TABLA 20 RESTO DEL MERCADO MUNDIAL DE INFOTAINING AUTOMOTRIZ, POR REGIÓN 2022-2030 (MILLONES DE USD) 52
    21. TABLA 21 RESTO DEL MERCADO MUNDIAL DE INFOTAINING AUTOMOTRIZ, POR SISTEMAS OPERATIVOS 2022-2030 (MILLONES DE USD) 53
    22. TABLA 22 ORIENTE MEDIO Y MERCADO DE INFOTAINING AUTOMOTRIZ EN ÁFRICA, POR SISTEMAS OPERATIVOS 2022-2030 (MILLONES DE USD) 54
    23. TABLA 23 MERCADO DE INFOTAINING AUTOMOTRIZ EN SUDAMÉRICA, POR SISTEMAS OPERATIVOS 2022-2030 (MILLONES DE USD) 55
    24. TABLA 24 ALPINE ELECTRONICS, INC.: DESARROLLOS CLAVE, 2022-2030 62
  16. 11 Lista de figuras
    1. FIGURA 1 PROCESO DE INVESTIGACIÓN DE MRFR 15
    2. FIGURA 2 DE ARRIBA HACIA ABAJO Y ENFOQUE DE ABAJO HACIA ARRIBA 17
    3. FIGURA 3 DINÁMICA DEL MERCADO 19
    4. FIGURA 4 ANÁLISIS DE IMPACTO: DESAFÍOS DEL MERCADO 21
    5. FIGURA 5 ANÁLISIS DE LAS CINCO FUERZAS 26
    6. FIGURA 6 ANÁLISIS DE LA CADENA DE VALOR 28
    7. FIGURA 7 CUOTA DE MERCADO GLOBAL DE INFOTAINING AUTOMOTRIZ (%), POR SISTEMA OPERATIVO, 2022 29
    8. FIGURA 8 MERCADO GLOBAL DE INFOTAINING AUTOMOTRIZ, POR SISTEMA OPERATIVO, 2022-2030 (MILLONES DE USD) 30
    9. FIGURA 9 CUOTA DE MERCADO GLOBAL DE INFOTAINING AUTOMOTRIZ (%), POR REGIÓN, 2022 32
    10. FIGURA 10 CUOTA DE MERCADO GLOBAL DE INFOTAINING AUTOMOTRIZ MERCADO DE INFOTAINMENT, POR REGIÓN, 2022-2030 (USD MILLONES) 33
    11. FIGURA 11 CUOTA DE MERCADO DE INFOTAINMENT AUTOMOTRIZ EN AMÉRICA DEL NORTE (%), 2022 34
    12. FIGURA 12 CUOTA DE MERCADO DE INFOTAINMENT AUTOMOTRIZ EN EE. UU. (%), POR SISTEMA OPERATIVO, 2022 36
    13. FIGURA 13 CUOTA DE MERCADO DE INFOTAINMENT AUTOMOTRIZ EN CANADÁ (%), POR SISTEMA OPERATIVO, 2022 37
    14. FIGURA 14 CUOTA DE MERCADO DE INFOTAINMENT AUTOMOTRIZ EN EUROPA (%), 2022 38
    15. FIGURA 15 CUOTA DE MERCADO DE INFOTAINMENT AUTOMOTRIZ EN ALEMANIA (%), POR SISTEMA OPERATIVO, 2022 40
    16. FIGURA 16 CUOTA DE MERCADO DE INFOTAINMENT AUTOMOTRIZ EN EL REINO UNIDO (%), POR SISTEMA OPERATIVO, 2022 41
    17. FIGURA 17 CUOTA DE MERCADO DE INFOTAINING PARA AUTOMÓVILES EN FRANCIA (%), POR SISTEMA OPERATIVO, 2022 42
    18. FIGURA 18 CUOTA DE MERCADO DE INFOTAINING PARA AUTOMÓVILES EN ESPAÑA (%), POR SISTEMA OPERATIVO, 2022 43
    19. FIGURA 19 CUOTA DE MERCADO DE INFOTAINING PARA AUTOMÓVILES EN EL RESTO DE EUROPA (%), POR SISTEMA OPERATIVO, 2022 44
    20. FIGURA 20 CUOTA DE MERCADO DE INFOTAINING PARA AUTOMÓVILES EN ASIA-PACÍFICO (%), 2022 46
    21. FIGURA 21 MERCADO DE INFOTAINING PARA AUTOMÓVILES EN ASIA-PACÍFICO, POR PAÍS 2022-2030 (MILLONES DE USD) 46
    22. FIGURA 22 CUOTA DE MERCADO DE INFOTAINING PARA AUTOMÓVILES EN CHINA (%), POR SISTEMA OPERATIVO, 2022 48
    23. FIGURA 23 CUOTA DE MERCADO DE INFOTAINING AUTOMOTRIZ DE JAPÓN (%), POR SISTEMA OPERATIVO, 2022 49
    24. FIGURA 24 CUOTA DE MERCADO DE INFOTAINING AUTOMOTRIZ DE INDIA (%), POR SISTEMA OPERATIVO, 2022 50
    25. FIGURA 25 CUOTA DE MERCADO DE INFOTAINING AUTOMOTRIZ DEL RESTO DE ASIA-PACÍFICO (%), POR SISTEMA OPERATIVO, 2022 51
    26. FIGURA 26 CUOTA DE MERCADO DE INFOTAINING AUTOMOTRIZ DEL RESTO DEL MUNDO (%), 2022 52
    27. FIGURA 27 MERCADO DE INFOTAINING AUTOMOTRIZ DEL RESTO DEL MUNDO, POR SISTEMAS OPERATIVOS 2022-2030 (MILLONES DE USD) 53
    28. FIGURA 28 ORIENTE MEDIO Y ÁFRICA CUOTA DE MERCADO DE INFOTAINMENT AUTOMOTRIZ (%), POR SISTEMA OPERATIVO, 2022 54
    29. FIGURA 29 SUDAMÉRICA CUOTA DE MERCADO DE INFOTAINMENT AUTOMOTRIZ (%), POR SISTEMA OPERATIVO, 2022 55
    30. FIGURA 30 ESTRATEGIAS DE CRECIMIENTO ADOPTADAS POR LOS ACTORES CLAVE EN EL MERCADO GLOBAL DE INFOTAINMENT AUTOMOTRIZ, 2022-2030, (EN %) 56
    31. FIGURA 31 DESARROLLO DE PRODUCTOS: % DE CUOTA DE LOS ACTORES CLAVE, 2022-2030, (%) 57
    32. FIGURA 32 COLABORACIÓN Y ASOCIACIÓN: % PARTICIPACIÓN POR ACTORES CLAVE, 2022-2030, (%) 58
    33. FIGURA 33 EXPANSIÓN: % PARTICIPACIÓN POR ACTORES CLAVE, 2015-2022, (%) 58
    34. FIGURA 34 FUSIÓN Y ADQUISICIÓN: % PARTICIPACIÓN POR PARTICIPANTES CLAVE, 2022-2030 59
    35. FIGURA 35 ALPINE ELECTRONICS, INC: INGRESOS TOTALES VS INGRESOS SEGMENTALES (NEGOCIO DE EQUIPOS DE AUDIO Y NEGOCIO DE EQUIPOS DE COMUNICACIÓN 60
    36. FIGURA 36 ALPINE ELECTRONICS, INC: MEZCLA DE INGRESOS GEOGRÁFICOS, 2022 (%) 61
    37. FIGURA 37 CONTINENTAL: INGRESOS TOTALES VS INGRESOS SEGMENTALES (DIVISIÓN INTERIOR) 64
    38. FIGURA 38 DIVISIÓN INTERIOR: MEZCLA DE INGRESOS GEOGRÁFICOS, 2015 (EN %) 65
    39. FIGURA 39 CONTINENTAL: DESARROLLOS CLAVE, 2022-2030 (%) 66
    40. FIGURA 40 HARMAN INTERNATIONAL: INGRESOS TOTALES VS. INGRESOS SEGMENTALES (INFOTAINMENT) 68
    41. FIGURA 41 HARMAN INTERNATIONAL: MEZCLA DE INGRESOS GEOGRÁFICOS, 2015 (%) 68
    42. FIGURA 42 HARMAN INTERNATIONAL: DESARROLLOS CLAVE, 2022-2030 (%) 69
    43. FIGURA 43 PANASONIC CORPORATION: VENTAS NETAS VS. VENTAS SEGMENTALES, 2022-2030 (MILLONES DE USD) 70
    44. FIGURA 44 PANASONIC CORPORATION: MEZCLA DE INGRESOS GEOGRÁFICOS, 2022 (EN %) 71
    45. FIGURA 45 PANASONIC CORPORACIÓN: DESARROLLOS CLAVE, 2022-2030 (EN %) 72
    46. FIGURA 46 PIONEER CORPORATION: VENTAS NETAS VS. VENTAS SEGMENTALES, 2022-2030 (MILLONES DE USD) 73
    47. FIGURA 47 PIONEER CORPORATION: MEZCLA DE INGRESOS GEOGRÁFICOS, 2022 (%) 74
    48. FIGURA 48 PIONEER CORPORATION: DESARROLLOS CLAVE, 2022-2030 (%) 75
    49. FIGURA 49 DENSO CORPORATION: INGRESOS TOTALES VS. INGRESOS SEGMENTALES (INFORMACIÓN Y SEGURIDAD) 78
    50. FIGURA 50 DENSO CORPORATION: MEZCLA DE INGRESOS GEOGRÁFICOS, 2022 (%) 78
    51. FIGURA 51 DENSO CORPORATION: DESARROLLOS CLAVE, 2022-2030 (%) 79
    52. FIGURA 52 GARMIN LTD: INGRESOS TOTALES VS INGRESOS SEGMENTALES (AUTO) 81
    53. FIGURA 53 GARMIN LTD: DESARROLLOS CLAVE, 2022-2030 (%) 81
    54. FIGURA 54 JVCKENWOOD CORPORATION: INGRESOS TOTALES VS INGRESOS SEGMENTALES (SECTOR AUTOMOTRIZ) 83
    55. FIGURA 55 JVCKENWOOD CORPORATION: MEZCLA DE INGRESOS POR GEOGRAFÍA (2022) 83
    56. FIGURA 56 JVCKENWOOD CORPORATION: DESARROLLOS CLAVE, 2022-2030 (%) 84
    57. FIGURA 57 DELPHI AUTOMOTIVE PLC: INGRESOS TOTALES VS. INGRESOS POR SEGMENTO (ELECTRÓNICA Y SEGURIDAD) 86
    58. FIGURA 58 DELPHI AUTOMOTIVE PLC: MEZCLA GEOGRÁFICA DE INGRESOS, 2022 (EN %) 86
    59. FIGURA 59 DELPHI AUTOMOTIVE PLC: DESARROLLOS CLAVE, 2022-2030 (%) 87
    60. FIGURA 60 ALLGO EMBEDDED SYSTEMS PVT LTD: DESARROLLOS CLAVE, 2022-2030 (%) 89

Segmentación del mercado de infoentretenimiento automotriz

Perspectivas del sistema operativo de infoentretenimiento automotriz (miles de millones de USD, 2018-2030)

  • QNX

  • Linux

  • Microsoft

  • Otros

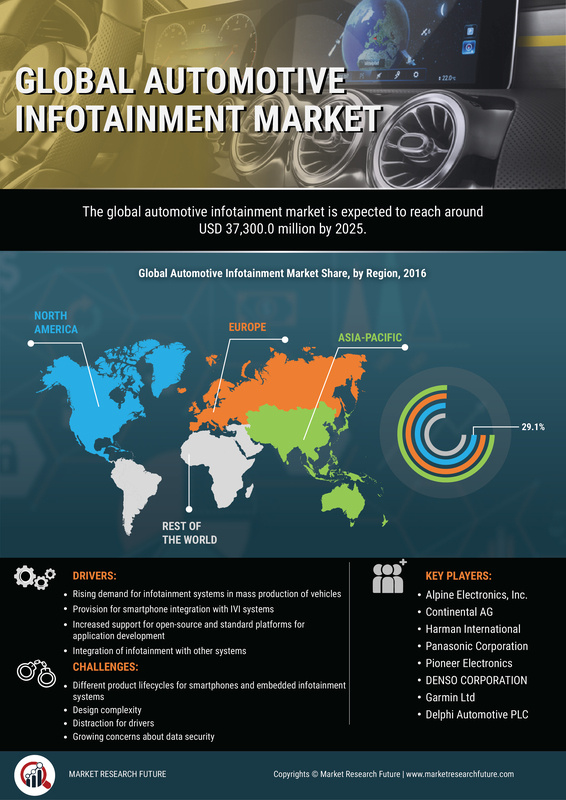
Perspectivas regionales del infoentretenimiento automotriz (miles de millones de USD, 2018-2030)

  • Perspectivas de América del Norte (miles de millones de USD, 2018-2030)

    • Infoentretenimiento automotriz en América del Norte por sistema operativo Sistema

      • QNX

      • Linux

      • Microsoft

      • Otros

    • Perspectivas de EE. UU. (miles de millones de dólares, 2018-2030)

    • Infoentretenimiento automotriz de EE. UU. por sistema operativo

      • QNX

      • Linux

      • Microsoft

      • Otros

    • Perspectivas de CANADÁ (miles de millones de dólares, 2018-2030)

    • Infoentretenimiento automotriz en CANADÁ por sistema operativo

      • QNX

      • Linux

      • Microsoft

      • Otros

  • Perspectivas para Europa (miles de millones de USD, 2018-2030)

    • Infoentretenimiento automotriz en Europa por sistema operativo Sistema

      • QNX

      • Linux

      • Microsoft

      • Otros

    • Alemania Perspectivas (miles de millones de USD, 2018-2030)

    • Infoentretenimiento automotriz en Alemania por sistema operativo

      • QNX

      • Linux

      • Microsoft

      • Otros

    • Francia Perspectivas (miles de millones de USD, 2018-2030)

    • Infoentretenimiento automotriz en Francia por sistema operativo

      • QNX

      • Linux

      • Microsoft

      • Otros

    • Perspectivas del Reino Unido (miles de millones de USD, 2018-2030)

    • Infoentretenimiento automotriz en el Reino Unido por sistema operativo Sistema

      • QNX

      • Linux

      • Microsoft

      • Otros

    • Perspectivas de ITALIA (miles de millones de dólares, 2018-2030)

    • ITALIA Infoentretenimiento automotriz por sistema operativo

      • QNX

      • Linux

      • Microsoft

      • Otros

    • ESPAÑA Outlook (millones de dólares, 2018-2030)

    • Infoentretenimiento para automoción en España por sistema operativo

      • QNX

      • Linux

      • Microsoft

      • Otros

    • Perspectivas para el resto de Europa (miles de millones de USD, 2018-2030)

    • Infoentretenimiento para automoción en el resto de Europa por sistema operativo Sistema

      • QNX

      • Linux

      • Microsoft

      • Otros

  • Perspectivas de Asia y el Pacífico (miles de millones de dólares, 2018-2030)

    • Infoentretenimiento automotriz de Asia y el Pacífico por sistema operativo

      • QNX

      • Linux

      • Microsoft

      • Otros

    • Perspectivas de China (miles de millones de dólares, 2018-2030)

    • Infoentretenimiento automotriz en China por sistema operativo

      • QNX

      • Linux

      • Microsoft

      • Otros

    • Perspectivas para Japón (miles de millones de USD, 2018-2030)

    • Infoentretenimiento automotriz en Japón por sistema operativo Sistema

      • QNX

      • Linux

      • Microsoft

      • Otros

    • Perspectivas de la India (miles de millones de dólares, 2018-2030)

    • Infoentretenimiento automotriz en India por sistema operativo

      • QNX

      • Linux

      • Microsoft

      • Otros

    • Perspectivas de Australia (miles de millones de dólares, 2018-2030)

    • Infoentretenimiento automotriz en Australia por sistema operativo

      • QNX

      • Linux

      • Microsoft

      • Otros

    • Perspectivas para el resto de Asia-Pacífico (miles de millones de USD, 2018-2030)

    • Infoentretenimiento automotriz en el resto de Asia-Pacífico por sistema operativo Sistema

      • QNX

      • Linux

      • Microsoft

      • Otros

  • Perspectivas para el resto del mundo (miles de millones de USD, 2018-2030)

    • Infoentretenimiento automotriz en el resto del mundo por sistema operativo

      • QNX

      • Linux

      • Microsoft

      • Otros

    • Perspectivas para Oriente Medio (miles de millones de USD, 2018-2030)

    • Infoentretenimiento automotriz en Oriente Medio por sistema operativo

      • QNX

      • Linux

      • Microsoft

      • Otros

    • Perspectivas para África (miles de millones de USD, 2018-2030)

    • Infoentretenimiento automotriz en África por sistema operativo Sistema

      • QNX

      • Linux

      • Microsoft

      • Otros

    • Perspectivas de América Latina (miles de millones de dólares, 2018-2030)

    • Infoentretenimiento automotriz en Latinoamérica por sistema operativo

      • QNX

      • Linux

      • Microsoft

      • Otros

Compare Licence

×
Features License Type
Single User Multiuser License Enterprise User
Price $4,950 $5,950 $7,250
Maximum User Access Limit 1 User Upto 10 Users Unrestricted Access Throughout the Organization
Free Customization
Direct Access to Analyst
Deliverable Format
Platform Access
Discount on Next Purchase 10% 15% 15%
Printable Versions