• Cat-intel
  • MedIntelliX
  • Resources
  • About Us
  • Hero Background
    English
    Chinese
    French
    Japanese
    Korean
    German
    Spanish

    Synthetic Aperture Radar Market Trends

    ID: MRFR/A&D/9475-HCR
    110 Pages
    Swapnil Palwe
    October 2025

    Synthetic Aperture Radar (SAR) Market Research Report Information By Component (Receiver, Transmitter and Antenna), By Platform (Airborne Spacecraft, Aircraft and Unmanned Aerial Vehicle (UAV) and Ground), By Frequency Band (X Band, L Band, C Band, S Band, K, Ku, Ka Band, UHF/VHF Band ) By Application (Defense, Commercial, Public Safety, Environmental Monitoring, Natural Resource Exploration ),...

    Share:
    Download PDF ×

    We do not share your information with anyone. However, we may send you emails based on your report interest from time to time. You may contact us at any time to opt-out.

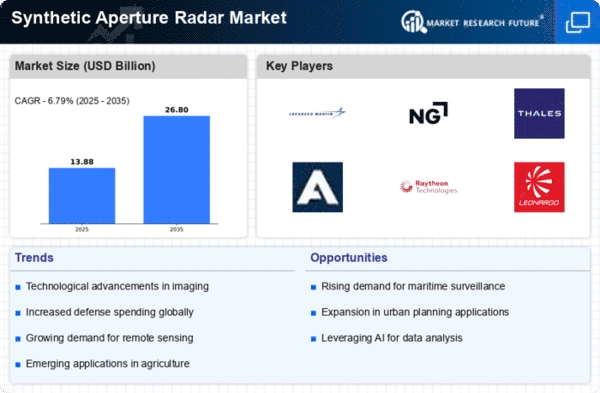
    Synthetic Aperture Radar Market Infographic
    $ 4,950.0
    $ 5,950.0
    $ 7,250.0

    Market Trends

    Key Emerging Trends in the Synthetic Aperture Radar Market

    The Synthetic Aperture Radar (SAR) market is experiencing notable trends and advancements, driven by the increasing demand for high-resolution imaging, surveillance, and reconnaissance capabilities across various industries. This market, essential for providing detailed and accurate radar images from airborne or spaceborne platforms, is shaped by key factors that reflect technological progress, expanding applications, and a growing need for real-time data. One of the primary drivers influencing the SAR market is the expanding scope of applications. Originally developed for military reconnaissance, SAR technology has found diverse applications in sectors such as agriculture, forestry, environmental monitoring, disaster management, and infrastructure development. The versatility of SAR in capturing detailed images, irrespective of weather conditions or time of day, makes it a valuable tool for a wide range of industries.

    Technological advancements play a pivotal role in shaping the trends within the SAR market. The development of advanced SAR systems with higher resolution, improved image processing capabilities, and enhanced data analytics has expanded the market's capabilities. Miniaturization and integration of SAR sensors into smaller platforms, including unmanned aerial vehicles (UAVs) and small satellites, contribute to the accessibility and affordability of SAR data, fostering its adoption in various commercial applications.

    The market is witnessing a growing demand for real-time or near-real-time SAR data. As industries increasingly rely on timely information for decision-making, the ability to acquire and process SAR imagery rapidly has become a significant trend. Applications such as disaster response, agricultural monitoring, and infrastructure management benefit from the availability of up-to-date SAR data, enabling more informed and timely decision-making.

    The trend towards the development of high-resolution SAR satellites is influencing the market dynamics. High-resolution SAR imagery allows for detailed mapping and analysis, making it valuable for applications such as urban planning, environmental monitoring, and defense surveillance. The market is responding to the demand for sharper and more detailed images by introducing SAR systems with improved spatial resolution, enhancing their effectiveness in diverse sectors.

    The SAR market is experiencing a shift towards data analytics and artificial intelligence (AI) integration. The sheer volume of data generated by SAR systems requires advanced analytics tools to extract meaningful insights. Integration with AI algorithms allows for automated image interpretation, change detection, and anomaly identification, streamlining the process of extracting actionable information from SAR data. This trend aligns with the broader industry push towards leveraging AI in remote sensing applications.

    International collaborations and partnerships are playing a crucial role in shaping the SAR market. Governments, space agencies, and private entities are collaborating to deploy SAR satellites, share data, and collectively address global challenges. These partnerships enhance the availability of SAR data on a global scale, fostering international cooperation in disaster response, environmental monitoring, and scientific research.

    Market Summary

    As per Market Research Future Analysis, the Synthetic Aperture Radar (SAR) market is poised for significant growth, projected to reach USD 13.4 billion by 2030, with a CAGR of 12.3% from 2024 to 2032. The technology is essential for creating high-resolution images and 3D reconstructions, primarily utilized in military applications for surveillance and reconnaissance. The COVID-19 pandemic temporarily hampered R&D and military investments, but demand is expected to rebound as production resumes. Key drivers include the increasing need for environmental awareness and effective surveillance systems, while high development costs remain a restraint. The market is segmented by component, platform, frequency band, application, and mode, with North America leading in technological advancements and military spending.

    Key Market Trends & Highlights

    The Synthetic Aperture Radar market is characterized by several key trends and opportunities.

    • Market expected to reach USD 13.4 billion by 2030; CAGR of 12.3% from 2024 to 2032. Rising demand from military applications for precision targeting and surveillance. Development of dual-band SARs and miniaturization for UAVs driving market growth. North America holds the largest market share, supported by significant defense budgets.

    Market Size & Forecast

    Market Size USD 13.4 Billion by 2030
    CAGR 12.3% (2024-2032)
    Largest Regional Market North America
    Key Applications Military, Environmental Monitoring, Commercial.

    Major Players

    <p>Key players include Lockheed Martin Corporation, <a href="https://en.wikipedia.org/wiki/Synthetic-aperture_radar">Northrop Grumman Corporation</a>, Raytheon Company, Thales Group, and BAE Systems.</p>

    Market Trends

    <p>The increasing demand for advanced surveillance and reconnaissance capabilities is driving innovation in the Synthetic Aperture Radar sector, as nations seek to enhance their defense and intelligence operations.</p>

    U.S. Department of Defense

    Synthetic Aperture Radar Market Market Drivers

    Increasing Demand for Earth Observation

    The Global Synthetic Aperture Radar Market Industry is experiencing a surge in demand for earth observation applications. Governments and organizations are increasingly relying on SAR technology for monitoring environmental changes, urban development, and disaster management. For instance, the European Space Agency's Sentinel missions utilize SAR for land monitoring, providing critical data for climate studies. This trend is expected to drive the market's growth, with the market projected to reach 8.8 USD Billion in 2024. The need for accurate and timely data continues to fuel investments in SAR systems, indicating a robust future for the industry.

    Market Segment Insights

    Regional Insights

    Key Companies in the Synthetic Aperture Radar Market market include

    Industry Developments

    Future Outlook

    Synthetic Aperture Radar Market Future Outlook

    <p>The Synthetic Aperture Radar Market is projected to grow at a 9.52% CAGR from 2024 to 2035, driven by advancements in remote sensing technology and increasing defense applications.</p>

    New opportunities lie in:

    • <p>Develop AI-driven analytics for enhanced data interpretation in SAR applications. Expand into emerging markets with tailored solutions for agriculture and environmental monitoring. Collaborate with tech firms to integrate SAR with UAV systems for improved reconnaissance capabilities.</p>

    <p>By 2035, the Synthetic Aperture Radar Market is expected to achieve substantial growth, reflecting its critical role in various sectors.</p>

    Market Segmentation

    Synthetic Aperture Radar (SAR) Market Segmentation

    Report Scope

    Report Attribute/MetricDetails
    Market Size 2030USD 13.4 billion
    Compound Annual Growth Rate (CAGR)12.3% (2024-2032)
    Base Year2023
    Market Forecast Period2024-2032
    Historical Data2019- 2022
    Market Forecast UnitsValue (USD Billion)
    Report CoverageRevenue Forecast, Market Competitive Landscape, Growth Factors, and Trends
    Segments CoveredComponent, Platform, Frequency Band, Application, Mode, Region
    Geographies CoveredNorth America, Europe, Asia Pacific, and the Rest of the World
    Countries CoveredThe U.S., Canada, German, France, the UK, Italy, Spain, China, Japan, India, Australia, South Korea, and Brazil
    Key Companies Profiled UrtheCast Corp., Thales Group, SkyGeo, Saab AB, Raytheon Company, OHB Systems AG, Northrop Grumman Corporation, Lockheed Martin Corporation, Leonardo S.p.A., ICEYE, General Atomics, Cobham plc, Capella Space, BAE Systems, and Airbus S.A.S
    Key Market OpportunitiesRising development of dual-band synthetic aperture radars
    Key Market DynamicsIncreasing demand for technologies providing environment awareness

    Market Highlights

    Author

    Swapnil Palwe
    Team Lead - Research

    She holds an experience of about 6+ years in market research and business consulting, working under the spectrum of information communication technology, telecommunications and semiconductor domains. aarti conceptualizes and implements a scalable business strategy and provides strategic leadership to the clients. her expertise lies in market estimation, competitive intelligence, pipeline analysis, customer assessment, etc.

    Leave a Comment

    Latest Comments

    John Doe
    john@example.com

    This is a great article! Really helped me understand the topic better.

    Posted on July 23, 2025, 10:15 AM
    Jane Smith
    jane@domain.com

    Thanks for sharing this. I’ve bookmarked it for later reference.

    Posted on July 22, 2025, 7:45 PM

    FAQs

    How The Synthetic Aperture Radar Market is Growing ?

    Synthetic Aperture Radar Market Grow at a CAGR of 12.3% during the forecast, 2023–2030.

    Who Are The Top Key Vendors of Synthetic Aperture Radar Market ?

    synthetic aperture radar market are urthecast corp., thales group, skygeo, saab ab, raytheon company, ohb systems ag, northrop grumman corporation, lockheed martin corporation, leonardo s.p.a., iceye, general atomics, cobham plc, capella space, bae systems, and airbus S.A.S., and others.

    In which Region Synthetic Aperture Radar Market Is Growing Globally ?

    North America synthetic aperture radar market is a major players and Investing Major Shares in Synthetic Aperture Radar Market

    which is Key Market Drivers of Synthetic Aperture Radar (SAR) Market ?

    Increasing demand for synthetic aperture radar from military and defense sector

    1. --- 'Table of Contents
    2. Executive Summary
      1. Market Attractiveness Analysis
        1. Global Synthetic Aperture Radar Market, by Component
        2. Global Synthetic Aperture Radar Market, by Platform
        3. Global Synthetic Aperture Radar Market, by Frequency Band
        4. Global Synthetic Aperture Radar Market, by Application
        5. Global Synthetic Aperture Radar Market, by Mode
        6. Global Synthetic Aperture Radar Market, by Region
    3. Market Introduction
      1. Definition
      2. Scope of the Study
      3. Market Structure
    4. Research Methodology
      1. Research Process
      2. Primary Research
      3. Secondary Research
      4. Market Size Estimation
      5. List of Assumptions
    5. MARKET DYNAMICS
      1. Introduction
      2. Drivers
        1. Increasing demand for synthetic aperture radar from military and defense sector
        2. Driver Impact Analysis
      3. Restraints
        1. The Cost Involved in The Development of a Synthetic Aperture Radar
        2. Restraint Impact Analysis
      4. Opportunity
        1. Rising development of dual-band synthetic aperture radars
      5. Impact of COVID-19
        1. Impact on synthetic aperture radar Developments
        2. Covid-19 Impact on military and defense sector
    6. MARKET FACTOR ANALYSIS
      1. Value Chain Analysis/Supply Chain Analysis
      2. Porter’s Five Forces Model
        1. Bargaining Power of Suppliers
        2. Bargaining Power of Buyers
        3. Threat of New Entrants
        4. Threat of Substitutes
        5. Intensity of Rivalry
    7. GLOBAL SYNTHETIC APERTURE RADAR MARKET, BY COMPONENT
      1. Introduction
      2. Receiver
      3. Transmitter
      4. Antenna
    8. GLOBAL SYNTHETIC APERTURE RADAR MARKET, BY PLATFORM
      1. Introduction
      2. Others
      3. Airborne
        1. Spacecraft
        2. Aircraft
        3. Unmanned Aerial Vehicle (UAV)
      4. Ground
    9. GLOBAL SYNTHETIC APERTURE RADAR MARKET, BY FREQUENCY BAND
      1. Introduction
      2. X Band
      3. L Band
      4. C Band
      5. S Band
      6. K, Ku, Ka Band
      7. UHF/VHF Band
      8. Others
    10. GLOBAL SYNTHETIC APERTURE RADAR MARKET, BY APPLICATION
      1. Introduction
      2. Defense
      3. Commercial
      4. Public Safety
      5. Environmental Monitoring
      6. Natural Resource Exploration
      7. Others
    11. GLOBAL SYNTHETIC APERTURE RADAR MARKET, BY MODE
      1. Introduction
      2. Multimode
      3. Single Mode
    12. GLOBAL SYNTHETIC APERTURE RADAR MARKET, BY REGION
      1. Overview
      2. North America
        1. Market Size & Estimates, by Country, 2024-2030
        2. Market Size & Estimates, by Component, 2024-2030
        3. Market Size & Estimates, by Platform, 2024-2030
        4. Market Size & Estimates, by Frequency Band, 2024-2030
        5. Market Size & Estimates, by Application, 2024-2030
        6. Market Size & Estimates, by Mode, 2024-2030
        7. US
        8. Canada
        9. Mexico
      3. Europe
        1. Market Size & Estimates, by Country, 2024-2030
        2. Market Size & Estimates, by Component, 2024-2030
        3. Market Size & Estimates, by Platform, 2024-2030
        4. Market Size & Estimates, by Frequency Band, 2024-2030
        5. Market Size & Estimates, by Application, 2024-2030
        6. Germany
        7. UK
        8. France
        9. Rest of Europe
      4. Asia Pacific
        1. Market Size & Estimates, by Country, 2024-2030
        2. Market Size & Estimates, by Component, 2024-2030
        3. Market Size & Estimates, by Platform, 2024-2030
        4. Market Size & Estimates, by Frequency Band, 2024-2030
        5. Market Size & Estimates, by Application, 2024-2030
        6. Market Size & Estimates, by Mode, 2024-2030
        7. China
        8. Japan
        9. India
        10. Rest of Asia-Pacific
      5. Middle East & Africa
        1. Market Size & Estimates, by Component, 2024-2030
        2. Market Size & Estimates, by Platform, 2024-2030
        3. Market Size & Estimates, by Frequency Band, 2024-2030
        4. Market Size & Estimates, by Application, 2024-2030
        5. Market Size & Estimates, by Mode, 2024-2030
      6. South America
        1. Market Size & Estimates, by Component, 2024-2030
        2. Market Size & Estimates, by Platform, 2024-2030
        3. Market Size & Estimates, by Frequency Band, 2024-2030
        4. Market Size & Estimates, by Application, 2024-2030
        5. Market Size & Estimates, by Mode, 2024-2030
    13. Competitive Landscape
      1. Introduction
      2. Competitive Benchmarking
      3. Key Developments & Growth Strategies
        1. New Product Development
        2. Mergers & Acquisitions
        3. Contracts & Agreements
    14. COMPANY PROFILES
      1. UrtheCast Corp.
        1. Company Overview
        2. Financial Overview
        3. Products/Services/Solutions Offered
        4. Key Developments
        5. SWOT Analysis
        6. Key Strategies
      2. Thales Group
        1. Company Overview
        2. Financial Overview
        3. Products/Services/Solutions Offered
        4. Key Developments
        5. SWOT Analysis
        6. Key Strategies
      3. SkyGeo
        1. Company Overview
        2. Financial Overview
        3. Products/Services/Solutions Offered
        4. Key Developments
        5. SWOT Analysis
        6. Key Strategies
      4. Saab AB
        1. Company Overview
        2. Financial Overview
        3. Products/Services/Solutions Offered
        4. Key Developments
        5. SWOT Analysis
        6. Key Strategies
      5. Raytheon Company
        1. Company Overview
        2. Financial Overview
        3. Products/Services/Solutions Offered
        4. Key Developments
        5. SWOT Analysis
        6. Key Strategies
      6. OHB Systems AG
        1. Company Overview
        2. Financial Overview
        3. Products/Services/Solutions Offered
        4. Key Developments
        5. SWOT Analysis
        6. Key Strategies
      7. Northrop Grumman Corporation
        1. Company Overview
        2. Financial Overview
        3. Products/Services/Solutions Offered
        4. Key Developments
        5. SWOT Analysis
        6. Key Strategies
      8. Lockheed Martin Corporation
        1. Company Overview
        2. Financial Overview
        3. Products/Services/Solutions Offered
        4. Key Developments
        5. SWOT Analysis
        6. Key Strategies
      9. Leonardo S.p.A.
        1. Company Overview
        2. Financial Overview
        3. Products/Services/Solutions Offered
        4. Key Developments
        5. SWOT Analysis
        6. Key Strategies
      10. ICEYE
        1. Company Overview
        2. Financial Overview
        3. Products/Services/Solutions Offered
        4. Key Developments
        5. SWOT Analysis
        6. Key Strategies
      11. General Atomics
        1. Company Overview
        2. Financial Overview
        3. Products/Services/Solutions Offered
        4. Key Developments
        5. SWOT Analysis
        6. Key Strategies
      12. Cobham plc,
        1. Company Overview
        2. Financial Overview
        3. Products/Services/Solutions Offered
        4. Key Developments
        5. SWOT Analysis
        6. Key Strategies
      13. Capella Space
        1. Company Overview
        2. Financial Overview
        3. Products/Services/Solutions Offered
        4. Key Developments
        5. SWOT Analysis
        6. Key Strategies
      14. BAE Systems
        1. Company Overview
        2. Financial Overview
        3. Products/Services/Solutions Offered
        4. Key Developments
        5. SWOT Analysis
        6. Key Strategies
      15. Airbus S.A.S
        1. Company Overview
        2. Financial Overview
        3. Products/Services/Solutions Offered
        4. Key Developments
        5. SWOT Analysis
        6. Key Strategies
    15. List of Tables and Figures
      1. LIST OF TABLES
      2. TABLE 1 LIST OF ASSUMPTIONS
      3. TABLE 2 GLOBAL SYNTHETIC APERTURE RADAR MARKET, BY COMPONENT, 2024-2030 (USD BILLION)
      4. TABLE 3 GLOBAL SYNTHETIC APERTURE RADAR MARKET, BY PLATFORM, 2024-2030 (USD BILLION)
      5. TABLE 4 GLOBAL SYNTHETIC APERTURE RADAR MARKET, BY FREQUENCY BAND, 2024-2030 (USD BILLION)
      6. TABLE 5 GLOBAL SYNTHETIC APERTURE RADAR MARKET, BY APPLICATION, 2024-2030 (USD BILLION)
      7. TABLE 6 GLOBAL SYNTHETIC APERTURE RADAR MARKET, BY REGION, 2024-2030 (USD BILLION)
      8. TABLE 7 NORTH AMERICA: SYNTHETIC APERTURE RADAR MARKET, BY COUNTRY, 2024-2030 (USD BILLION)
      9. TABLE 8 NORTH AMERICA: SYNTHETIC APERTURE RADAR MARKET, BY COMPONENT, 2024-2030 (USD BILLION)
      10. TABLE 9 NORTH AMERICA: SYNTHETIC APERTURE RADAR MARKET, BY PLATFORM, 2024-2030 (USD BILLION)
      11. TABLE 10 NORTH AMERICA: SYNTHETIC APERTURE RADAR MARKET, BY FREQUENCY BAND, 2024-2030 (USD BILLION)
      12. TABLE 11 NORTH AMERICA: SYNTHETIC APERTURE RADAR MARKET, BY APPLICATION, 2024-2030 (USD BILLION)
      13. TABLE 12 US: SYNTHETIC APERTURE RADAR MARKET, BY COMPONENT, 2024-2030 (USD BILLION)
      14. TABLE 13 US: SYNTHETIC APERTURE RADAR MARKET, BY PLATFORM, 2024-2030 (USD BILLION)
      15. TABLE 14 US: SYNTHETIC APERTURE RADAR MARKET, BY FREQUENCY BAND, 2024-2030 (USD BILLION)
      16. TABLE 15 US: SYNTHETIC APERTURE RADAR MARKET, BY APPLICATION, 2024-2030 (USD BILLION)
      17. TABLE 16 CANADA: SYNTHETIC APERTURE RADAR MARKET, BY COMPONENT, 2024-2030 (USD BILLION)
      18. TABLE 17 CANADA: SYNTHETIC APERTURE RADAR MARKET, BY PLATFORM, 2024-2030 (USD BILLION)
      19. TABLE 18 CANADA: SYNTHETIC APERTURE RADAR MARKET, BY FREQUENCY BAND, 2024-2030 (USD BILLION)
      20. TABLE 19 CANADA: SYNTHETIC APERTURE RADAR MARKET, BY APPLICATION, 2024-2030 (USD BILLION)
      21. TABLE 20 MEXICO: SYNTHETIC APERTURE RADAR MARKET, BY COMPONENT, 2024-2030 (USD BILLION)
      22. TABLE 21 MEXICO: SYNTHETIC APERTURE RADAR MARKET, BY PLATFORM, 2024-2030 (USD BILLION)
      23. TABLE 22 MEXICO: SYNTHETIC APERTURE RADAR MARKET, BY FREQUENCY BAND, 2024-2030 (USD BILLION)
      24. TABLE 23 MEXICO: SYNTHETIC APERTURE RADAR MARKET, BY APPLICATION, 2024-2030 (USD BILLION)
      25. TABLE 24 EUROPE: SYNTHETIC APERTURE RADAR MARKET, BY COUNTRY, 2024-2030 (USD BILLION)
      26. TABLE 25 EUROPE: SYNTHETIC APERTURE RADAR MARKET, BY COMPONENT, 2024-2030 (USD BILLION)
      27. TABLE 26 EUROPE: SYNTHETIC APERTURE RADAR MARKET, BY PLATFORM, 2024-2030 (USD BILLION)
      28. TABLE 27 EUROPE: SYNTHETIC APERTURE RADAR MARKET, BY FREQUENCY BAND, 2024-2030 (USD BILLION)
      29. TABLE 28 EUROPE: SYNTHETIC APERTURE RADAR MARKET, BY APPLICATION, 2024-2030 (USD BILLION)
      30. TABLE 29 UK: SYNTHETIC APERTURE RADAR MARKET, BY COMPONENT, 2024-2030 (USD BILLION)
      31. TABLE 30 UK: SYNTHETIC APERTURE RADAR MARKET, BY PLATFORM, 2024-2030 (USD BILLION)
      32. TABLE 31 UK: SYNTHETIC APERTURE RADAR MARKET, BY FREQUENCY BAND, 2024-2030 (USD BILLION)
      33. TABLE 32 UK: SYNTHETIC APERTURE RADAR MARKET, BY APPLICATION, 2024-2030 (USD BILLION)
      34. TABLE 33 GERMANY: SYNTHETIC APERTURE RADAR MARKET, BY COMPONENT, 2024-2030 (USD BILLION)
      35. TABLE 34 GERMANY: SYNTHETIC APERTURE RADAR MARKET, BY PLATFORM, 2024-2030 (USD BILLION)
      36. TABLE 35 GERMANY: SYNTHETIC APERTURE RADAR MARKET, BY FREQUENCY BAND, 2024-2030 (USD BILLION)
      37. TABLE 36 GERMANY: SYNTHETIC APERTURE RADAR MARKET, BY APPLICATION, 2024-2030 (USD BILLION)
      38. TABLE 37 FRANCE: SYNTHETIC APERTURE RADAR MARKET, BY COMPONENT, 2024-2030 (USD BILLION)
      39. TABLE 38 FRANCE: SYNTHETIC APERTURE RADAR MARKET, BY PLATFORM, 2024-2030 (USD BILLION)
      40. TABLE 39 FRANCE: SYNTHETIC APERTURE RADAR MARKET, BY FREQUENCY BAND, 2024-2030 (USD BILLION)
      41. TABLE 40 FRANCE: SYNTHETIC APERTURE RADAR MARKET, BY APPLICATION, 2024-2030 (USD BILLION)
      42. TABLE 41 REST OF EUROPE: SYNTHETIC APERTURE RADAR MARKET, BY COMPONENT, 2024-2030 (USD BILLION)
      43. TABLE 42 REST OF EUROPE: SYNTHETIC APERTURE RADAR MARKET, BY PLATFORM, 2024-2030 (USD BILLION)
      44. TABLE 43 REST OF EUROPE: SYNTHETIC APERTURE RADAR MARKET, BY FREQUENCY BAND, 2024-2030 (USD BILLION)
      45. TABLE 44 REST OF EUROPE: SYNTHETIC APERTURE RADAR MARKET, BY APPLICATION, 2024-2030 (USD BILLION)
      46. TABLE 45 ASIA-PACIFIC: SYNTHETIC APERTURE RADAR MARKET, BY COUNTRY, 2024-2030 (USD BILLION)
      47. TABLE 46 ASIA-PACIFIC: SYNTHETIC APERTURE RADAR MARKET, BY COMPONENT, 2024-2030 (USD BILLION)
      48. TABLE 47 ASIA-PACIFIC: SYNTHETIC APERTURE RADAR MARKET, BY PLATFORM, 2024-2030 (USD BILLION)
      49. TABLE 48 ASIA-PACIFIC: SYNTHETIC APERTURE RADAR MARKET, BY FREQUENCY BAND, 2024-2030 (USD BILLION)
      50. TABLE 49 ASIA-PACIFIC: SYNTHETIC APERTURE RADAR MARKET, BY APPLICATION, 2024-2030 (USD BILLION)
      51. TABLE 50 CHINA: SYNTHETIC APERTURE RADAR MARKET, BY COMPONENT, 2024-2030 (USD BILLION)
      52. TABLE 51 CHINA: SYNTHETIC APERTURE RADAR MARKET, BY PLATFORM, 2024-2030 (USD BILLION)
      53. TABLE 52 CHINA: SYNTHETIC APERTURE RADAR MARKET, BY FREQUENCY BAND, 2024-2030 (USD BILLION)
      54. TABLE 53 CHINA: SYNTHETIC APERTURE RADAR MARKET, BY APPLICATION, 2024-2030 (USD BILLION)
      55. TABLE 54 JAPAN: SYNTHETIC APERTURE RADAR MARKET, BY COMPONENT, 2024-2030 (USD BILLION)
      56. TABLE 55 JAPAN: SYNTHETIC APERTURE RADAR MARKET, BY PLATFORM, 2024-2030 (USD BILLION)
      57. TABLE 56 JAPAN: SYNTHETIC APERTURE RADAR MARKET, BY FREQUENCY BAND, 2024-2030 (USD BILLION)
      58. TABLE 57 JAPAN: SYNTHETIC APERTURE RADAR MARKET, BY APPLICATION, 2024-2030 (USD BILLION)
      59. TABLE 58 INDIA: SYNTHETIC APERTURE RADAR MARKET, BY COMPONENT, 2024-2030 (USD BILLION)
      60. TABLE 59 INDIA: SYNTHETIC APERTURE RADAR MARKET, BY PLATFORM, 2024-2030 (USD BILLION)
      61. TABLE 60 INDIA: SYNTHETIC APERTURE RADAR MARKET, BY FREQUENCY BAND, 2024-2030 (USD BILLION)
      62. TABLE 61 INDIA: SYNTHETIC APERTURE RADAR MARKET, BY APPLICATION, 2024-2030 (USD BILLION)
      63. TABLE 62 REST OF ASIA-PACIFIC: SYNTHETIC APERTURE RADAR MARKET, BY COMPONENT, 2024-2030 (USD BILLION)
      64. TABLE 63 REST OF ASIA-PACIFIC: SYNTHETIC APERTURE RADAR MARKET, BY PLATFORM, 2024-2030 (USD BILLION)
      65. TABLE 64 REST OF ASIA-PACIFIC: SYNTHETIC APERTURE RADAR MARKET, BY FREQUENCY BAND, 2024-2030 (USD BILLION)
      66. TABLE 65 REST OF ASIA-PACIFIC: SYNTHETIC APERTURE RADAR MARKET, BY APPLICATION, 2024-2030 (USD BILLION)
      67. TABLE 66 MIDDLE EASE & AFRICA: SYNTHETIC APERTURE RADAR MARKET, BY COMPONENT, 2024-2030 (USD BILLION)
      68. TABLE 67 MIDDLE EASE & AFRICA: SYNTHETIC APERTURE RADAR MARKET, BY PLATFORM, 2024-2030 (USD BILLION)
      69. TABLE 68 MIDDLE EASE & AFRICA: SYNTHETIC APERTURE RADAR MARKET, BY FREQUENCY BAND, 2024-2030 (USD BILLION)
      70. TABLE 69 MIDDLE EAST & AFRICA: SYNTHETIC APERTURE RADAR MARKET, BY APPLICATION, 2024-2030 (USD BILLION)
      71. TABLE 70 SOUTH AMERICA: SYNTHETIC APERTURE RADAR MARKET, BY COMPONENT, 2024-2030 (USD BILLION)
      72. TABLE 71 SOUTH AMERICA: SYNTHETIC APERTURE RADAR MARKET, BY PLATFORM, 2024-2030 (USD BILLION)
      73. TABLE 72 SOUTH AMERICA: SYNTHETIC APERTURE RADAR MARKET, BY FREQUENCY BAND, 2024-2030 (USD BILLION)
      74. TABLE 73 SOUTH AMERICA: SYNTHETIC APERTURE RADAR MARKET, BY APPLICATION, 2024-2030 (USD BILLION)     LIST OF FIGURES
      75. FIGURE 1 MARKET SYNOPSIS
      76. FIGURE 2 RESEARCH PROCESS OF MRFR
      77. FIGURE 3 TOP DOWN & Bottom-up Approach
      78. FIGURE 4 GLOBAL SYNTHETIC APERTURE RADAR MARKET, BY COMPONENT, 2024-2030 (USD BILLION)
      79. FIGURE 5 GLOBAL SYNTHETIC APERTURE RADAR MARKET, BY PLATFORM, 2024-2030 (USD BILLION)
      80. FIGURE 6 GLOBAL SYNTHETIC APERTURE RADAR MARKET, BY FREQUENCY BAND, 2024-2030 (USD BILLION)
      81. FIGURE 7 GLOBAL SYNTHETIC APERTURE RADAR MARKET, BY APPLICATION, 2024-2030 (USD BILLION)
      82. FIGURE 8 GLOBAL SYNTHETIC APERTURE RADAR MARKET, BY REGION, 2024-2027 (USD BILLION)
      83. FIGURE 9 NORTH AMERICA: SYNTHETIC APERTURE RADAR MARKET, BY COUNTRY, 2024-2030 (USD BILLION)
      84. FIGURE 10 NORTH AMERICA: SYNTHETIC APERTURE RADAR MARKET, BY COMPONENT, 2024-2030 (USD BILLION)
      85. FIGURE 11 NORTH AMERICA: SYNTHETIC APERTURE RADAR MARKET, BY PLATFORM, 2024-2030 (USD BILLION)
      86. FIGURE 12 NORTH AMERICA: SYNTHETIC APERTURE RADAR MARKET, BY FREQUENCY BAND, 2024-2030 (USD BILLION)
      87. FIGURE 13 NORTH AMERICA: SYNTHETIC APERTURE RADAR MARKET, BY APPLICATION, 2024-2030 (USD BILLION)
      88. FIGURE 14 EUROPE: SYNTHETIC APERTURE RADAR MARKET, BY COUNTRY, 2024-2030 (USD BILLION)
      89. FIGURE 15 EUROPE: SYNTHETIC APERTURE RADAR MARKET, BY COMPONENT, 2024-2030 (USD BILLION)
      90. FIGURE 16 EUROPE: SYNTHETIC APERTURE RADAR MARKET, BY PLATFORM, 2024-2030 (USD BILLION)
      91. FIGURE 17 EUROPE: SYNTHETIC APERTURE RADAR MARKET, BY FREQUENCY BAND, 2024-2030 (USD BILLION)
      92. FIGURE 18 EUROPE: SYNTHETIC APERTURE RADAR MARKET, BY APPLICATION, 2024-2030 (USD BILLION)
      93. FIGURE 19 EUROPE: SYNTHETIC APERTURE RADAR MARKET, BY REGION, 2024-2027 (USD BILLION)
      94. FIGURE 20 ASIA-PACIFIC: SYNTHETIC APERTURE RADAR MARKET, BY COUNTRY, 2024-2030 (USD BILLION)
      95. FIGURE 21 ASIA-PACIFIC: SYNTHETIC APERTURE RADAR MARKET, BY COMPONENT, 2024-2030 (USD BILLION)
      96. FIGURE 22 ASIA-PACIFIC: SYNTHETIC APERTURE RADAR MARKET, BY PLATFORM, 2024-2030 (USD BILLION)
      97. FIGURE 23 ASIA-PACIFIC: SYNTHETIC APERTURE RADAR MARKET, BY FREQUENCY BAND, 2024-2030 (USD BILLION)
      98. FIGURE 24 ASIA-PACIFIC: SYNTHETIC APERTURE RADAR MARKET, BY APPLICATION, 2024-2027 (USD BILLION)
      99. FIGURE 25 MIDDLE EAST & AFRICA: SYNTHETIC APERTURE RADAR MARKET, BY COMPONENT, 2024-2030 (USD BILLION)
      100. FIGURE 26 MIDDLE EAST & AFRICA: SYNTHETIC APERTURE RADAR MARKET, BY PLATFORM, 2024-2030 (USD BILLION)
      101. FIGURE 27 MIDDLE EAST & AFRICA: SYNTHETIC APERTURE RADAR MARKET, BY FREQUENCY BAND, 2024-2030 (USD BILLION)
      102. FIGURE 28 MIDDLE EAST & AFRICA: SYNTHETIC APERTURE RADAR MARKET, BY APPLICATION, 2024-2027 (USD BILLION)
      103. FIGURE 29 SOUTH AMERICA: SYNTHETIC APERTURE RADAR MARKET, BY COMPONENT, 2024-2030 (USD BILLION)
      104. FIGURE 30 SOUTH AMERICA: SYNTHETIC APERTURE RADAR MARKET, BY PLATFORM, 2024-2030 (USD BILLION)
      105. FIGURE 31 SOUTH AMERICA: SYNTHETIC APERTURE RADAR MARKET, BY FREQUENCY BAND, 2024-2030 (USD BILLION)
      106. FIGURE 32 SOUTH AMERICA: SYNTHETIC APERTURE RADAR MARKET, BY APPLICATION, 2024-2027 (USD BILLION)'

    Synthetic Aperture Radar Market Segmentation

    Market Segmentation Overview

    • Detailed segmentation data will be available in the full report
    • Comprehensive analysis by multiple parameters
    • Regional and country-level breakdowns
    • Market size forecasts by segment
    Infographic

    Free Sample Request

    Kindly complete the form below to receive a free sample of this Report

    Get Free Sample

    Customer Strories

    “I am very pleased with how market segments have been defined in a relevant way for my purposes (such as "Portable Freezers & refrigerators" and "last-mile"). In general the report is well structured. Thanks very much for your efforts.”

    Victoria Milne

    Founder
    Case Study
    Chemicals and Materials