5G Neue Funktechnik Markt (2026 – 2035)

5G New Radio Market Size, Share and Research Report By Frequency Band (Sub-6 GHz, 24-40 GHz MmWave, Above 40 GHz Extreme-Band), By Deployment Mode (Non-Standalone, Standalone), By Component (gNB Hardware, Software, Services), By End-User Industry (Telecom Operators, Manufacturing, Public Safety, Transportation & Logistics, Utilities) and By Regional (North America, Europe, Asia-Pacific, South America, Middle East & Africa) - Industry Forecast to 2035.
ID: MRFR/ICT/29938-HCR 100 Pages Nirmit Biswas, Aarti Dhapte Last Updated: September 23, 2026
5G New Radio Market
Market Size
Forecast Period2026-2035
CAGR (2026-2035)23.1%
2025 Market SizeUSD 46.4 Billion
2035 Market SizeUSD 378.3 Billion
Key Players
Huawei Technologies
Ericsson
Nokia
ZTE
Samsung Electronics
Qualcomm Technologies
Opportunities
  • Direct-to-Device Satellite Integration
  • Network Exposure APIs and Data Monetisation
  • Emerging-Market Coverage Gaps

5G New Radio Market Summary

The 5G New Radio Market reached USD 46.4 billion in 2025 and enters the forecast window at USD 58.3 billion in 2026, climbing to USD 378.3 billion by 2035 at a 23.1% CAGR. Two catalysts anchor that trajectory. The United States National Spectrum Strategy committed to studying 2,786 MHz of federal and non-federal bands for reallocation, while the European Union's Digital Decade targets gigabit coverage for every household by 2030 [12][7]. Both convert regulatory intent into procurement cycles that radio vendors can underwrite against.

Carriers are retiring 4G-anchored macro estates faster than most capex plans assumed. Distributed baseband units, fixed-function remote radio heads, and proprietary element managers are giving way to virtualised baseband running on commercial silicon, 64T64R massive-MIMO arrays, and cloud-native service-based cores. Ericsson counts more than 340 commercial 5G networks worldwide, with standalone deployments passing 70 live systems [4][5]. Capital intensity across the top twenty operator groups has held near 17% of revenue through the transition, indicating that software substitution is absorbing cost rather than adding it.

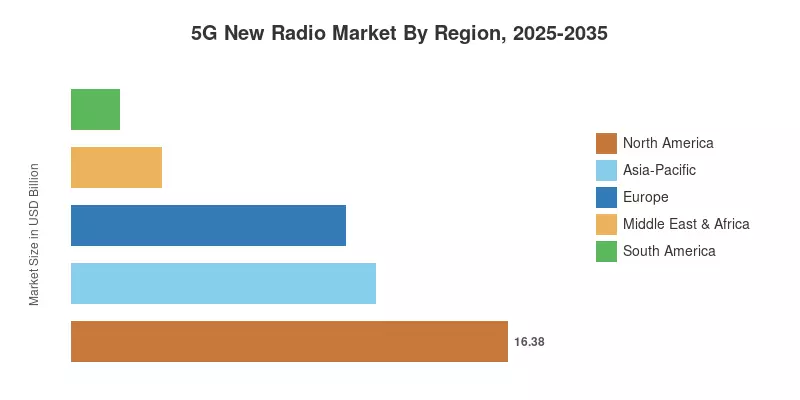
North America holds 35.3% of the 5G New Radio Market on the strength of C-band buildouts and fixed wireless subscriber additions. Asia-Pacific compounds fastest at 24.6% through 2035, propelled by Indian and Chinese densification programmes. Europe follows at USD 10.3 billion in 2025, where consolidation and shared-RAN economics govern the pace. Through 2030, the decisive variable is not coverage but whether enterprise slices convert into billable services.

Key Report Takeaways

• By Frequency Band

  • Sub-6 GHz held 59.6% of 5G New Radio Market revenue in 2025, sustained by refarmed 1800 MHz and 2100 MHz holdings alongside freshly auctioned C-band channels.
  • Above 40 GHz Extreme-Band is the fastest-expanding slice at a 24.3% CAGR through 2035 as 800 MHz to 2 GHz channel widths reach commercial radios.

• By Deployment Mode

  • Non-Standalone architecture accounted for 60.5% of revenue in 2025, reflecting the capex advantage of reusing LTE cores.
  • Standalone posts the highest deployment-mode CAGR at 23.8%, unlocking end-to-end slicing and exposure APIs.

• By Component

  • Software captured 49.1% of 2025 revenue, overtaking radio hardware for the first time in the technology's commercial history.
  • Services compound at 24.9% as operators outsource standalone migration and multi-vendor integration.

• By End-User Industry

  • Telecom Operators represented 53.8% of 2025 spending across the 5G New Radio Market.
  • Manufacturing advances at a 25.5% CAGR, the fastest of any vertical, as plants replace wired fieldbus and Wi-Fi with licensed private networks.

• By Region

  • North America led with 35.3% revenue share in 2025.
  • Asia-Pacific delivers the fastest regional growth in the 5G New Radio Market at a 24.6% CAGR through 2035.
  • Middle East & Africa contributed 7.3% of 2025 revenue, weighted toward Gulf sovereign digitalisation programmes.

Market Size and Forecast (2021–2035)

Figures below combine operator capital expenditure disclosures, vendor segment reporting, customs-level trade data on radio unit shipments, and regulator-published licence obligations. Historical values for the 5G New Radio Market were reconciled against the twenty largest operator groups by capex, then grossed up using national coverage statistics from the ITU and GSA. Forecast years apply an installed-base model keyed to site counts, average radio configuration, and software attach rates rather than to subscriber growth alone.
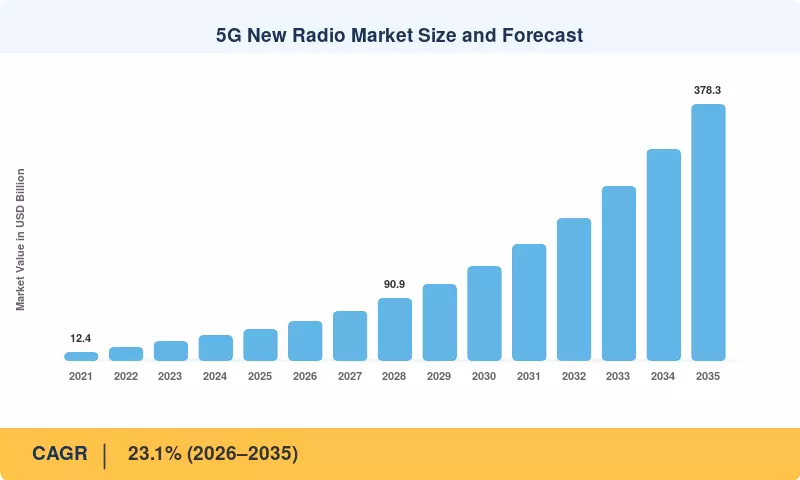
5G New Radio Market Size and Forecast
Our Impact

Enabled $4.3B Revenue Impact for Fortune 500 and Leading Multinationals

Partnering with 2000+ Global Organizations Each Year

30K+ Citations by Top-Tier Firms in the Industry

Driver Impact Analysis

Driver ~% Impact on CAGR Geographic Relevance Impact Timeline
Standalone core migration and network slicing +4.6 pp Global Medium-term (2–4 yr)
Private industrial network build-outs +4.1 pp Asia-Pacific, Europe Medium-term (2–4 yr)
Extreme-band and mid-band spectrum releases +3.8 pp North America, Europe, Asia-Pacific Long-term (≥4 yr)
Mobile video and extended-reality traffic growth +3.4 pp Global Short-term (≤2 yr)
Non-terrestrial network convergence +2.7 pp Global, emerging markets Long-term (≥4 yr)
Fixed wireless access substitution for fibre +2.2 pp North America, South America, MEA Short-term (≤2 yr)
Open RAN and virtualised baseband economics +1.9 pp Europe, Japan, India Medium-term (2–4 yr)


Standalone Core Migration and Network Slicing

Cloud-native cores decouple the radio layer from legacy EPC constraints, and that decoupling is where slicing revenue begins. The GSA recorded 81 operators with live standalone public networks by late 2025, against 49 two years earlier [5]. Slicing lets an operator sell a 99.999% availability tier to a port authority without overbuilding the macro layer. Deutsche Telekom and SK Telecom both report enterprise slice ARPU at four to six times consumer postpaid levels.

Private Industrial Network Build-Outs

Germany's Bundesnetzagentur has issued more than 500 local 3.7–3.8 GHz licences to industrial applicants, each carrying a fee structure calibrated to site area rather than revenue [3]. Manufacturers buy determinism: sub-10-millisecond packet delay budgets that Wi-Fi cannot contractually guarantee across a 40,000-square-metre floorplate. Japan's local 5G framework and Korea's e-Um spectrum scheme follow comparable logic, and each licence typically anchors USD 1.5–4 million of radio and software procurement.

Extreme-Band and Mid-Band Spectrum Releases

Regulators have moved from scarcity management to deliberate supply expansion. The United States National Spectrum Strategy identified 2,786 MHz across five bands for study, while Ofcom awarded 26 GHz and 40 GHz licences in dense urban zones during 2025 [12][8]. Wider channels change the economics directly — an 800 MHz carrier delivers roughly eight times the throughput of a 100 MHz mid-band allocation from the same radio chain, spreading site cost across far more billable capacity.

Mobile Video and Extended-Reality Traffic Growth

Video already exceeds three-quarters of cellular data volume, and Ericsson projects global mobile data traffic reaching 303 exabytes per month by 2030 [4]. Traffic of that shape stresses uplink as much as downlink once user-generated streaming and cloud gaming enter the mix. Operators respond by adding uplink-heavy time-division duplex configurations and supplementary uplink carriers, both of which require radio replacement rather than software licensing alone.

Non-Terrestrial Network Convergence

Release 17 introduced NR profiles for satellite links, and the ITU's IMT-2030 framework treats terrestrial-satellite integration as a baseline capability rather than an adjunct [1][2]. Direct-to-device messaging launched commercially in the United States, Japan, and New Zealand during 2024 and 2025. Coverage economics shift meaningfully: a single low-earth-orbit constellation can serve population densities below two people per square kilometre where macro sites never recover capital.

Fixed Wireless Access Substitution for Fibre

Fixed wireless has become the fastest-growing broadband category in several markets, adding more net subscribers in the United States during 2024 than cable and fibre combined. The World Bank estimates that closing universal broadband gaps demands USD 418 billion in investment, a figure fibre alone cannot absorb in low-density regions [18]. Each fixed wireless deployment pulls additional mid-band capacity layers onto existing towers, converting coverage sites into capacity sites.

Open RAN and Virtualised Baseband Economics

Disaggregation lowers the barrier for challenger suppliers and, more consequentially, shifts spend from depreciating hardware toward renewable licences. The 5G New Radio Market benefits because software margins fund faster feature velocity. Rakuten Mobile and Vodafone report 30–35% total cost of ownership reductions on greenfield open sites against integrated alternatives [13]. Japan's MIC and India's Department of Telecommunications both attach open-interface conditions to portions of their equipment subsidy programmes.

Restraints Impact Analysis

Restraint weightings represent drag on the achievable growth rate observed in the 5G New Radio Market, estimated from procurement delay data, disclosed component lead times, and operator guidance revisions. As with drivers, these are directional and interdependent rather than additive deductions from the headline CAGR.

Restraint ~% Impact on CAGR Geographic Relevance Impact Timeline
RF chipset and component supply constraints −2.4 pp Global Short-term (≤2 yr)
Network energy cost and sustainability limits −1.9 pp Europe, Japan Medium-term (2–4 yr)
Multi-vendor security assurance overhead −1.6 pp Europe, North America Medium-term (2–4 yr)
Millimetre-wave densification economics −1.4 pp Global urban Long-term (≥4 yr)
Auction cost and licence fragmentation −1.1 pp Asia-Pacific, Europe Short-term (≤2 yr)


RF Chipset and Component Supply Constraints

Gallium nitride power amplifiers and high-linearity transceivers remain concentrated among fewer than six qualified suppliers. Lead times for advanced RF front-end modules ran 28 to 40 weeks through 2025, and Qualcomm's filings cite continued dependence on a limited set of foundry partners for advanced-node baseband [21]. Delays of a single quarter on a national rollout typically defer 4–6% of annual radio revenue into the following year.

Network Energy Cost and Sustainability Limits

Radio access equipment consumes roughly 70–80% of mobile network energy, and the NGMN Alliance flags energy per bit as the binding constraint on massive-MIMO scaling [20]. European electricity tariffs during 2023 and 2024 pushed several operators to cap active antenna deployments per site. Sleep-mode software recovers part of the gap, but hardware refresh cycles slow when the payback period stretches beyond six years.

Multi-Vendor Security Assurance Overhead

Open interfaces widen the attack surface, and assurance costs land on the operator rather than the supplier. European Union toolbox measures and comparable North American frameworks require documented supply-chain risk assessments for each vendor in the chain [13][7]. Certification and penetration testing add an estimated 6–9% to first-year integration budgets on disaggregated sites, which is enough to defer marginal business cases.

Millimetre-Wave Densification Economics

Coverage radius above 24 GHz rarely exceeds 500 metres even with advanced beamforming, so urban deployment requires site densities three to five times mid-band equivalents. South Korea's regulator reclaimed 28 GHz licences from all three incumbent operators in 2023 after build-out shortfalls [11]. Backhaul, power, and municipal permitting frequently exceed the radio cost itself, which suppresses extreme-band volumes outside stadium and campus scenarios.

Auction Cost and Licence Fragmentation

Spectrum reserve prices in several Asia-Pacific markets have absorbed capital that would otherwise fund radio deployment. India's 2024 auction realised roughly USD 1.4 billion against a far larger notified quantum, signalling operator resistance to pricing levels [9]. Fragmented national allocations also force vendors to maintain more band-variant SKUs, raising unit costs and slowing certification for smaller markets.

5G New Radio Market Opportunities

Direct-to-Device Satellite Integration

Standardized NR profiles for satellite links turn a decades-old specialty into an addressable layer of the 5G New Radio Market. Operators can offer messaging and low-rate data to maritime, aviation, and rural consumers without further terrestrial investment and then upsell terrestrial capacity where demand concentrates. Throughput remains limited by handset antenna and power limits. However, the commercial pattern indicated in three markets in 2024-2025 points to tariff attachment rather than wholesale substitution [1].


Network Exposure APIs and Data Monetisation

Stand-alone cores provide quality-on-demand, device location and fraud-prevention functionality via standardized interfaces, creating revenue that does not scale with traffic. In 2024, operator consortia will roll out aggregator systems, enabling developers to sign a single commercial contract for dozens of networks. Early pricing suggests per-call economics like payment gateways, which would make exposure the first real software-margin line item on an operator income statement[3].


Emerging-Market Coverage Gaps

Approximately 2.6 billion people are still offline, with the greatest numbers in South Asia and Sub-Saharan Africa [22]. Sub-scale sites are now viable where they were not previously, due to low-cost single-band radios, shared active infrastructure, and universal service budget disbursements. Vendors designing for 40-watt power envelopes and solar-hybrid sites capture volume that premium portfolios can’t address, and these installations increasingly bypass the non-standalone step altogether.


Reduced-Capability Devices for Industrial IoT

Release 17 low capability profiles reduced bandwidth and antenna needs, which reduced the module costs to LTE Cat-4 level while maintaining slicing and placement [2]. That bridges the gap between private network aspirations and sensor-layer economics in factories and warehouses. Now, manufacturing purchasers can justify 5G modules on pallet trackers or wearables, greatly increasing the attach rate per licensed site.


Neutral-Host and In-Building Systems

Most enterprise traffic comes from within buildings, and in-building coverage is the weakest link in the 5G New Radio Market. Landlords can install once and wholesale to numerous operators, distributing the cost across tenants on shared neutral-host platforms. Regulatory backing is arriving – numerous European building codes now regard in-building connection as a utility service – and the approach is appropriate for airports, hospitals and logistics centers where single-operator economics are not viable [7].


5G New Radio Market Future Outlook

Autonomous Network Operations

AI-driven closed-loop automation moves from anomaly detection toward direct parameter control over the next decade. RAN Intelligent Controllers hosting third-party applications let operators tune energy, capacity, and coverage objectives dynamically rather than through quarterly optimisation campaigns. Early deployments report 12–18% energy reduction on lightly loaded sites without measurable quality degradation [20]. The commercial implication is a shift in vendor competition from radio specifications toward algorithm quality and data access rights.

Platform Economics and the Software Attach Rate

Revenue mix inside the 5G New Radio Market is migrating from one-time hardware sales toward recurring licences priced against capacity or feature tiers. Vendors that historically booked 80% of segment revenue at shipment now defer a growing share across multi-year contracts, which smooths earnings but raises customer switching friction. Operators gain the ability to scale expense with traffic, and challenger suppliers gain a foothold that does not require displacing installed radios.

Energy Intensity as a Procurement Criterion

Sustainability disclosure regimes increasingly require operators to report Scope 2 emissions at network granularity, and radio equipment dominates that footprint. Watts per gigabit has consequently become a scored criterion in tenders across Europe and Japan [20]. Vendors respond with sleep-state granularity, higher-efficiency amplifiers, and liquid-cooled site designs. Expect procurement scorecards to weight lifetime energy cost comparably to capital price by the early 2030s.

The Bridge Toward IMT-2030

Standards work on the next generation is already underway, with the ITU's IMT-2030 framework setting capability targets for integrated sensing, ubiquitous intelligence, and terrestrial-satellite convergence [1]. Practical consequence for buyers: radios purchased after 2028 should carry upgrade paths into upper mid-band spectrum and sensing waveforms. Investment written down over ten years must therefore assume at least one software-defined generational transition rather than a hardware replacement cycle.

Regional Market Share Analysis

Region Metric (2025 unless noted) Primary Investment Themes
North America 35.3% revenue share C-band densification, fixed wireless access, private campus networks
Europe USD 10.3 billion Shared RAN, energy-efficient radios, Digital Decade compliance
Asia-Pacific 24.6% CAGR (2026–2035) Greenfield standalone, manufacturing private networks, extreme-band pilots
South America USD 1.8 billion Coverage obligations, fixed wireless substitution, tower sharing
Middle East & Africa 7.3% revenue share Sovereign digitalisation, smart city programmes, rural connectivity funds
Total USD 46.4 billion —

Regional performance in the 5G New Radio Market tracks spectrum policy more closely than GDP. Markets that cleared mid-band early and attached coverage obligations to licences show the steepest deployment curves, while those that priced spectrum aggressively lag by two to three years.


North America

Country Metric Key Driver
US 82.4% share of region C-band and fixed wireless subscriber additions
Canada USD 1.7 billion (2025) 3800 MHz licence obligations in rural service areas
Mexico 22.1% CAGR (2026–2035) Wholesale network transition and coverage expansion


Commercial momentum in the North American 5G New Radio Market rests on two pillars: the 3.7 GHz service auction that raised USD 81.2 billion in gross proceeds, and fixed wireless economics that turned surplus mid-band capacity into a broadband product [6]. Operators added millions of fixed wireless lines while holding capex roughly flat, which materially improved return on the spectrum outlay. Canada's ISED attaches deployment conditions to Tier-4 licences, forcing rural build-out on a defined schedule. Mexico's restructuring of its wholesale network model has slowed near-term procurement but broadens the addressable site count once resolved.

Europe

Country Metric Key Driver
Germany 21.6% share of region Industrial local licences and manufacturing private networks
UK USD 1.9 billion (2025) Shared rural network and urban millimetre-wave awards
France 21.4% CAGR (2026–2035) Coverage obligations under 3.5 GHz licences
Italy 9.8% share of region Consolidation-driven network rationalisation
Spain USD 0.8 billion (2025) Recovery-fund-backed rural connectivity
Nordic Countries 20.9% CAGR (2026–2035) Energy-efficient site upgrades and early standalone cutovers
Russia 5.1% share of region Domestic equipment substitution programmes
Rest of Europe USD 1.4 billion (2025) Cross-border corridor coverage and roaming quality


Policy in Europe pulls in two directions at once. Digital Decade targets require gigabit service for all households and standalone coverage in every populated area by 2030, yet fragmented national licensing keeps per-operator scale below North American or Chinese levels [7]. Germany's local licensing regime is the standout, converting manufacturing demand into direct equipment purchases that bypass operators entirely. The United Kingdom's 2025 millimetre-wave awards targeted high-density zones rather than national coverage, a pragmatic design that other regulators are studying. Energy tariffs remain the practical brake on massive-MIMO expansion across most of the continent.

Asia-Pacific

Country Metric Key Driver
China 44.8% share of region State-directed densification and industrial internet programmes
India 27.3% CAGR (2026–2035) Greenfield standalone rollout and domestic manufacturing incentives
Japan USD 2.2 billion (2025) Local 5G licensing and open-interface subsidy schemes
South Korea 11.2% share of region Mid-band capacity layers after extreme-band licence reclamation
ASEAN 25.9% CAGR (2026–2035) Sovereign digital economy plans and tower sharing
Rest of Asia-Pacific USD 0.9 billion (2025) Universal service obligations and fixed wireless


Scale defines the Asia-Pacific position in the 5G New Radio Market. China's MIIT reported over 4.2 million 5G base stations in service by 2025, a figure no other region approaches [10]. India took a different path, building nationwide standalone from the outset and skipping the non-standalone intermediate step, which compressed roughly six years of European deployment into two. Japan's local licence framework and equipment subsidies have created a domestic supplier base with export ambition. Korea's reclamation of extreme-band licences redirected capital into mid-band capacity, a reallocation several regulators now cite as precedent [11].

South America

Country Metric Key Driver
Brazil 58.4% share of region 3.5 GHz coverage obligations and private network pilots
Argentina 21.8% CAGR (2026–2035) Delayed auction clearing and urban capacity upgrades
Rest of South America USD 0.4 billion (2025) Andean and Southern Cone coverage funds


Brazil's 2021 auction set the regional template by trading lower reserve prices for binding coverage commitments, including connectivity for every federal highway and school. Anatel's enforcement of those milestones has kept procurement steady even through currency volatility. Mining and agribusiness operators across Chile, Peru, and Brazil are among the earliest private network adopters outside Europe and Asia, driven by remote-site automation rather than factory floor use cases. Financing costs remain the principal constraint, with several operators favouring managed-service structures over capital purchases [18].

Middle East & Africa

Country Metric Key Driver
Saudi Arabia 24.6% share of region Vision 2030 giga-projects and smart city deployments
UAE 23.4% CAGR (2026–2035) Standalone migration and enterprise slicing services
South Africa USD 0.5 billion (2025) Post-auction spectrum deployment and fixed wireless
Egypt 9.1% share of region Mid-band licensing and new administrative capital build
Rest of Middle East & Africa USD 1.1 billion (2025) Universal service funds and shared infrastructure


Gulf operators run among the most advanced standalone networks globally, funded by sovereign programmes rather than subscriber revenue alone. Saudi Arabia's giga-projects specify connectivity as built-in infrastructure, which produces radio orders on construction timelines rather than telecom refresh cycles. Sub-Saharan deployment follows an entirely different logic: coverage economics dominate, sites run on hybrid solar power, and fixed wireless substitutes for absent fixed-line plant. The ITU counts mobile broadband coverage gaps that persist despite network availability, pointing to affordability rather than infrastructure as the binding constraint across much of the region [22].

5G New Radio Market By Region, 2025-2035

5G New Radio Market Segmentation


By Frequency Band

Segment Metric Primary Demand Driver
Sub-6 GHz 59.6% revenue share (2025) Nationwide coverage economics and indoor penetration
24-40 GHz MmWave USD 14.8 billion (2025) Venue capacity, fixed wireless, urban hotspots
Above 40 GHz Extreme-Band 24.3% CAGR (2026–2035) Multi-gigabit channels for extended reality and sensor backhaul


Sub-6 GHz anchors the 5G New Radio Market because propagation at 3.5 GHz reuses existing tower grids almost one-for-one, keeping site acquisition off the capex line. Operators refarm 1800 MHz and 2100 MHz holdings alongside newly auctioned C-band to balance reach against capacity. Above 40 GHz grows fastest from a small base, where 800 MHz to 2 GHz channels and subarray beamforming push coverage toward 500 metres in dense layouts.

By Deployment Mode

Segment Metric Primary Demand Driver
Non-Standalone 60.5% revenue share (2025) LTE core reuse and fastest time-to-market
Standalone 23.8% CAGR (2026–2035) End-to-end slicing, ultra-reliable low-latency services


Non-standalone still dominates the installed base of the 5G New Radio Market because it delivered headline downlink speeds without core replacement, preserving margin while usage scaled. Standalone now grows faster on the strength of cloud-native cores and service-based interfaces that make slicing contractually enforceable. Greenfield operators in India and fixed wireless specialists in the United States moved directly to standalone, and Release 17 device portfolios remove the last practical barrier.

By Component

Segment Metric Primary Demand Driver
gNB Hardware USD 20.3 billion (2025) Massive-MIMO arrays, remote radio heads, baseband units
Software 49.1% revenue share (2025) Virtualised baseband, orchestration, optimisation, security analytics
Services 24.9% CAGR (2026–2035) Systems integration, managed optimisation, lifecycle support


Software passing the halfway mark of the 5G New Radio Market marks the decisive structural change in the radio access network business. Virtual baseband functions, orchestration platforms, and AI-based optimisation tools now outweigh the physical layer by value, and pay-as-you-grow licensing aligns operator expense with traffic. Services compound fastest as standalone migration exceeds in-house skill depth, particularly among tier-two operators managing multi-vendor estates without dedicated integration teams.

By End-User Industry

Segment Metric Primary Demand Driver
Telecom Operators 53.8% revenue share (2025) National coverage builds and consumer broadband
Manufacturing 25.5% CAGR (2026–2035) Factory automation, deterministic latency, data sovereignty
Public Safety USD 4.1 billion (2025) Mission-critical push-to-talk and body-worn video
Transportation & Logistics 22.9% CAGR (2026–2035) Autonomous yard operations and smart-port cranes
Utilities USD 3.1 billion (2025) Wide-area sensor grids and outage localisation
Other End-User Industries 6.0% revenue share (2025) Healthcare, mining, agriculture, campus networks


Operator spending remains the backbone of the 5G New Radio Market and will stay so through 2035, since national coverage is a capital obligation rather than a discretionary purchase. Manufacturing grows fastest because licensed private spectrum solves a problem wired fieldbus and Wi-Fi cannot: guaranteed latency with on-premises data residency. Public safety and logistics follow with narrower but higher-margin requirements around time-sensitive networking and encryption wrappers.

Competitive Benchmarking

Concentration is moderate and slowly loosening. The top five suppliers hold an estimated 71–76% of global revenue, down from above 80% in 2021, producing an HHI in the 1,400–1,700 band that sits at the boundary between moderately concentrated and competitive. Disaggregation is the mechanism: software and integration layers of the 5G New Radio Market admit entrants who could never have fielded a full integrated radio portfolio. Regional policy adds a second fracture line, with equipment restrictions in several Western markets and domestic-supplier preferences in others creating regionally distinct competitive sets rather than one global contest.

Company Est. Revenue Share Range Key Offerings for 5G New Radio Market Strategic Positioning
Huawei Technologies ~25–29% MetaAAU massive-MIMO, integrated baseband, distributed core Volume leader in China, MEA, and parts of Asia-Pacific; restricted in several Western markets
Ericsson ~18–22% Radio System portfolio, Cloud RAN, Intelligent Automation Platform Preferred incumbent across North America and Europe; heavy automation investment
Nokia ~14–17% AirScale radios, anyRAN cloud baseband, MantaRay management Strongest open-interface credentials among tier-one integrated vendors
ZTE ~9–12% UniSite radios, NodeEngine edge, simplified site solutions Cost-competitive challenger with deep China and emerging-market penetration
Samsung Electronics ~5–7% vRAN 3.0, compact massive-MIMO units, Release 17 chipsets Vertically integrated from silicon to radio; anchored by large North American contracts
Qualcomm Technologies ~4–6% Modem-RF systems, X-series platforms, RAN silicon Device-side gatekeeper whose roadmap paces feature adoption network-wide
NEC Corporation ~2–4% Open RAN radio units, systems integration, transport Japan-anchored integrator expanding through European open network programmes
Fujitsu ~1.5–3% O-RAN radio units, virtualised distributed units Niche specialist in open-interface radios and co-development partnerships
Mavenir Systems ~1.5–3% Cloud-native RAN software, OpenBeam radios, converged packet core Software-first challenger targeting greenfield and private deployments
Rakuten Symphony ~1–2.5% Symworld platform, automation, end-to-end open network delivery Sells operating model as product, built from its own greenfield network
Cisco Systems ~1–2.5% Cloud-native core, transport, RAN automation and assurance Adjacent entrant leveraging enterprise relationships into private networks
Airspan Networks ~0.5–2% Small cells, in-building radios, fixed wireless units Density specialist serving neutral-host and enterprise coverage gaps


Recent News & Developments


  • Department of Telecommunications, India (June 2024): Concluded a spectrum auction realising roughly USD 1.4 billion, with results signalling operator resistance to reserve pricing and redirecting capital toward densification [9].
  • Nokia (October 2024): Opened its anyRAN cloud baseband to third-party hardware platforms, decoupling its software stack from proprietary silicon and broadening addressable deployments [14].
  • NTIA, United States (November 2023): Published the National Spectrum Strategy identifying 2,786 MHz across five bands for reallocation study, establishing the pipeline that underwrites post-2028 capacity planning [12].
  • Ministry of Science and ICT, South Korea (2023): Reclaimed 28 GHz licences from all three incumbent operators following build-out shortfalls, a precedent regulators now cite when setting extreme-band obligations [11].
  • Samsung Electronics and a Japanese operator (September 2023): Deployed commercial virtualised RAN at scale on general-purpose servers, validating cloud baseband performance under high-density urban traffic [17].

5G Neue Funktechnik Markt Market Report Scope

Parameter Detail
Market Scope Global 5G New Radio Market covering gNB hardware, software, and services across frequency band, deployment mode, component, end-user industry, and region
Study Period 2021–2035 (Historical: 2021–2024; Base Year: 2025; Forecast: 2026–2035)
CAGR 23.1% (2026–2035)
Market Size Checkpoints USD 46.4 billion (2025); USD 58.3 billion (2026); USD 171.6 billion (2031); USD 378.3 billion (2035)
Fastest Growing Segments Above 40 GHz Extreme-Band (24.3% CAGR); Standalone (23.8% CAGR); Services (24.9% CAGR); Manufacturing (25.5% CAGR); Asia-Pacific (24.6% CAGR)
Companies Profiled Huawei Technologies, Ericsson, Nokia, ZTE, Samsung Electronics, Qualcomm Technologies, NEC Corporation, Fujitsu, Mavenir Systems, Rakuten Symphony, Cisco Systems, Airspan Networks
Valuation Currency USD Billion

FAQs

Wie sollten Beschaffungsteams Anbieter im 5G New Radio Markt bewerten?
Dokumentierte Interoperabilitätstestnachweise, Watt-pro-Gigabit-Offenlegungen und mehrjährige Softwarelizenzbedingungen sollten über den Hauptpreis der Funkgeräte gewichtet werden. Fordern Sie Ergebnisse von Drittanbieter-Labors für 64T64R-Einheiten an, die unter lokalen Klima- und Lastbedingungen getestet wurden [13].
Welche Integrationsrisiken entstehen beim Mischen von Anbietern mit offenen Schnittstellen?
Die Fehlereingrenzung wird schwieriger, wenn Funkgeräte, verteilte Einheiten und Controller von verschiedenen Anbietern stammen. Planen Sie zwölf bis achtzehn Monate für Pre-Integrationslabore ein und beauftragen Sie einen einzigen Systemintegrator mit Service-Level-Verantwortung für den gesamten Stack [13].
Bevorzugt der 5G New Radio Markt das Leasing oder den Kauf von Spektrumrechten?
Leasing eignet sich für Unternehmen, die lokal private Netzwerke betreiben, wo drei- bis fünfjährige Laufzeiten eine Kapitalbindung durch Auktionen vermeiden. Betreiber, die landesweite Abdeckung aufbauen, kaufen weiterhin, da die amortisierten Lizenzkosten pro Abonnent über zwanzig Millionen Verbindungen stark fallen [9].
Wie verändern Geräte mit reduzierten Fähigkeiten die Geschäftsfälle von Unternehmen?
Release 17 reduzierte Module mit eingeschränkten Fähigkeiten senken die Materialkosten um etwa 40 % im Vergleich zu voll funktionsfähigen Chipsätzen, wodurch tragbare Geräte und Asset-Tracker auf eigenständigen Kernen rentabel werden. Die kommerzielle Zertifizierung begann im Jahr 2024 [2].
Welcher regulatorische Aspekt beeinflusst die Anbieter im 5G New Radio Markt in Europa am meisten?
Die Bedingungen für die Lizenzverlängerung verknüpfen zunehmend die Abdeckungsverpflichtungen mit Schwellenwerten der ländlichen Bevölkerung anstelle von Regionen. Bieter sollten diese Ausbauverpflichtungen in die Modellierung der Auktionsreserve einpreisen, bevor sie Kapital binden [7].
Welcher aufkommende Anwendungsfall ist am nächsten zur kommerziellen Skalierung?
Direkt-zu-Gerät Satellitenmessaging über standardisierte nicht-terrestrische Profile hat sich in drei Ländern von Tests zu kommerziellen Tarifen entwickelt. Sprache und Niedrigdaten folgen, sobald sich die Antennendesigns der Handgeräte um 2027 stabilisieren [1].
Wie vergleicht sich der 5G New Radio Markt mit Wi-Fi 7 für industrielle Standorte?
Lizenzierte Frequenzen bieten deterministische Latenz und Interferenzkontrolle, die unlizenzierte Wi-Fi 7 vertraglich nicht über dichte Fabrikböden garantieren kann. Wi-Fi bleibt günstiger für Büroüberlagerungen und nicht-kritische Telemetrie [5].
Autor
Autor Author Profile Nirmit Biswas LinkedIn Senior Research Analyst
With 5+ years of expertise in Market Intelligence and Strategic Research, Nirmit Biswas specializes in ICT, Semiconductors, and BFSI. Backed by an MBA in Financial Services and a Computer Science foundation, Nirmit blends technical depth with business acumen. He has successfully led 100+ projects for global enterprises and startups, including Amazon, Cisco, L&T and Huawei, delivering market estimations, competitive benchmarking, and GTM strategies. His focus lies in transforming complex data into clear, actionable insights that drive growth, innovation, and investment decisions. Recognized for bridging engineering innovation with executive strategy, Nirmit helps businesses navigate dynamic markets with confidence.
Ko-Autor Co-Author Profile Aarti Dhapte LinkedIn AVP - Research
A consulting professional focused on helping businesses navigate complex markets through structured research and strategic insights. I partner with clients to solve high-impact business problems across market entry strategy, competitive intelligence, and opportunity assessment. Over the course of my experience, I have led and contributed to 100+ market research and consulting engagements, delivering insights across multiple industries and geographies, and supporting strategic decisions linked to $500M+ market opportunities. My core expertise lies in building robust market sizing, forecasting, and commercial models (top-down and bottom-up), alongside deep-dive competitive and industry analysis. I have played a key role in shaping go-to-market strategies, investment cases, and growth roadmaps, enabling clients to make confident, data-backed decisions in dynamic markets.
Kostenloses Muster herunterladen

Bitte füllen Sie das folgende Formular aus, um ein kostenloses Muster dieses Berichts zu erhalten

Global Diameter Signaling Market
Fallstudie
Information and Communications Technology
Download PDF ×

We do not share your information with anyone. However, we may send you emails based on your report interest from time to time. You may contact us at any time to opt-out.