ID: MRFR/MED/0914-HCR | February 2021 | Region: Global | 85 pages
Market Scenario
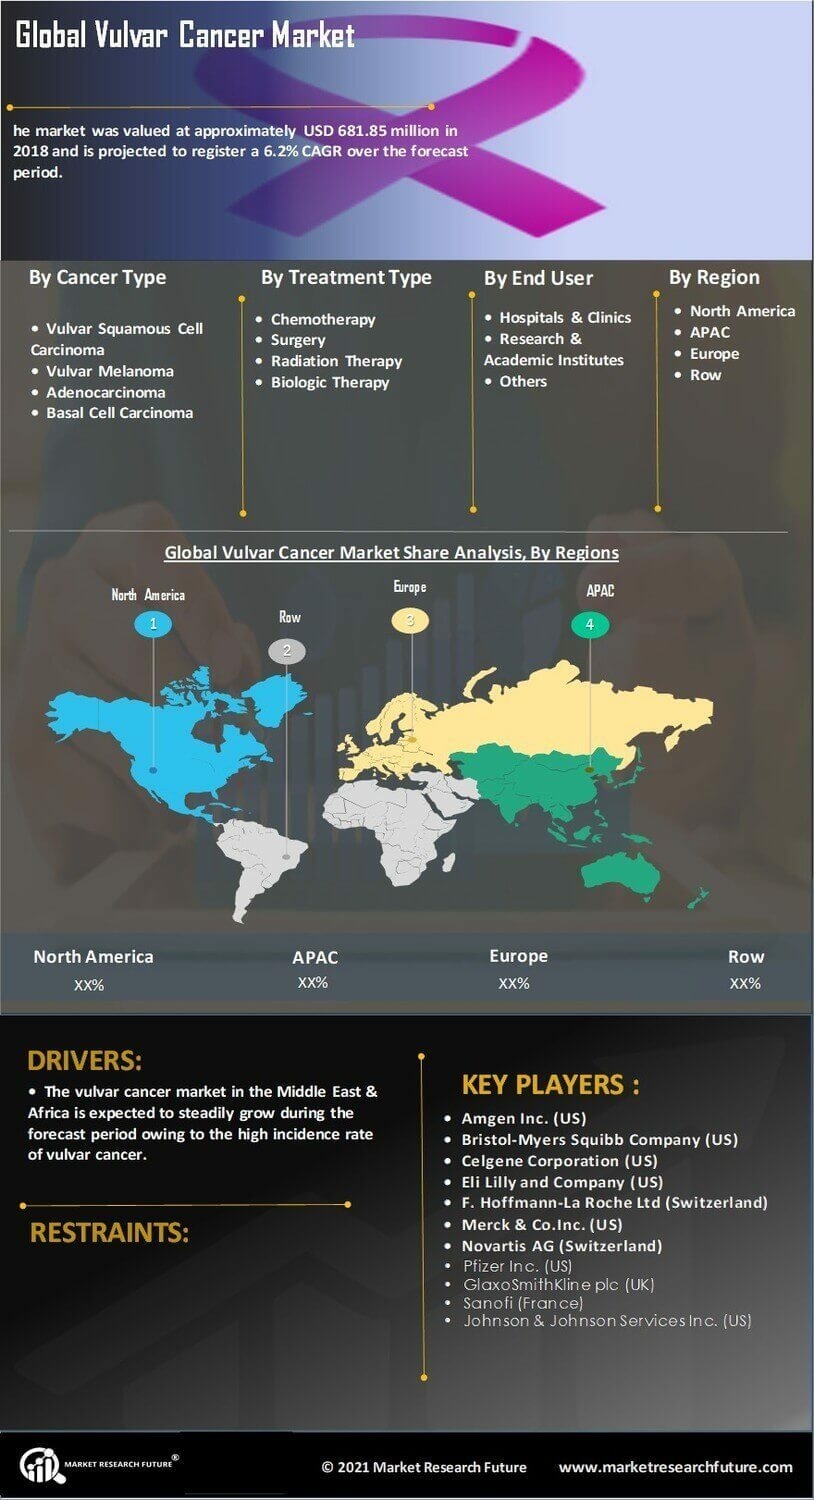
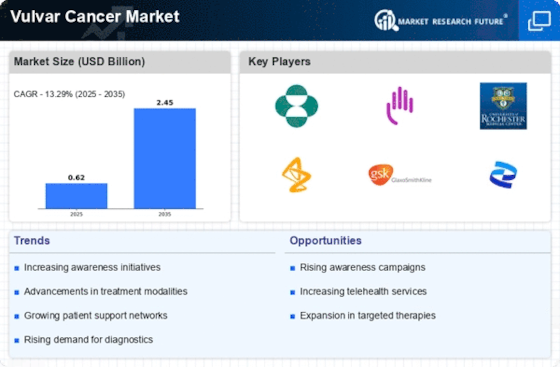
The global vulvar cancer market is expected to witness significant growth over the forecast period. The market was valued at approximately USD 681.85 million in 2018 and is projected to register a 6.2% CAGR over the forecast period.
Vulvar cancers occur on the outer surface of the female genitalia and form a lump or a sore on the vulva that might cause itching in the region.
Factors such as the rising prevalence of vulvar cancer are expected to drive market growth. According to an article published by the American Society of Clinical Oncology in March 2019, an estimated 6,070 women in the US were diagnosed with vulvar cancer. Moreover, increasing research and development expenditure in the field of oncology is also expected to boost market growth.
However, the side effects of the treatment are expected to hamper the market growth.
Segmentation
The global vulvar cancer market has been segmented into cancer type, treatment type, end user, and region.
Based on cancer type, the global vulvar cancer market has been segmented into vulvar squamous cell carcinoma, vulvar melanoma, adenocarcinoma, and basal cell carcinoma.
The global vulvar cancer market, by treatment type, has been segmented into chemotherapy, surgery, radiation therapy, and biologic therapy. The surgery segment is further classified into laser surgery, excision, skinning vulvectomy, and radical vulvectomy.
The global vulvar cancer market, by end user, has been segmented into hospitals & clinics, research & academic institutes, and others.
The market has been segmented, by region, into the Americas, Europe, Asia-Pacific, and the Middle East & Africa. The vulvar cancer market in the Americas has further been segmented into North America and Latin America, with the North American market divided into the US and Canada.
The European vulvar cancer market has been segmented into Western Europe and Eastern Europe. The market in Western Europe has further been classified into France, Germany, Spain, the UK, Italy, and the rest of Western Europe.
The vulvar cancer market in Asia-Pacific has been segmented into Japan, China, India, South Korea, Australia, and the rest of Asia-Pacific.
The Middle East & Africa vulvar cancer market is segmented into the Middle East and Africa.
Key Players
Amgen Inc. (US), Bristol-Myers Squibb Company (US), Celgene Corporation (US), Eli Lilly and Company (US), F. Hoffmann-La Roche Ltd (Switzerland), Merck & Co., Inc. (US), Novartis AG (Switzerland), Pfizer Inc. (US), GlaxoSmithKline plc (UK), Sanofi (France), and Johnson & Johnson Services, Inc. (US) are some of the key players operating in the global vulvar cancer market.
Regional Market Summary
Global Vulvar Cancer Market Share (%), by Region, 2018
Source: Centers for Disease Control and Prevention (CDC), Eurostat, White Papers, Company Presentations, and Annual Reports
Geographically, the market has been segmented into the Americas, Europe, Asia-Pacific, and the Middle East & Africa. The Americas is expected to dominate the global vulvar cancer market owing to the rising prevalence of vulvar cancer.
Europe is expected to hold the second-largest share of the vulvar cancer market owing to the presence of major market players such as F.Hoffmann-La Roche Ltd, Novartis AG, GlaxoSmithKline plc, and Sanofi.
Asia-Pacific is expected to be the fastest-growing regional market owing to the increasing awareness regarding cancer and increasing R&D in the field of oncology.
The vulvar cancer market in the Middle East & Africa is expected to steadily grow during the forecast period owing to the high incidence rate of vulvar cancer.
Global Vulvar Cancer Market, by Cancer Type
Table of Contents
1. REPORT PROLOGUE
2. MARKET INTRODUCTION
2.1. Definition
2.2. Scope of the Study
2.2.1. Research Objective
2.2.2. Assumptions
2.2.3. Limitations
3. RESEARCH METHODOLOGY
3.1. Overview
3.2. Primary Research
3.3. Secondary Research
3.4. Market Size Estimation
4. MARKET DYNAMICS
4.1. Overview
4.2. Drivers
4.3. Restraints
4.4. Opportunities
5. MARKET FACTOR ANALYSIS
5.1. Porter’s Five Forces Analysis
5.1.1. Bargaining Power of Suppliers
5.1.2. Bargaining Power of Buyers
5.1.3. Threat of New Entrants
5.1.4. Threat of Substitutes
5.1.5. Intensity of Rivalry
5.2. Value Chain Analysis
6. GLOBAL VULVAR CANCER MARKET, BY CANCER TYPE
6.1. Overview
6.2. Vulvar Squamous Cell Carcinoma
Market Estimates & Forecast, by Region, 2019–2025
Market Estimates & Forecast, by Country, 2019–2025
6.3. Vulvar Melanoma
Market Estimates & Forecast, by Region, 2019–2025
Market Estimates & Forecast, by Country, 2019–2025
6.4. Adenocarcinoma
Market Estimates & Forecast, by Region, 2019–2025
Market Estimates & Forecast, by Country, 2019–2025
6.5. Basal Cell Carcinoma
Market Estimates & Forecast, by Region, 2019–2025
Market Estimates & Forecast, by Country, 2019–2025
7. GLOBAL VULVAR CANCER MARKET, BY TREATMENT TYPE
7.1. Overview
7.2. Chemotherapy
Market Estimates & Forecast, by Region, 2019–2025
Market Estimates & Forecast, by Country, 2019–2025
7.3. Surgery
Market Estimates & Forecast, by Region, 2019–2025
Market Estimates & Forecast, by Country, 2019–2025
7.3.1. Laser Surgery
Market Estimates & Forecast, by Region, 2019–2025
Market Estimates & Forecast, by Country, 2019–2025
7.3.2. Excision
Market Estimates & Forecast, by Region, 2019–2025
Market Estimates & Forecast, by Country, 2019–2025
7.3.3. Skinning Vulvectomy
Market Estimates & Forecast, by Region, 2019–2025
Market Estimates & Forecast, by Country, 2019–2025
7.3.4. Radical Vulvectomy
Market Estimates & Forecast, by Region, 2019–2025
Market Estimates & Forecast, by Country, 2019–2025
7.4. Radiation Therapy
Market Estimates & Forecast, by Region, 2019–2025
Market Estimates & Forecast, by Country, 2019–2025
7.5. Biologic Therapy
Market Estimates & Forecast, by Region, 2019–2025
Market Estimates & Forecast, by Country, 2019–2025
8. GLOBAL VULVAR CANCER MARKET, BY END USER
8.1. Overview
8.2. Hospitals & Clinics
Market Estimates & Forecast, by Region, 2019–2025
Market Estimates & Forecast, by Country, 2019–2025
8.3. Research and Academic Institutes
Market Estimates & Forecast, by Region, 2019–2025
Market Estimates & Forecast, by Country, 2019–2025
8.4. Others
Market Estimates & Forecast, by Region, 2019–2025
Market Estimates & Forecast, by Country, 2019–2025
9. GLOBAL VULVAR CANCER MARKET, BY REGION
9.1. Overview
9.2. Americas
9.2.1. North America
9.2.1.1. US
9.2.1.2. Canada
9.2.2. Latin America
9.3. Europe
9.3.1. Western Europe
9.3.1.1. Germany
9.3.1.2. France
9.3.1.3. Italy
9.3.1.4. Spain
9.3.1.5. UK
9.3.1.6. Rest of Western Europe
9.3.2. Eastern Europe
9.4. Asia-Pacific
9.4.1. Japan
9.4.2. China
9.4.3. India
9.4.4. Australia
9.4.5. South Korea
9.4.6. Rest of Asia-Pacific
9.5. Middle East & Africa
9.5.1. Middle East
9.5.2. Africa
10. COMPANY LANDSCAPE
10.1. Overview
10.2. Competitive Analysis
10.3. Market Share Analysis
10.4. Major Growth Strategy in the Global Vulvar Cancer Market
10.5. Competitive Benchmarking
10.6. Leading Players in Terms of Number of Developments in the Global Vulvar Cancer Market
10.7. Key Developments and Growth Strategies
10.7.1. Product Launch/Service Deployment
10.7.2. Mergers and Acquisitions
10.7.3. Joint Ventures
10.8. Major Players Financial Matrix & Market Ratio
10.8.1. Sales & Operating Income 2018
10.8.2. Major Players R&D Expenditure 2018
10.9. Major Players Capital Market Ratio
11. COMPANY PROFILES
11.1. Amgen Inc.
11.1.1. Company Overview
11.1.2. Product Overview
11.1.3. Financial Overview
11.1.4. Key Developments
11.1.5. SWOT Analysis
11.1.6. Key Strategies
11.2. Bristol-Myers Squibb Company
11.2.1. Company Overview
11.2.2. Product Overview
11.2.3. Financial Overview
11.2.4. Key Developments
11.2.5. SWOT Analysis
11.2.6. Key Strategies
11.3. Celgene Corporation
11.3.1. Company Overview
11.3.2. Product Overview
11.3.3. Financial Overview
11.3.4. Key Developments
11.3.5. SWOT Analysis
11.3.6. Key Strategies
11.4. Eli Lilly and Company
11.4.1. Company Overview
11.4.2. Product Overview
11.4.3. Financial Overview
11.4.4. Key Developments
11.4.5. SWOT Analysis
11.4.6. Key Strategies
11.5. F. Hoffmann-La Roche Ltd
11.5.1. Company Overview
11.5.2. Product Overview
11.5.3. Financial Overview
11.5.4. Key Developments
11.5.5. SWOT Analysis
11.5.6. Key Strategies
11.6. Merck & Co., Inc.
11.6.1. Company Overview
11.6.2. Product Overview
11.6.3. Financial Overview
11.6.4. Key Developments
11.6.5. SWOT Analysis
11.6.6. Key Strategies
11.7. Novartis AG
11.7.1. Company Overview
11.7.2. Product Overview
11.7.3. Financial Overview
11.7.4. Key Developments
11.7.5. SWOT Analysis
11.7.6. Key Strategies
11.8. Pfizer Inc.
11.8.1. Company Overview
11.8.2. Product Overview
11.8.3. Financial Overview
11.8.4. Key Developments
11.8.5. SWOT Analysis
11.8.6. Key Strategies
11.9. GlaxoSmithKline plc
11.9.1. Company Overview
11.9.2. Product Overview
11.9.3. Financial Overview
11.9.4. Key Developments
11.9.5. SWOT Analysis
11.9.6. Key Strategies
11.10. Sanofi
11.10.1. Company Overview
11.10.2. Product Overview
11.10.3. Financial Overview
11.10.4. Key Developments
11.10.5. SWOT Analysis
11.10.6. Key Strategies
11.11. Johnson & Johnson Services, Inc.
11.11.1. Company Overview
11.11.2. Product Overview
11.11.3. Financial Overview
11.11.4. Key Developments
11.11.5. SWOT Analysis
11.11.6. Key Strategies
11.12. Others
12. APPENDIX
12.1. References
12.2. Related Reports
LIST OF TABLES
TABLE 1 GLOBAL VULVAR CANCER MARKET SYNOPSIS, 2019–2025
TABLE 2 GLOBAL VULVAR CANCER MARKET ESTIMATES & FORECAST, 2019–2025 (USD MILLION)
TABLE 3 GLOBAL VULVAR CANCER MARKET, BY CANCER TYPE, 2019–2025 (USD MILLION)
TABLE 4 GLOBAL VULVAR CANCER MARKET, BY TREATMENT TYPE, 2019–2025 (USD MILLION)
TABLE 5 GLOBAL VULVAR CANCER MARKET, BY END USER, 2019–2025 (USD MILLION)
TABLE 6 GLOBAL VULVAR CANCER MARKET, BY REGION, 2019–2025 (USD MILLION)
TABLE 7 NORTH AMERICA: VULVAR CANCER MARKET, BY CANCER TYPE, 2019–2025 (USD MILLION)
TABLE 8 NORTH AMERICA: VULVAR CANCER MARKET, BY TREATMENT TYPE, 2019–2025 (USD MILLION)
TABLE 9 NORTH AMERICA: VULVAR CANCER MARKET, BY END USER, 2019–2025 (USD MILLION)
TABLE 10 US: VULVAR CANCER MARKET, BY CANCER TYPE, 2019–2025 (USD MILLION)
TABLE 11 US: VULVAR CANCER MARKET, BY TREATMENT TYPE, 2019–2025 (USD MILLION)
TABLE 12 US: VULVAR CANCER MARKET, BY END USER, 2019–2025 (USD MILLION)
TABLE 13 CANADA: VULVAR CANCER MARKET, BY CANCER TYPE, 2019–2025 (USD MILLION)
TABLE 14 CANADA: VULVAR CANCER MARKET, BY TREATMENT TYPE, 2019–2025 (USD MILLION)
TABLE 15 CANADA: VULVAR CANCER MARKET, BY END USER, 2019–2025 (USD MILLION)
TABLE 16 LATIN AMERICA: VULVAR CANCER MARKET, BY CANCER TYPE, 2019–2025 (USD MILLION)
TABLE 17 LATIN AMERICA: VULVAR CANCER MARKET, BY TREATMENT TYPE, 2019–2025 (USD MILLION)
TABLE 18 LATIN AMERICA: VULVAR CANCER MARKET, BY END USER, 2019–2025 (USD MILLION)
TABLE 19 EUROPE: VULVAR CANCER MARKET, BY CANCER TYPE, 2019–2025 (USD MILLION)
TABLE 20 EUROPE: VULVAR CANCER MARKET, BY TREATMENT TYPE, 2019–2025 (USD MILLION)
TABLE 21 EUROPE: VULVAR CANCER MARKET, BY END USER, 2019–2025 (USD MILLION)
TABLE 22 WESTERN EUROPE: VULVAR CANCER MARKET, BY CANCER TYPE, 2019–2025 (USD MILLION)
TABLE 23 WESTERN EUROPE: VULVAR CANCER MARKET, BY TREATMENT TYPE, 2019–2025 (USD MILLION)
TABLE 24 WESTERN EUROPE: VULVAR CANCER MARKET, BY END USER, 2019–2025 (USD MILLION)
TABLE 25 EASTERN EUROPE: VULVAR CANCER MARKET, BY CANCER TYPE, 2019–2025 (USD MILLION)
TABLE 26 EASTERN EUROPE: VULVAR CANCER MARKET, BY TREATMENT TYPE, 2019–2025 (USD MILLION)
TABLE 27 EASTERN EUROPE: VULVAR CANCER MARKET, BY END USER, 2019–2025 (USD MILLION)
TABLE 28 ASIA-PACIFIC: VULVAR CANCER MARKET, BY CANCER TYPE, 2019–2025 (USD MILLION)
TABLE 29 ASIA-PACIFIC: VULVAR CANCER MARKET, BY TREATMENT TYPE, 2019–2025 (USD MILLION)
TABLE 30 ASIA-PACIFIC: VULVAR CANCER MARKET, BY END USER, 2019–2025 (USD MILLION)
TABLE 31 MIDDLE EAST & AFRICA: VULVAR CANCER MARKET, BY CANCER TYPE, 2019–2025 (USD MILLION)
TABLE 32 MIDDLE EAST & AFRICA: VULVAR CANCER MARKET, BY TREATMENT TYPE, 2019–2025 (USD MILLION)
TABLE 33 MIDDLE EAST & AFRICA: VULVAR CANCER MARKET, BY END USER, 2019–2025 (USD MILLION)
LIST OF FIGURES
FIGURE 1 RESEARCH PROCESS
FIGURE 2 MARKET STRUCTURE OF THE GLOBAL VULVAR CANCER MARKET
FIGURE 3 MARKET DYNAMICS OF THE GLOBAL VULVAR CANCER MARKET
FIGURE 4 GLOBAL VULVAR CANCER MARKET SHARE, BY CANCER TYPE, 2018 (%)
FIGURE 5 GLOBAL VULVAR CANCER MARKET SHARE, BY TREATMENT TYPE, 2018 (%)
FIGURE 6 GLOBAL VULVAR CANCER MARKET SHARE, BY END USER, 2018 (%)
FIGURE 7 GLOBAL VULVAR CANCER MARKET SHARE, BY REGION, 2018 (%)
FIGURE 7 AMERICAS: VULVAR CANCER MARKET SHARE BY REGION, 2018 (%)
FIGURE 8 NORTH AMERICA: VULVAR CANCER MARKET SHARE, BY COUNTRY, 2018 (%)
FIGURE 9 EUROPE: VULVAR CANCER MARKET SHARE, BY REGION, 2018 (%)
FIGURE 10 WESTERN EUROPE: VULVAR CANCER MARKET SHARE, BY COUNTRY, 2018 (%)
FIGURE 11 ASIA-PACIFIC: VULVAR CANCER MARKET SHARE, BY COUNTRY, 2018 (%)
FIGURE 12 MIDDLE EAST & AFRICA: VULVAR CANCER MARKET SHARE, BY COUNTRY, 2018 (%)
FIGURE 13 GLOBAL VULVAR CANCER MARKET: COMPANY SHARE ANALYSIS, 2018 (%)
FIGURE 14 AMGEN INC..: KEY FINANCIALS
FIGURE 15 AMGEN INC.: SEGMENTAL REVENUE
FIGURE 16 AMGEN INC.: REGIONAL REVENUE
FIGURE 17 BRISTOL-MYERS SQUIBB COMPANY: KEY FINANCIALS
FIGURE 18 BRISTOL-MYERS SQUIBB COMPANY: SEGMENTAL REVENUE
FIGURE 19 BRISTOL-MYERS SQUIBB COMPANY: REGIONAL REVENUE
FIGURE 20 CELGENE CORPORATION: KEY FINANCIALS
FIGURE 21 CELGENE CORPORATION: SEGMENTAL REVENUE
FIGURE 22 CELGENE CORPORATION: REGIONAL REVENUE
FIGURE 23 ELI LILLY AND COMPANY: KEY FINANCIALS
FIGURE 24 ELI LILLY AND COMPANY: SEGMENTAL REVENUE
FIGURE 25 ELI LILLY AND COMPANY: REGIONAL REVENUE
FIGURE 26 F. HOFFMANN-LA ROCHE LTD: KEY FINANCIALS
FIGURE 27 F. HOFFMANN-LA ROCHE LTD: SEGMENTAL REVENUE
FIGURE 28 F. HOFFMANN-LA ROCHE LTD: REGIONAL REVENUE
FIGURE 29 MERCK & CO., INC.: KEY FINANCIALS
FIGURE 30 MERCK & CO., INC.: SEGMENTAL REVENUE
FIGURE 31 MERCK & CO., INC.: REGIONAL REVENUE
FIGURE 32 NOVARTIS AG: KEY FINANCIALS
FIGURE 33 NOVARTIS AG: SEGMENTAL REVENUE
FIGURE 34 NOVARTIS AG: REGIONAL REVENUE
FIGURE 35 PFIZER INC.: KEY FINANCIALS
FIGURE 36 PFIZER INC.: SEGMENTAL REVENUE
FIGURE 37 PFIZER INC.: REGIONAL REVENUE
FIGURE 38 GLAXOSMITHKLINE PLC: KEY FINANCIALS
FIGURE 39 GLAXOSMITHKLINE PLC: SEGMENTAL REVENUE
FIGURE 40 GLAXOSMITHKLINE PLC: REGIONAL REVENUE
FIGURE 41 SANOFI: KEY FINANCIALS
FIGURE 42 SANOFI: SEGMENTAL REVENUE
FIGURE 43 SANOFI: REGIONAL REVENUE
FIGURE 44 JOHNSON & JOHNSON SERVICES, INC.: KEY FINANCIALS
FIGURE 45 JOHNSON & JOHNSON SERVICES, INC.: SEGMENTAL REVENUE
FIGURE 46 JOHNSON & JOHNSON SERVICES, INC.: REGIONAL REVENUE