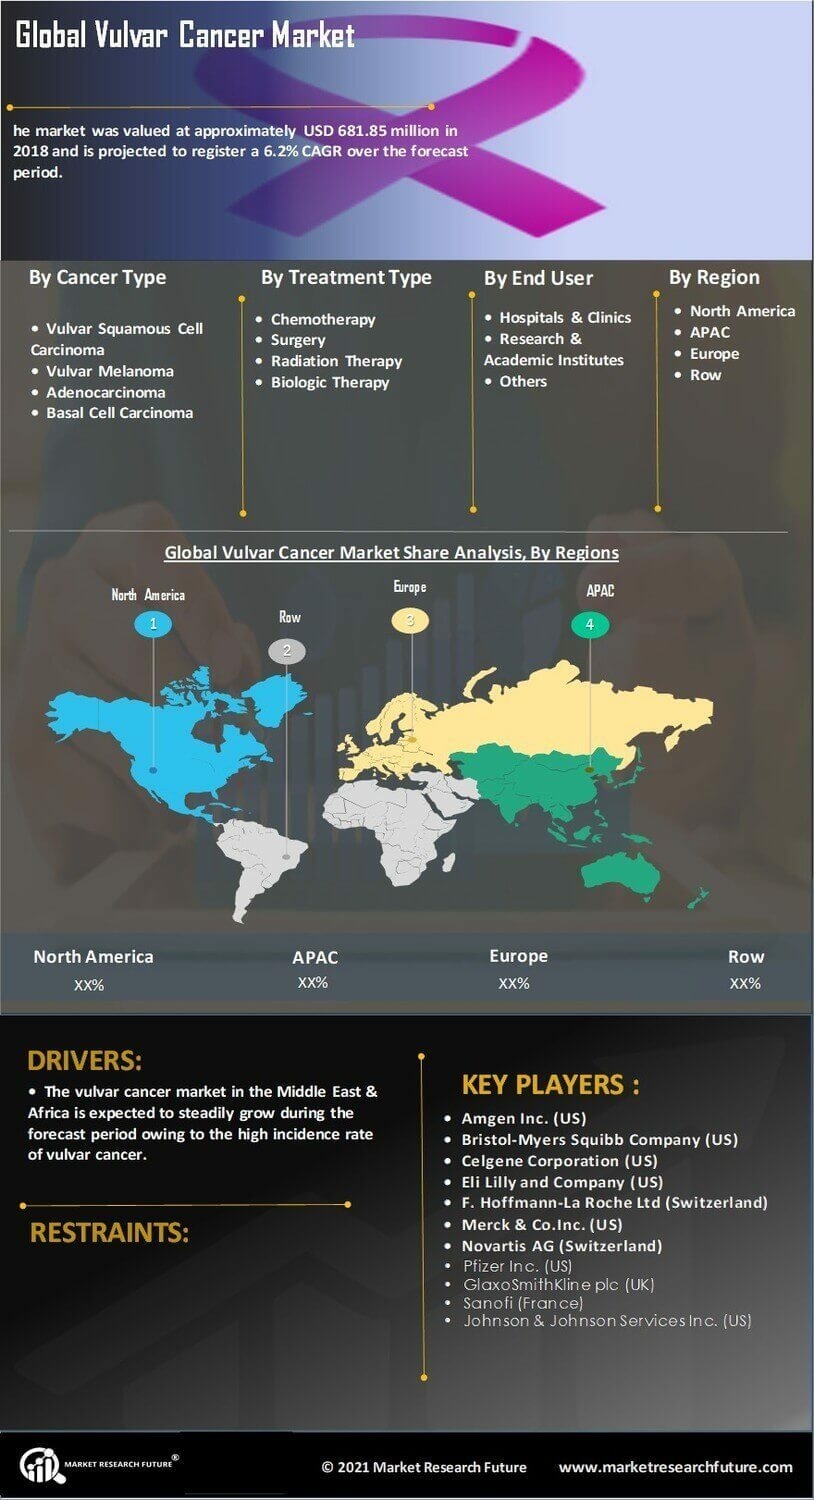
Certified Global Research Member
Isomar fd.webp Wcrc 57.webp
Key Questions Answered
  • Global Market Outlook
  • In-depth analysis of global and regional trends
  • Analyze and identify the major players in the market, their market share, key developments, etc.
  • To understand the capability of the major players based on products offered, financials, and strategies.
  • Identify disrupting products, companies, and trends.
  • To identify opportunities in the market.
  • Analyze the key challenges in the market.
  • Analyze the regional penetration of players, products, and services in the market.
  • Comparison of major players’ financial performance.
  • Evaluate strategies adopted by major players.
  • Recommendations
Why Choose Market Research Future?
  • Vigorous research methodologies for specific market.
  • Knowledge partners across the globe
  • Large network of partner consultants.
  • Ever-increasing/ Escalating data base with quarterly monitoring of various markets
  • Trusted by fortune 500 companies/startups/ universities/organizations
  • Large database of 5000+ markets reports.
  • Effective and prompt pre- and post-sales support.

Vulvar Cancer Market Research Report Information by Cancer Type (Vulvar Squamous Cell Carcinoma, Vulvar Melanoma, Adenocarcinoma, and Basal Cell Carcinoma), Treatment Type (Chemotherapy, Surgery, Radiation Therapy, and Biologic Therapy), End User (Hospitals & Clinics, Research & Academic Institutes, and Others), and Region (the Americas, Europe, Asia-Pacific, and the Middle East & Africa)—Forecast till 2030


ID: MRFR/MED/0914-HCR | 85 Pages | Author: Rahul Gotadki| April 2024
Leading companies partner with us for data-driven Insights
client_1 client_2 client_3 client_4 client_5 client_6 client_7 client_8 client_9 client_10
Please fill in Business Email for Quick Response

Table of Contents

REPORT PROLOGUE

MARKET INTRODUCTION

2.1. Definition

2.2. Scope of the Study

2.2.1. Research Objective

2.2.2. Assumptions

2.2.3. Limitations

RESEARCH METHODOLOGY

3.1. Overview

3.2. Primary Research

3.3. Secondary Research

3.4. Market Size Estimation

MARKET DYNAMICS

4.1. Overview

4.2. Drivers

4.3. Restraints

4.4. Opportunities

MARKET FACTOR ANALYSIS

5.1. Porter’s Five Forces Analysis

5.1.1. Bargaining Power of Suppliers

5.1.2. Bargaining Power of Buyers

5.1.3. Threat of New Entrants

5.1.4. Threat of Substitutes

5.1.5. Intensity of Rivalry

5.2. Value Chain Analysis

GLOBAL VULVAR CANCER MARKET, BY CANCER TYPE

6.1. Overview

6.2. Vulvar Squamous Cell Carcinoma

Market Estimates & Forecast, by Region, 2020-2027

Market Estimates & Forecast, by Country, 2020-2027

6.3. Vulvar Melanoma

Market Estimates & Forecast, by Region, 2020-2027

Market Estimates & Forecast, by Country, 2020-2027

6.4. Adenocarcinoma

Market Estimates & Forecast, by Region, 2020-2027

Market Estimates & Forecast, by Country, 2020-2027

6.5. Basal Cell Carcinoma

Market Estimates & Forecast, by Region, 2020-2027

Market Estimates & Forecast, by Country, 2020-2027

GLOBAL VULVAR CANCER MARKET, BY TREATMENT TYPE

7.1. Overview

7.2. Chemotherapy

Market Estimates & Forecast, by Region, 2020-2027

Market Estimates & Forecast, by Country, 2020-2027

7.3. Surgery

Market Estimates & Forecast, by Region, 2020-2027

Market Estimates & Forecast, by Country, 2020-2027

7.3.1. Laser Surgery

Market Estimates & Forecast, by Region, 2020-2027

Market Estimates & Forecast, by Country, 2020-2027

7.3.2. Excision

Market Estimates & Forecast, by Region, 2020-2027

Market Estimates & Forecast, by Country, 2020-2027

7.3.3. Skinning Vulvectomy

Market Estimates & Forecast, by Region, 2020-2027

Market Estimates & Forecast, by Country, 2020-2027

7.3.4. Radical Vulvectomy

Market Estimates & Forecast, by Region, 2020-2027

Market Estimates & Forecast, by Country, 2020-2027

7.4. Radiation Therapy

Market Estimates & Forecast, by Region, 2020-2027

Market Estimates & Forecast, by Country, 2020-2027

7.5. Biologic Therapy

Market Estimates & Forecast, by Region, 2020-2027

Market Estimates & Forecast, by Country, 2020-2027

GLOBAL VULVAR CANCER MARKET, BY END USER

8.1. Overview

8.2. Hospitals & Clinics

Market Estimates & Forecast, by Region, 2020-2027

Market Estimates & Forecast, by Country, 2020-2027

8.3. Research and Academic Institutes

Market Estimates & Forecast, by Region, 2020-2027

Market Estimates & Forecast, by Country, 2020-2027

8.4. Others

Market Estimates & Forecast, by Region, 2020-2027

Market Estimates & Forecast, by Country, 2020-2027

GLOBAL VULVAR CANCER MARKET, BY REGION

9.1. Overview

9.2. Americas

9.2.1. North America

9.2.1.1. US

9.2.1.2. Canada

9.2.2. Latin America

9.3. Europe

9.3.1. Western Europe

9.3.1.1. Germany

9.3.1.2. France

9.3.1.3. Italy

9.3.1.4. Spain

9.3.1.5. UK

9.3.1.6. Rest of Western Europe

9.3.2. Eastern Europe

9.4. Asia-Pacific

9.4.1. Japan

9.4.2. China

9.4.3. India

9.4.4. Australia

9.4.5. South Korea

9.4.6. Rest of Asia-Pacific

9.5. Middle East & Africa

9.5.1. Middle East

9.5.2. Africa

COMPANY LANDSCAPE

10.1. Overview

10.2. Competitive Analysis

10.3. Market Share Analysis

10.4. Major Growth Strategy in the Global Vulvar Cancer Market

10.5. Competitive Benchmarking

10.6. Leading Players in Terms of Number of Developments in the Global Vulvar Cancer Market

10.7. Key Developments and Growth Strategies

10.7.1. Product Launch/Service Deployment

10.7.2. Mergers and Acquisitions

10.7.3. Joint Ventures

10.8. Major Players Financial Matrix & Market Ratio

10.8.1. Sales & Operating Income 2020

10.8.2. Major Players R&D Expenditure 2020

10.9. Major Players Capital Market Ratio

COMPANY PROFILES

11.1. Amgen Inc.

11.1.1. Company Overview

11.1.2. Product Overview

11.1.3. Financial Overview

11.1.4. Key Developments

11.1.5. SWOT Analysis

11.1.6. Key Strategies

11.2. Bristol-Myers Squibb Company

11.2.1. Company Overview

11.2.2. Product Overview

11.2.3. Financial Overview

11.2.4. Key Developments

11.2.5. SWOT Analysis

11.2.6. Key Strategies

11.3. Celgene Corporation

11.3.1. Company Overview

11.3.2. Product Overview

11.3.3. Financial Overview

11.3.4. Key Developments

11.3.5. SWOT Analysis

11.3.6. Key Strategies

11.4. Eli Lilly and Company

11.4.1. Company Overview

11.4.2. Product Overview

11.4.3. Financial Overview

11.4.4. Key Developments

11.4.5. SWOT Analysis

11.4.6. Key Strategies

11.5. F. Hoffmann-La Roche Ltd

11.5.1. Company Overview

11.5.2. Product Overview

11.5.3. Financial Overview

11.5.4. Key Developments

11.5.5. SWOT Analysis

11.5.6. Key Strategies

11.6. Merck & Co., Inc.

11.6.1. Company Overview

11.6.2. Product Overview

11.6.3. Financial Overview

11.6.4. Key Developments

11.6.5. SWOT Analysis

11.6.6. Key Strategies

11.7. Novartis AG

11.7.1. Company Overview

11.7.2. Product Overview

11.7.3. Financial Overview

11.7.4. Key Developments

11.7.5. SWOT Analysis

11.7.6. Key Strategies

11.8. Pfizer Inc.

11.8.1. Company Overview

11.8.2. Product Overview

11.8.3. Financial Overview

11.8.4. Key Developments

11.8.5. SWOT Analysis

11.8.6. Key Strategies

11.9. GlaxoSmithKline plc

11.9.1. Company Overview

11.9.2. Product Overview

11.9.3. Financial Overview

11.9.4. Key Developments

11.9.5. SWOT Analysis

11.9.6. Key Strategies

11.10. Sanofi

11.10.1. Company Overview

11.10.2. Product Overview

11.10.3. Financial Overview

11.10.4. Key Developments

11.10.5. SWOT Analysis

11.10.6. Key Strategies

11.11. Johnson & Johnson Services, Inc.

11.11.1. Company Overview

11.11.2. Product Overview

11.11.3. Financial Overview

11.11.4. Key Developments

11.11.5. SWOT Analysis

11.11.6. Key Strategies

11.12. Others

APPENDIX

12.1. References

12.2. Related Reports

LIST OF TABLES

TABLE 1 GLOBAL VULVAR CANCER MARKET SYNOPSIS, 2020-2027

TABLE 2 GLOBAL VULVAR CANCER MARKET ESTIMATES & FORECAST, 2020-2027 (USD MILLION)

TABLE 3 GLOBAL VULVAR CANCER MARKET, BY CANCER TYPE, 2020-2027 (USD MILLION)

TABLE 4 GLOBAL VULVAR CANCER MARKET, BY TREATMENT TYPE, 2020-2027 (USD MILLION)

TABLE 5 GLOBAL VULVAR CANCER MARKET, BY END USER, 2020-2027 (USD MILLION)

TABLE 6 GLOBAL VULVAR CANCER MARKET, BY REGION, 2020-2027 (USD MILLION)

TABLE 7 NORTH AMERICA: VULVAR CANCER MARKET, BY CANCER TYPE, 2020-2027 (USD MILLION)

TABLE 8 NORTH AMERICA: VULVAR CANCER MARKET, BY TREATMENT TYPE, 2020-2027 (USD MILLION)

TABLE 9 NORTH AMERICA: VULVAR CANCER MARKET, BY END USER, 2020-2027 (USD MILLION)

TABLE 10 US: VULVAR CANCER MARKET, BY CANCER TYPE, 2020-2027 (USD MILLION)

TABLE 11 US: VULVAR CANCER MARKET, BY TREATMENT TYPE, 2020-2027 (USD MILLION)

TABLE 12 US: VULVAR CANCER MARKET, BY END USER, 2020-2027 (USD MILLION)

TABLE 13 CANADA: VULVAR CANCER MARKET, BY CANCER TYPE, 2020-2027 (USD MILLION)

TABLE 14 CANADA: VULVAR CANCER MARKET, BY TREATMENT TYPE, 2020-2027 (USD MILLION)

TABLE 15 CANADA: VULVAR CANCER MARKET, BY END USER, 2020-2027 (USD MILLION)

TABLE 16 LATIN AMERICA: VULVAR CANCER MARKET, BY CANCER TYPE, 2020-2027 (USD MILLION)

TABLE 17 LATIN AMERICA: VULVAR CANCER MARKET, BY TREATMENT TYPE, 2020-2027 (USD MILLION)

TABLE 18 LATIN AMERICA: VULVAR CANCER MARKET, BY END USER, 2020-2027 (USD MILLION)

TABLE 19 EUROPE: VULVAR CANCER MARKET, BY CANCER TYPE, 2020-2027 (USD MILLION)

TABLE 20 EUROPE: VULVAR CANCER MARKET, BY TREATMENT TYPE, 2020-2027 (USD MILLION)

TABLE 21 EUROPE: VULVAR CANCER MARKET, BY END USER, 2020-2027 (USD MILLION)

TABLE 22 WESTERN EUROPE: VULVAR CANCER MARKET, BY CANCER TYPE, 2020-2027 (USD MILLION)

TABLE 23 WESTERN EUROPE: VULVAR CANCER MARKET, BY TREATMENT TYPE, 2020-2027 (USD MILLION)

TABLE 24 WESTERN EUROPE: VULVAR CANCER MARKET, BY END USER, 2020-2027 (USD MILLION)

TABLE 25 EASTERN EUROPE: VULVAR CANCER MARKET, BY CANCER TYPE, 2020-2027 (USD MILLION)

TABLE 26 EASTERN EUROPE: VULVAR CANCER MARKET, BY TREATMENT TYPE, 2020-2027 (USD MILLION)

TABLE 27 EASTERN EUROPE: VULVAR CANCER MARKET, BY END USER, 2020-2027 (USD MILLION)

TABLE 28 ASIA-PACIFIC: VULVAR CANCER MARKET, BY CANCER TYPE, 2020-2027 (USD MILLION)

TABLE 29 ASIA-PACIFIC: VULVAR CANCER MARKET, BY TREATMENT TYPE, 2020-2027 (USD MILLION)

TABLE 30 ASIA-PACIFIC: VULVAR CANCER MARKET, BY END USER, 2020-2027 (USD MILLION)

TABLE 31 MIDDLE EAST & AFRICA: VULVAR CANCER MARKET, BY CANCER TYPE, 2020-2027 (USD MILLION)

TABLE 32 MIDDLE EAST & AFRICA: VULVAR CANCER MARKET, BY TREATMENT TYPE, 2020-2027 (USD MILLION)

TABLE 33 MIDDLE EAST & AFRICA: VULVAR CANCER MARKET, BY END USER, 2020-2027 (USD MILLION)

LIST OF FIGURES

FIGURE 1 RESEARCH PROCESS

FIGURE 2 MARKET STRUCTURE OF THE GLOBAL VULVAR CANCER MARKET

FIGURE 3 MARKET DYNAMICS OF THE GLOBAL VULVAR CANCER MARKET

FIGURE 4 GLOBAL VULVAR CANCER MARKET SHARE, BY CANCER TYPE, 2020 (%)

FIGURE 5 GLOBAL VULVAR CANCER MARKET SHARE, BY TREATMENT TYPE, 2020 (%)

FIGURE 6 GLOBAL VULVAR CANCER MARKET SHARE, BY END USER, 2020 (%)

FIGURE 7 GLOBAL VULVAR CANCER MARKET SHARE, BY REGION, 2020 (%)

FIGURE 7 AMERICAS: VULVAR CANCER MARKET SHARE BY REGION, 2020 (%)

FIGURE 8 NORTH AMERICA: VULVAR CANCER MARKET SHARE, BY COUNTRY, 2020 (%)

FIGURE 9 EUROPE: VULVAR CANCER MARKET SHARE, BY REGION, 2020 (%)

FIGURE 10 WESTERN EUROPE: VULVAR CANCER MARKET SHARE, BY COUNTRY, 2020 (%)

FIGURE 11 ASIA-PACIFIC: VULVAR CANCER MARKET SHARE, BY COUNTRY, 2020 (%)

FIGURE 12 MIDDLE EAST & AFRICA: VULVAR CANCER MARKET SHARE, BY COUNTRY, 2020 (%)

FIGURE 13 GLOBAL VULVAR CANCER MARKET: COMPANY SHARE ANALYSIS, 2020 (%)

FIGURE 14 AMGEN INC..: KEY FINANCIALS

FIGURE 15 AMGEN INC.: SEGMENTAL REVENUE

FIGURE 16 AMGEN INC.: REGIONAL REVENUE

FIGURE 17 BRISTOL-MYERS SQUIBB COMPANY: KEY FINANCIALS

FIGURE 18 BRISTOL-MYERS SQUIBB COMPANY: SEGMENTAL REVENUE

FIGURE 19 BRISTOL-MYERS SQUIBB COMPANY: REGIONAL REVENUE

FIGURE 20 CELGENE CORPORATION: KEY FINANCIALS

FIGURE 21 CELGENE CORPORATION: SEGMENTAL REVENUE

FIGURE 22 CELGENE CORPORATION: REGIONAL REVENUE

FIGURE 23 ELI LILLY AND COMPANY: KEY FINANCIALS

FIGURE 24 ELI LILLY AND COMPANY: SEGMENTAL REVENUE

FIGURE 25 ELI LILLY AND COMPANY: REGIONAL REVENUE

FIGURE 26 F. HOFFMANN-LA ROCHE LTD: KEY FINANCIALS

FIGURE 27 F. HOFFMANN-LA ROCHE LTD: SEGMENTAL REVENUE

FIGURE 28 F. HOFFMANN-LA ROCHE LTD: REGIONAL REVENUE

FIGURE 29 MERCK & CO., INC.: KEY FINANCIALS

FIGURE 30 MERCK & CO., INC.: SEGMENTAL REVENUE

FIGURE 31 MERCK & CO., INC.: REGIONAL REVENUE

FIGURE 32 NOVARTIS AG: KEY FINANCIALS

FIGURE 33 NOVARTIS AG: SEGMENTAL REVENUE

FIGURE 34 NOVARTIS AG: REGIONAL REVENUE

FIGURE 35 PFIZER INC.: KEY FINANCIALS

FIGURE 36 PFIZER INC.: SEGMENTAL REVENUE

FIGURE 37 PFIZER INC.: REGIONAL REVENUE

FIGURE 38 GLAXOSMITHKLINE PLC: KEY FINANCIALS

FIGURE 39 GLAXOSMITHKLINE PLC: SEGMENTAL REVENUE

FIGURE 40 GLAXOSMITHKLINE PLC: REGIONAL REVENUE

FIGURE 41 SANOFI: KEY FINANCIALS

FIGURE 42 SANOFI: SEGMENTAL REVENUE

FIGURE 43 SANOFI: REGIONAL REVENUE

FIGURE 44 JOHNSON & JOHNSON SERVICES, INC.: KEY FINANCIALS

FIGURE 45 JOHNSON & JOHNSON SERVICES, INC.: SEGMENTAL REVENUE

FIGURE 46 JOHNSON & JOHNSON SERVICES, INC.: REGIONAL REVENUE

Purchase Option
Single User $ 4,950
Multiuser License $ 5,950
Enterprise User $ 7,250
Compare Licenses
Tailored for You
  • Dedicated Research on any specifics segment or region.
  • Focused Research on specific players in the market.
  • Custom Report based only on your requirements.
  • Flexibility to add or subtract any chapter in the study.
  • Historic data from 2014 and forecasts outlook till 2040.
  • Flexibility of providing data/insights in formats (PDF, PPT, Excel).
  • Provide cross segmentation in applicable scenario/markets.