Virtual Pipelines Market Research Report – Forecast to 2032

Virtual Pipelines Market Research Report Information by Fuel Type (CNG and LNG), By Mode of Transport (Truck, Barge, Rail, and Ship), By End-Use (Residential, Transportation, Commercial, and Industrial), And By Region (North America, Europe, Asia-Pacific, And Rest Of The World) –Market Forecast Till 2032

ID: MRFR/E&P/4719-HCR | 100 Pages | Author: Priya Nagrale | March 2024         

Table of content

1 Executive Summary

2 Scope of the Report

2.1 Market Definition

2.2 Scope of the Study

2.2.1 Definition

2.2.2 Research Objective

2.2.3 Assumptions

2.2.4 Limitations

2.3 Research Process

2.3.1 Primary Research

2.3.2 Secondary Research

2.4 Market size Estimation

2.5 Forecast Model

3 Market Landscape

3.1 Porter’s Five Forces Analysis

3.1.1 Threat of New Entrants

3.1.2 Bargaining power of buyers

3.1.3 Bargaining power of suppliers

3.1.4 Threat of substitutes

3.1.5 Segment rivalry

3.2 Value Chain/Supply Chain Analysis

4 Market Dynamics

4.1 Introduction

4.2 Market Drivers

4.3 Market Restraints

4.4 Market Opportunities

4.5 Market Trends

5 Global Virtual Pipelines Market, By Fuel Type

5.1 Introduction

5.2 Compressed Natural Gas (CNG)

5.2.1 Market Estimates & Forecast, 2023-2032

5.2.2 Market Estimates & Forecast by Region, 2023-2032

5.3 Liquefied Natural Gas (LNG)

5.3.1 Market Estimates & Forecast, 2023-2032

5.3.2 Market Estimates & Forecast by Region, 2023-2032

6 Global Virtual Pipelines Market, By Mode of Transport

6.1 Introduction

6.2 Truck

6.2.1 Market Estimates & Forecast, 2023-2032

6.2.2 Market Estimates & Forecast by Region, 2023-2032

6.3 Barge

6.3.1 Market Estimates & Forecast, 2023-2032

6.3.2 Market Estimates & Forecast by Region, 2023-2032

6.4 Rail

6.4.1 Market Estimates & Forecast, 2023-2032

6.4.2 Market Estimates & Forecast by Region, 2023-2032

6.5 Ship

6.5.1 Market Estimates & Forecast, 2023-2032

6.5.2 Market Estimates & Forecast by Region, 2023-2032

7 Global Virtual Pipelines Market, By End-use

7.1 Introduction

7.2 Residential

7.2.1 Market Estimates & Forecast, 2023-2032

7.2.2 Market Estimates & Forecast by Region, 2023-2032

7.3 Commercial

7.3.1 Market Estimates & Forecast, 2023-2032

7.3.2 Market Estimates & Forecast by Region, 2023-2032

7.4 Industrial

7.4.1 Market Estimates & Forecast, 2023-2032

7.4.2 Market Estimates & Forecast by Region, 2023-2032

8 Global Virtual Pipelines Market, By Region

8.1 Introduction

8.2 North America

8.2.1 Market Estimates & Forecast, 2023-2032

8.2.2 Market Estimates & Forecast by FUEL TYPE, 2023-2032

8.2.3 Market Estimates & Forecast by Mode of Transport, 2023-2032

8.2.4 Market Estimates & Forecast by End-use , 2023-2032

8.2.5 U.S.

8.2.5.1 Market Estimates & Forecast, 2023-2032

8.2.5.2 Market Estimates & Forecast by FUEL TYPE, 2023-2032

8.2.5.3 Market Estimates & Forecast by Mode of Transport, 2023-2032

8.2.5.4 Market Estimates & Forecast by End-use , 2023-2032

8.2.6 Canada

8.2.6.1 Market Estimates & Forecast, 2023-2032

8.2.6.2 Market Estimates & Forecast by FUEL TYPE, 2023-2032

8.2.6.3 Market Estimates & Forecast by Mode of Transport, 2023-2032

8.2.6.4 Market Estimates & Forecast by End-use , 2023-2032

8.3 Europe

8.3.1 Market Estimates & Forecast, 2023-2032

8.3.2 Market Estimates & Forecast by FUEL TYPE, 2023-2032

8.3.3 Market Estimates & Forecast by Mode of Transport, 2023-2032

8.3.4 Market Estimates & Forecast by End-use , 2023-2032

8.3.5 U.K.

8.3.5.1 Market Estimates & Forecast, 2023-2032

8.3.5.2 Market Estimates & Forecast by FUEL TYPE, 2023-2032

8.3.5.3 Market Estimates & Forecast by Mode of Transport, 2023-2032

8.3.5.4 Market Estimates & Forecast by End-use , 2023-2032

8.3.6 Germany

8.3.6.1 Market Estimates & Forecast, 2023-2032

8.3.6.2 Market Estimates & Forecast by FUEL TYPE, 2023-2032

8.3.6.3 Market Estimates & Forecast by Mode of Transport, 2023-2032

8.3.6.4 Market Estimates & Forecast by End-use , 2023-2032

8.3.7 France

8.3.7.1 Market Estimates & Forecast, 2023-2032

8.3.7.2 Market Estimates & Forecast by FUEL TYPE, 2023-2032

8.3.7.3 Market Estimates & Forecast by Mode of Transport, 2023-2032

8.3.7.4 Market Estimates & Forecast by End-use , 2023-2032

8.3.8 Italy

8.3.8.1 Market Estimates & Forecast, 2023-2032

8.3.8.2 Market Estimates & Forecast by FUEL TYPE, 2023-2032

8.3.8.3 Market Estimates & Forecast by Mode of Transport, 2023-2032

8.3.8.4 Market Estimates & Forecast by End-use , 2023-2032

8.3.8 Rest of Europe

8.3.8.1 Market Estimates & Forecast, 2023-2032

8.3.8.2 Market Estimates & Forecast by FUEL TYPE, 2023-2032

8.3.8.3 Market Estimates & Forecast by Mode of Transport, 2023-2032

8.3.8.4 Market Estimates & Forecast by End-use , 2023-2032

8.4 Asia Pacific

8.4.1 Market Estimates & Forecast, 2023-2032

8.4.2 Market Estimates & Forecast by FUEL TYPE, 2023-2032

8.4.3 Market Estimates & Forecast by Mode of Transport, 2023-2032

8.4.4 Market Estimates & Forecast by End-use , 2023-2032

8.4.5 China

8.4.5.1 Market Estimates & Forecast, 2023-2032

8.4.5.2 Market Estimates & Forecast by FUEL TYPE, 2023-2032

8.4.5.3 Market Estimates & Forecast by Mode of Transport, 2023-2032

8.4.5.4 Market Estimates & Forecast by End-use , 2023-2032

8.4.6 Japan

8.4.6.1 Market Estimates & Forecast, 2023-2032

8.4.6.2 Market Estimates & Forecast by FUEL TYPE, 2023-2032

8.4.6.3 Market Estimates & Forecast by Mode of Transport, 2023-2032

8.4.6.4 Market Estimates & Forecast by End-use , 2023-2032

8.4.7 India

8.4.7.1 Market Estimates & Forecast, 2023-2032

8.4.7.2 Market Estimates & Forecast by FUEL TYPE, 2023-2032

8.4.7.3 Market Estimates & Forecast by Mode of Transport, 2023-2032

8.4.7.4 Market Estimates & Forecast by End-use , 2023-2032

8.4.8 Rest of Asia Pacific

8.4.8.1 Market Estimates & Forecast, 2023-2032

8.4.8.2 Market Estimates & Forecast by FUEL TYPE, 2023-2032

8.4.8.3 Market Estimates & Forecast by Mode of Transport, 2023-2032

8.4.8.4 Market Estimates & Forecast by End-use , 2023-2032

8.5 Rest of the World

8.5.1 Market Estimates & Forecast, 2023-2032

8.5.2 Market Estimates & Forecast by FUEL TYPE, 2023-2032

8.5.3 Market Estimates & Forecast by Mode of Transport, 2023-2032

8.5.4 Market Estimates & Forecast by End-use , 2023-2032

9 Competitive Landscape

10 Company Profile

10.1 GE Oil and Gas (U.S.)

10.1.1 Company Overview

10.1.2 Product/Services Offering

10.1.3 Financial Overview

10.1.4 Key Developments

10.1.5 Strategy

10.1.6 SWOT Analysis

10.2 Kinder Morgan (U.S.)

10.2.1 Company Overview

10.2.2 Product /Services Offering

10.2.3 Financial Overview

10.2.4 Key Developments

10.2.5 Strategy

10.2.6 SWOT Analysis

10.3 SUB161° (Australia)

10.3.1 Company Overview

10.3.2 Product /Services Offering

10.3.3 Financial Overview

10.3.4 Key Developments

10.3.5 Strategy

10.3.6 SWOT Analysis

10.4 Eniday (Italy)

10.4.1 Company Overview

10.4.2 Product /Services Offering

10.4.3 Financial Overview

10.4.4 Key Developments

10.4.5 Strategy

10.4.6 SWOT Analysis

10.5 Galileo Technologies S.A. (Argentina)

10.5.1 Company Overview

10.5.2 Product /Services Offering

10.5.4 Financial Overview

10.5.4 Key Developments

10.5.5 Strategy

10.5.6 SWOT Analysis

10.6 CNG Services Limited (U.K)

10.6.1 Company Overview

10.6.2 Product /Services Offering

10.6.3 Financial Overview

10.6.4 Key Developments

10.6.5 Strategy

10.6.6 SWOT Analysis

10.7 SENER Group (Spain)

10.7.1 Company Overview

10.7.2 Product /Services Offering

10.7.4 Financial Overview

10.7.4 Key Developments

10.7.5 Strategy

10.7.6 SWOT Analysis

10.8 Pentagon Energy LLC (U.S.)

10.8.1 Company Overview

10.8.2 Product /Services Offering

10.8.3 Financial Overview

10.8.4 Key Developments

10.8.5 Strategy

10.8.6 SWOT Analysis

10.9 Xpress Natural Gas LLC (U.S.)

10.9.1 Company Overview

10.9.2 Product /Services Offering

10.9.3 Financial Overview

10.9.4 Key Developments

10.9.5 Strategy

10.9.6 SWOT Analysis

10.10 OsComp Holdings LLC (U.S.)

10.10.1 Company Overview

10.10.2 Product /Services Offering

10.10.3 Financial Overview

10.10.4 Key Developments

10.10.5 Strategy

10.11 NG Advantage LLC (U.S.)

10.11.1 Company Overview

10.11.2 Product /Services Offering

10.11.3 Financial Overview

10.11.4 Key Developments

10.11.5 Strategy

10.11.6 SWOT Analysis

10.12 REV LNG LLC (U.S.)

10.12.1 Company Overview

10.12.2 Product /Services Offering

10.12.3 Financial Overview

10.12.4 Key Developments

10.12.5 Strategy

10.12.6 SWOT Analysis

11 Conclusion

12 Appendix

List of Tables

Table 1 Global Virtual Pipelines Market: By Region, 2023-2032

Table 2 North America Virtual Pipelines Market: By Country, 2023-2032

Table 3 Europe Virtual Pipelines Market: By Country, 2023-2032

Table 4 Asia Pacific Virtual Pipelines Market: By Country, 2023-2032

Table 5 RoW Virtual Pipelines Market: By Country, 2023-2032

Table 6 Global Virtual Pipelines Market by FUEL TYPE Market: By Regions, 2023-2032

Table 7 North America Virtual Pipelines Market by FUEL TYPE: By Country, 2023-2032

Table 8 Europe Virtual Pipelines Market by FUEL TYPE: By Country, 2023-2032

Table 9 Asia Pacific Virtual Pipelines Market by FUEL TYPE: By Country, 2023-2032

Table 10 RoW Virtual Pipelines Market by FUEL TYPE: By Country, 2023-2032

Table 11 Global Virtual Pipelines Market, by Mode of Transport, By Regions, 2023-2032

Table 12 North America Virtual Pipelines Market, by Mode of Transport, By Country, 2023-2032

Table 13 Europe Virtual Pipelines Market, by Mode of Transport, By Country, 2023-2032

Table 14 Asia Pacific Virtual Pipelines Market, by Mode of Transport, By Country, 2023-2032

Table 15 RoW Virtual Pipelines Market, by Mode of Transport, By Country, 2023-2032

Table 16 Global Virtual Pipelines Market, by End-use , By Regions, 2023-2032

Table 17 North America Virtual Pipelines Market, by End-use , By Country, 2023-2032

Table 18 Europe Virtual Pipelines Market, by End-use , By Country, 2023-2032

Table 19 Asia Pacific Virtual Pipelines Market, by End-use , By Country, 2023-2032

Table 20 RoW Virtual Pipelines Market, by End-use , By Country, 2023-2032

Table 21 Global Virtual Pipelines Market: By Region, 2023-2032

Table 22 Global Virtual Pipelines Market: By Region, 2023-2032

Table 23 Global Virtual Pipelines Market: By Region, 2023-2032

Table 24 North America Virtual Pipelines Market, By Country

Table 25 North America Virtual Pipelines Market, by FUEL TYPE

Table 26 North America Virtual Pipelines Market, By Mode of Transport

Table 27 North America Virtual Pipelines Market, By End-use

Table 28 Europe: Virtual Pipelines Market, By Country

Table 29 Europe: Virtual Pipelines Market, by FUEL TYPE

Table 30 Europe: Virtual Pipelines Market, By Mode of Transport

Table 31 Europe: Virtual Pipelines Market, By End-use

Table 32 Europe: Virtual Pipelines Market, By End-use

Table 33 Asia Pacific: Virtual Pipelines Market, By Country

Table 34 Asia Pacific: Virtual Pipelines Market, by FUEL TYPE

Table 35 Asia Pacific: Virtual Pipelines Market, By Mode of Transport

Table 36 Asia Pacific: Virtual Pipelines Market, By End-use

Table 37 RoW: Virtual Pipelines Market, By Region

Table 38 RoW Virtual Pipelines Market, by FUEL TYPE

Table 39 RoW Virtual Pipelines Market, By Mode of Transport

Table 40 RoW Virtual Pipelines Market, By End-use

List of Figures

FIGURE 1 RESEARCH PROCESS OF MRFR

FIGURE 2 TOP DOWN & BOTTOM UP APPROACH

FIGURE 3 MARKET DYNAMICS

FIGURE 4 IMPACT ANALYSIS: MARKET DRIVERS

FIGURE 5 IMPACT ANALYSIS: MARKET RESTRAINTS

FIGURE 6 PORTER’S FIVE FORCES ANALYSIS

FIGURE 7 VALUE CHAIN ANALYSIS

FIGURE 8 GLOBAL VIRTUAL PIPELINES MARKET SHARE, BY END-USE, 2023 (%)

FIGURE 9 GLOBAL VIRTUAL PIPELINES MARKET, BY END-USE, 2023-2032 (USD MILLION)

FIGURE 10 GLOBAL VIRTUAL PIPELINES MARKET SHARE, BY MODE OF TRANSPORT, 2023 (%)

FIGURE 11 GLOBAL VIRTUAL PIPELINES MARKET, BY MODE OF TRANSPORT, 2023-2032 (USD MILLION)

FIGURE 12 GLOBAL VIRTUAL PIPELINES MARKET SHARE (%), BY REGION, 2023

FIGURE 13 GLOBAL VIRTUAL PIPELINES MARKET, BY REGION, 2023-2032 (USD MILLION)

FIGURE 14 NORTH AMERICA VIRTUAL PIPELINES MARKET SHARE (%), 2023

FIGURE 15 NORTH AMERICA VIRTUAL PIPELINES MARKET BY COUNTRY, 2023-2032 (USD MILLION)

FIGURE 16 EUROPE VIRTUAL PIPELINES MARKET SHARE (%), 2023

FIGURE 17 EUROPE VIRTUAL PIPELINES MARKET BY COUNTRY, 2023-2032 (USD MILLION)

FIGURE 18 ASIA PACIFIC VIRTUAL PIPELINES MARKET SHARE (%), 2023

FIGURE 19 ASIA PACIFIC VIRTUAL PIPELINES MARKET BY COUNTRY, 2023-2032 (USD MILLION)

FIGURE 20 REST OF THE WORLD VIRTUAL PIPELINES MARKET SHARE (%), 2023

FIGURE 21 REST OF THE WORLD VIRTUAL PIPELINES MARKET BY COUNTRY, 2023-2032 (USD MILLION)

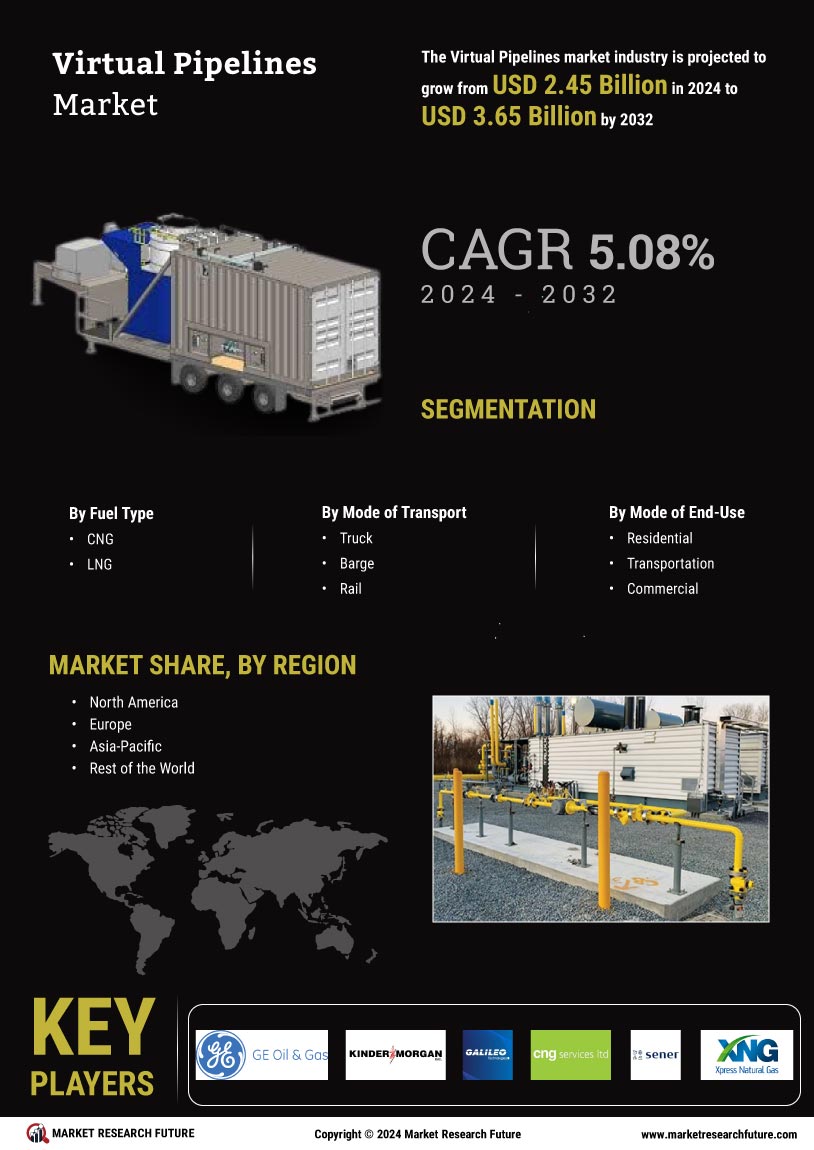
Virtual Pipelines Market Segmentation


Virtual Pipelines Fuel Type Outlook (USD Billion, 2018-2032)


  • CNG


  • LNG


Virtual Pipelines Mode of Transport Outlook (USD Billion, 2018-2032)


  • Truck


  • Barge


  • Rail


  • Ship


Virtual Pipelines Mode of End-Use Outlook (USD Billion, 2018-2032)


  • Residential


  • Transportation


  • Commercial


  • Industrial


Virtual Pipelines Regional Outlook (USD Billion, 2018-2032)


  • North America Outlook (USD Billion, 2018-2032)


    • North America Virtual Pipelines by Fuel Type


      • CNG


      • LNG


    • North America Virtual Pipelines by Mode of Transport


      • Truck


      • Barge


      • Rail


      • Ship


    • North America Virtual Pipelines by End-Use


      • Residential


      • Transportation


      • Commercial


      • Industrial


    • US Outlook (USD Billion, 2018-2032)


    • US Virtual Pipelines by Fuel Type


      • CNG


      • LNG


    • US Virtual Pipelines by Mode of Transport


      • Truck


      • Barge


      • Rail


      • Ship


    • US Virtual Pipelines by End-Use


      • Residential


      • Transportation


      • Commercial


      • Industrial


    • Canada Outlook (USD Billion, 2018-2032)


    • Canada Virtual Pipelines by Fuel Type


      • CNG


      • LNG


    • Canada Virtual Pipelines by Mode of Transport


      • Truck


      • Barge


      • Rail


      • Ship


    • Canada Virtual Pipelines by End-Use


      • Residential


      • Transportation


      • Commercial


      • Industrial


  • Europe Outlook (USD Billion, 2018-2032)


    • Europe Virtual Pipelines by Fuel Type


      • CNG


      • LNG


    • Europe Virtual Pipelines by Mode of Transport


      • Truck


      • Barge


      • Rail


      • Ship


    • Europe Virtual Pipelines by End-Use


      • Residential


      • Transportation


      • Commercial


      • Industrial


    • Germany Outlook (USD Billion, 2018-2032)


    • Germany Virtual Pipelines by Fuel Type


      • CNG


      • LNG


    • Germany Virtual Pipelines by Mode of Transport


      • Truck


      • Barge


      • Rail


      • Ship


    • Germany Virtual Pipelines by End-Use


      • Residential


      • Transportation


      • Commercial


      • Industrial


    • France Outlook (USD Billion, 2018-2032)


    • France Virtual Pipelines by Fuel Type


      • CNG


      • LNG


    • France Virtual Pipelines by Mode of Transport


      • Truck


      • Barge


      • Rail


      • Ship


    • France Virtual Pipelines by End-Use


      • Residential


      • Transportation


      • Commercial


      • Industrial


    • UK Outlook (USD Billion, 2018-2032)


    • UK Virtual Pipelines by Fuel Type


      • CNG


      • LNG


    • UK Virtual Pipelines by Mode of Transport


      • Truck


      • Barge


      • Rail


      • Ship


    • UK Virtual Pipelines by End-Use


      • Residential


      • Transportation


      • Commercial


      • Industrial


    • Italy Outlook (USD Billion, 2018-2032)


    • Italy Virtual Pipelines by Fuel Type


      • CNG


      • LNG


    • Italy Virtual Pipelines by Mode of Transport


      • Truck


      • Barge


      • Rail


      • Ship


    • Italy Virtual Pipelines by End-Use


      • Residential


      • Transportation


      • Commercial


      • Industrial


    • Spain Outlook (USD Billion, 2018-2032)


    • Spain Virtual Pipelines by Fuel Type


      • CNG


      • LNG


    • Spain Virtual Pipelines by Mode of Transport


      • Truck


      • Barge


      • Rail


      • Ship


    • Spain Virtual Pipelines by End-Use


      • Residential


      • Transportation


      • Commercial


      • Industrial


    • Rest Of Europe Outlook (USD Billion, 2018-2032)


    • Rest Of Europe Virtual Pipelines by Fuel Type


      • CNG


      • LNG


    • Rest Of Europe Virtual Pipelines by Mode of Transport


      • Truck


      • Barge


      • Rail


      • Ship


    • Rest of Europe Virtual Pipelines by End-Use


      • Residential


      • Transportation


      • Commercial


      • Industrial


  • Asia-Pacific Outlook (USD Billion, 2018-2032)


    • Asia-Pacific Virtual Pipelines by Fuel Type


      • CNG


      • LNG


    • Asia-Pacific Virtual Pipelines by Mode of Transport


      • Truck


      • Barge


      • Rail


      • Ship


    • Asia-pacific Virtual Pipelines by End-Use


      • Residential


      • Transportation


      • Commercial


      • Industrial


    • China Outlook (USD Billion, 2018-2032)


    • China Virtual Pipelines by Fuel Type


      • CNG


      • LNG


    • China Virtual Pipelines by Mode of Transport


      • Truck


      • Barge


      • Rail


      • Ship


    • China Virtual Pipelines by End-Use


      • Residential


      • Transportation


      • Commercial


      • Industrial


    • Japan Outlook (USD Billion, 2018-2032)


    • Japan Virtual Pipelines by Fuel Type


      • CNG


      • LNG


    • Japan Virtual Pipelines by Mode of Transport


      • Truck


      • Barge


      • Rail


      • Ship


    • Japan Virtual Pipelines by End-Use


      • Residential


      • Transportation


      • Commercial


      • Industrial


    • India Outlook (USD Billion, 2018-2032)


    • India Virtual Pipelines by Fuel Type


      • CNG


      • LNG


    • India Virtual Pipelines by Mode of Transport


      • Truck


      • Barge


      • Rail


      • Ship


    • India Virtual Pipelines by End-Use


      • Residential


      • Transportation


      • Commercial


      • Industrial


    • Australia Outlook (USD Billion, 2018-2032)


    • Australia Virtual Pipelines by Fuel Type


      • CNG


      • LNG


    • Australia Virtual Pipelines by Mode of Transport


      • Truck


      • Barge


      • Rail


      • Ship


    • Australia Virtual Pipelines by End-Use


      • Residential


      • Transportation


      • Commercial


      • Industrial


    • Rest of Asia-Pacific Outlook (USD Billion, 2018-2032)


    • Rest of Asia-Pacific Virtual Pipelines by Fuel Type


      • CNG


      • LNG


    • Rest of Asia-Pacific Virtual Pipelines by Mode of Transport


      • Truck


      • Barge


      • Rail


      • Ship


    • Rest of Asia-Pacific Virtual Pipelines by End-Use


      • Residential


      • Transportation


      • Commercial


      • Industrial


  • Rest of the World Outlook (USD Billion, 2018-2032)


    • Rest of the World Virtual Pipelines by Fuel Type


      • CNG


      • LNG


    • Rest of the World Virtual Pipelines by Mode of Transport


      • Truck


      • Barge


      • Rail


      • Ship


    • Rest of the World Virtual Pipelines by End-Use


      • Residential


      • Transportation


      • Commercial


      • Industrial


    • Middle East Outlook (USD Billion, 2018-2032)


    • Middle East Virtual Pipelines by Fuel Type


      • CNG


      • LNG


    • Middle East Virtual Pipelines by Mode of Transport


      • Truck


      • Barge


      • Rail


      • Ship


    • Middle East Virtual Pipelines by End-Use


      • Residential


      • Transportation


      • Commercial


      • Industrial


    • Africa Outlook (USD Billion, 2018-2032)


    • Africa Virtual Pipelines by Fuel Type


      • CNG


      • LNG


    • Africa Virtual Pipelines by Mode of Transport


      • Truck


      • Barge


      • Rail


      • Ship


    • Africa Virtual Pipelines by End-Use


      • Residential


      • Transportation


      • Commercial


      • Industrial


    • Latin America Outlook (USD Billion, 2018-2032)


    • Latin America Virtual Pipelines by Fuel Type


      • CNG


      • LNG


    • Latin America Virtual Pipelines by Mode of Transport


      • Truck


      • Barge


      • Rail


      • Ship


    • Latin America Virtual Pipelines by End-Use


      • Residential


      • Transportation


      • Commercial


      • Industrial


Leading companies partner with us for data-driven Insights.
Report List icon Report List icon Report List icon Report List icon Report List icon Report List icon Report List icon Report List icon Report List icon Report List icon Report List icon

Kindly complete the form below to receive a free sample of this Report

Please fill in Business Email for Quick Response
Invalid