ID: MRFR/E&P/4719-HCR | February 2021 | Region: Global | 100 pages
Market Scenario
Natural gas is the cleanest fossil fuel amongst all conventional energy sources and can be used for numerous applications. It is distributed in two forms, namely compressed natural gas (CNG), and liquefied natural gas (LNG). Midstream operations for the natural gas are bridging the gap between the generation point to the consumption point. Virtual pipelines function as physical gas pipelines. These are substitutes to the traditional physical pipelines where natural gas is transported through land or sea modes of transport. Through virtual pipelines, natural gas can be supplied to endpoints where the feasibility of physical pipeline infrastructure construction is low. Typically, the pipelines are used for transporting natural gas but with increasing and demand, virtual pipelines have captured the midstream market for natural gas.
The advantages of the virtual pipelines include lowered cost investments in the infrastructure construction, and strategically locating the prime consuming markets. Virtual pipelines are not vulnerable like the physical pipelines, where complete flow and transport of natural gas is prohibited in case of any disturbance or calamity in the pipeline.
The driving factors for global virtual pipelines market are increased production of natural gas, emerging markets as net importers and exporters of natural gas, rising number of liquefaction and regasification terminals, and obsolescence and inefficiency of existing infrastructure. According to IEA, in 2017, OECD natural gas production grew by 2.4% as compared to the previous year. Besides, the natural gas deliveries also improved by 1.2% in 2017, as compared to 2016. Besides, every year the global liquefaction and regasification capacity is rising, creating demand for more gas transportation to regasification and liquefaction terminals. Moreover, many regions are facing issues related to complex and inflexible gas pipeline infrastructure. For an instance, Europe’s natural gas transportation is limited to inflexible pipes, and gas supply disruption due to the lack of pipeline infrastructure. This creates opportunities for virtual pipelines for maintaining the supply and demand for natural gas.
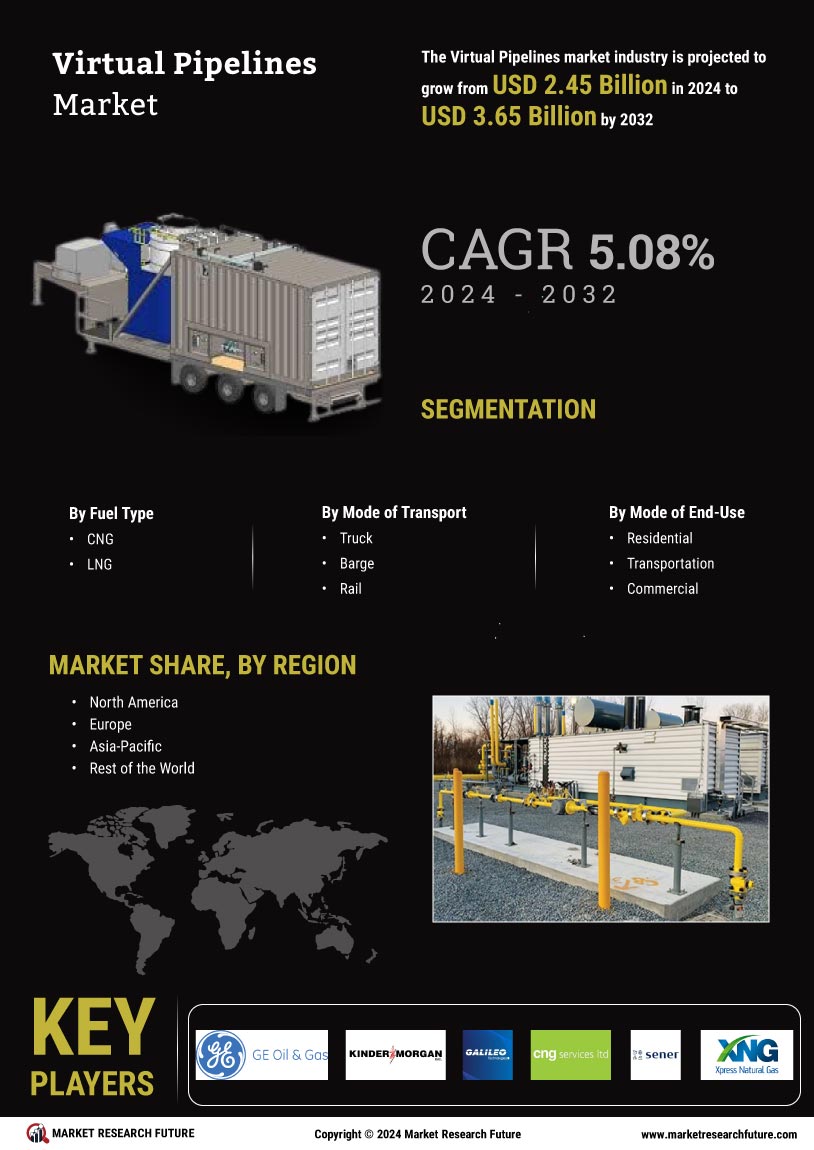
The global virtual pipeline market has been segmented on the basis of fuel type, mode of transport, End-uses, and regions. Based on fuel type, the market is sub-segmented as CNG and LNG. CNG segment is dominating due to increasing production of natural gas along with increased demand from the liquefaction terminals. Considering the mode of transport segment, the market is classified as truck, barge, rail, and ship. Ship segment holds the largest market share due to increased net imports for natural gas from developing nations. In 2017, total natural gas imports increased by 5.1% as compared to 2016. Based on end-use, global virtual pipeline market is categorized as residential, commercial, and industrial. Industrial segment is dominating the market owing to increased power generation from natural gas, and expanding fertilizers industry.
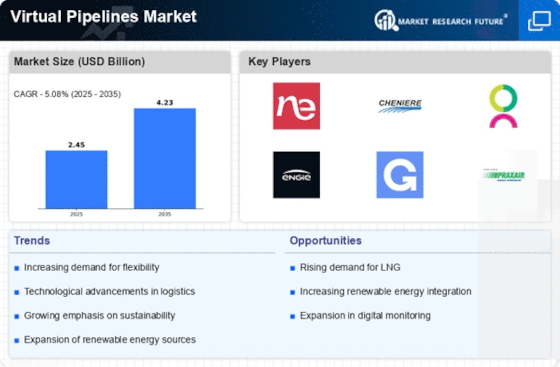
The global virtual pipelines market is projected to progress at ~ 7.5% CAGR during the forecast period, which is 2018-2023.
Market Segmentation
Global Virtual Pipelines Market
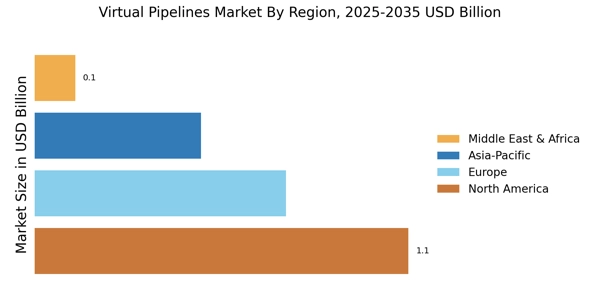
Europe region is expected to dominate the market for virtual pipeline due to the increasing demand for natural gas for power generation and heating spaces. The region demands better gas transportation facilities as the existing physical pipelines have become obsolete and require high costs for maintenance and improvement. Asia-Pacific is the fastest growing region as the net importers for natural gas are the developing nations of the region. China itself was the largest consumer of natural gas in 2017, and the consumption is expected to grow with industrialization and urbanization projects. Emerging markets of the region such as Indonesia, and Pakistan are also witnessing high demand for natural gas, which is raising the opportunities for virtual pipelines in Asia Pacific.
Key Players
The key players of the global virtual pipelines market are GE Oil and Gas (U.S.), Kinder Morgan (U.S.), SUB161° (Australia), Eniday (Italy), Galileo Technologies S.A. (Argentina), and CNG Services Limited (U.K). SENER Group (Spain), Pentagon Energy LLC (U.S.), Xpress Natural Gas LLC (U.S.), OsComp Holdings LLC (U.S.), NG Advantage LLC (U.S.), and REV LNG LLC (U.S.) are among others.
Frequently Asked Questions (FAQ) :
A 7.5% CAGR is estimated to define the development of the market in the coming years.
A strong income level is predicted to be seen in the market.
Pentagon Energy LLC (U.S.), SENER Group (Spain), NG Advantage LLC (U.S.), Xpress Natural Gas LLC (U.S.), and OsComp Holdings LLC (U.S.) are the contenders in the market.
The European region is encouraging the market significantly in the upcoming period.
The amplified production of natural gas and the appearance of emerging markets as net importers are predicted to motivate the market.
Table of content
1 Executive Summary
2 Scope of the Report
2.1 Market Definition
2.2 Scope of the Study
2.2.1 Definition
2.2.2 Research Objective
2.2.3 Assumptions
2.2.4 Limitations
2.3 Research Process
2.3.1 Primary Research
2.3.2 Secondary Research
2.4 Market size Estimation
2.5 Forecast Model
3 Market Landscape
3.1 Porter’s Five Forces Analysis
3.1.1 Threat of New Entrants
3.1.2 Bargaining power of buyers
3.1.3 Bargaining power of suppliers
3.1.4 Threat of substitutes
3.1.5 Segment rivalry
3.2 Value Chain/Supply Chain Analysis
4 Market Dynamics
4.1 Introduction
4.2 Market Drivers
4.3 Market Restraints
4.4 Market Opportunities
4.5 Market Trends
5 Global Virtual Pipelines Market, By Fuel Type
5.1 Introduction
5.2 Compressed Natural Gas (CNG)
5.2.1 Market Estimates & Forecast, 2018-2023
5.2.2 Market Estimates & Forecast by Region, 2018-2023
5.3 Liquefied Natural Gas (LNG)
5.3.1 Market Estimates & Forecast, 2018-2023
5.3.2 Market Estimates & Forecast by Region, 2018-2023
6 Global Virtual Pipelines Market, By Mode of Transport
6.1 Introduction
6.2 Truck
6.2.1 Market Estimates & Forecast, 2018-2023
6.2.2 Market Estimates & Forecast by Region, 2018-2023
6.3 Barge
6.3.1 Market Estimates & Forecast, 2018-2023
6.3.2 Market Estimates & Forecast by Region, 2018-2023
6.4 Rail
6.4.1 Market Estimates & Forecast, 2018-2023
6.4.2 Market Estimates & Forecast by Region, 2018-2023
6.5 Ship
6.5.1 Market Estimates & Forecast, 2018-2023
6.5.2 Market Estimates & Forecast by Region, 2018-2023
7 Global Virtual Pipelines Market, By End-use
7.1 Introduction
7.2 Residential
7.2.1 Market Estimates & Forecast, 2017-2023
7.2.2 Market Estimates & Forecast by Region, 2017-2023
7.3 Commercial
7.3.1 Market Estimates & Forecast, 2017-2023
7.3.2 Market Estimates & Forecast by Region, 2017-2023
7.4 Industrial
7.4.1 Market Estimates & Forecast, 2017-2023
7.4.2 Market Estimates & Forecast by Region, 2017-2023
8 Global Virtual Pipelines Market, By Region
8.1 Introduction
8.2 North America
8.2.1 Market Estimates & Forecast, 2018-2023
8.2.2 Market Estimates & Forecast by FUEL TYPE, 2018-2023
8.2.3 Market Estimates & Forecast by Mode of Transport, 2018-2023
8.2.4 Market Estimates & Forecast by End-use , 2018-2023
8.2.5 U.S.
8.2.5.1 Market Estimates & Forecast, 2018-2023
8.2.5.2 Market Estimates & Forecast by FUEL TYPE, 2018-2023
8.2.5.3 Market Estimates & Forecast by Mode of Transport, 2018-2023
8.2.5.4 Market Estimates & Forecast by End-use , 2018-2023
8.2.6 Canada
8.2.6.1 Market Estimates & Forecast, 2018-2023
8.2.6.2 Market Estimates & Forecast by FUEL TYPE, 2018-2023
8.2.6.3 Market Estimates & Forecast by Mode of Transport, 2018-2023
8.2.6.4 Market Estimates & Forecast by End-use , 2018-2023
8.3 Europe
8.3.1 Market Estimates & Forecast, 2018-2023
8.3.2 Market Estimates & Forecast by FUEL TYPE, 2018-2023
8.3.3 Market Estimates & Forecast by Mode of Transport, 2018-2023
8.3.4 Market Estimates & Forecast by End-use , 2018-2023
8.3.5 U.K.
8.3.5.1 Market Estimates & Forecast, 2018-2023
8.3.5.2 Market Estimates & Forecast by FUEL TYPE, 2018-2023
8.3.5.3 Market Estimates & Forecast by Mode of Transport, 2018-2023
8.3.5.4 Market Estimates & Forecast by End-use , 2018-2023
8.3.6 Germany
8.3.6.1 Market Estimates & Forecast, 2018-2023
8.3.6.2 Market Estimates & Forecast by FUEL TYPE, 2018-2023
8.3.6.3 Market Estimates & Forecast by Mode of Transport, 2018-2023
8.3.6.4 Market Estimates & Forecast by End-use , 2018-2023
8.3.7 France
8.3.7.1 Market Estimates & Forecast, 2018-2023
8.3.7.2 Market Estimates & Forecast by FUEL TYPE, 2018-2023
8.3.7.3 Market Estimates & Forecast by Mode of Transport, 2018-2023
8.3.7.4 Market Estimates & Forecast by End-use , 2018-2023
8.3.8 Italy
8.3.8.1 Market Estimates & Forecast, 2018-2023
8.3.8.2 Market Estimates & Forecast by FUEL TYPE, 2018-2023
8.3.8.3 Market Estimates & Forecast by Mode of Transport, 2018-2023
8.3.8.4 Market Estimates & Forecast by End-use , 2018-2023
8.3.8 Rest of Europe
8.3.8.1 Market Estimates & Forecast, 2018-2023
8.3.8.2 Market Estimates & Forecast by FUEL TYPE, 2018-2023
8.3.8.3 Market Estimates & Forecast by Mode of Transport, 2018-2023
8.3.8.4 Market Estimates & Forecast by End-use , 2018-2023
8.4 Asia Pacific
8.4.1 Market Estimates & Forecast, 2018-2023
8.4.2 Market Estimates & Forecast by FUEL TYPE, 2018-2023
8.4.3 Market Estimates & Forecast by Mode of Transport, 2018-2023
8.4.4 Market Estimates & Forecast by End-use , 2018-2023
8.4.5 China
8.4.5.1 Market Estimates & Forecast, 2018-2023
8.4.5.2 Market Estimates & Forecast by FUEL TYPE, 2018-2023
8.4.5.3 Market Estimates & Forecast by Mode of Transport, 2018-2023
8.4.5.4 Market Estimates & Forecast by End-use , 2018-2023
8.4.6 Japan
8.4.6.1 Market Estimates & Forecast, 2018-2023
8.4.6.2 Market Estimates & Forecast by FUEL TYPE, 2018-2023
8.4.6.3 Market Estimates & Forecast by Mode of Transport, 2018-2023
8.4.6.4 Market Estimates & Forecast by End-use , 2018-2023
8.4.7 India
8.4.7.1 Market Estimates & Forecast, 2018-2023
8.4.7.2 Market Estimates & Forecast by FUEL TYPE, 2018-2023
8.4.7.3 Market Estimates & Forecast by Mode of Transport, 2018-2023
8.4.7.4 Market Estimates & Forecast by End-use , 2018-2023
8.4.8 Rest of Asia Pacific
8.4.8.1 Market Estimates & Forecast, 2018-2023
8.4.8.2 Market Estimates & Forecast by FUEL TYPE, 2018-2023
8.4.8.3 Market Estimates & Forecast by Mode of Transport, 2018-2023
8.4.8.4 Market Estimates & Forecast by End-use , 2018-2023
8.5 Rest of the World
8.5.1 Market Estimates & Forecast, 2018-2023
8.5.2 Market Estimates & Forecast by FUEL TYPE, 2018-2023
8.5.3 Market Estimates & Forecast by Mode of Transport, 2018-2023
8.5.4 Market Estimates & Forecast by End-use , 2018-2023
9 Competitive Landscape
10 Company Profile
10.1 GE Oil and Gas (U.S.)
10.1.1 Company Overview
10.1.2 Product/Services Offering
10.1.3 Financial Overview
10.1.4 Key Developments
10.1.5 Strategy
10.1.6 SWOT Analysis
10.2 Kinder Morgan (U.S.)
10.2.1 Company Overview
10.2.2 Product /Services Offering
10.2.3 Financial Overview
10.2.4 Key Developments
10.2.5 Strategy
10.2.6 SWOT Analysis
10.3 SUB161° (Australia)
10.3.1 Company Overview
10.3.2 Product /Services Offering
10.3.3 Financial Overview
10.3.4 Key Developments
10.3.5 Strategy
10.3.6 SWOT Analysis
10.4 Eniday (Italy)
10.4.1 Company Overview
10.4.2 Product /Services Offering
10.4.3 Financial Overview
10.4.4 Key Developments
10.4.5 Strategy
10.4.6 SWOT Analysis
10.5 Galileo Technologies S.A. (Argentina)
10.5.1 Company Overview
10.5.2 Product /Services Offering
10.5.4 Financial Overview
10.5.4 Key Developments
10.5.5 Strategy
10.5.6 SWOT Analysis
10.6 CNG Services Limited (U.K)
10.6.1 Company Overview
10.6.2 Product /Services Offering
10.6.3 Financial Overview
10.6.4 Key Developments
10.6.5 Strategy
10.6.6 SWOT Analysis
10.7 SENER Group (Spain)
10.7.1 Company Overview
10.7.2 Product /Services Offering
10.7.4 Financial Overview
10.7.4 Key Developments
10.7.5 Strategy
10.7.6 SWOT Analysis
10.8 Pentagon Energy LLC (U.S.)
10.8.1 Company Overview
10.8.2 Product /Services Offering
10.8.3 Financial Overview
10.8.4 Key Developments
10.8.5 Strategy
10.8.6 SWOT Analysis
10.9 Xpress Natural Gas LLC (U.S.)
10.9.1 Company Overview
10.9.2 Product /Services Offering
10.9.3 Financial Overview
10.9.4 Key Developments
10.9.5 Strategy
10.9.6 SWOT Analysis
10.10 OsComp Holdings LLC (U.S.)
10.10.1 Company Overview
10.10.2 Product /Services Offering
10.10.3 Financial Overview
10.10.4 Key Developments
10.10.5 Strategy
10.11 NG Advantage LLC (U.S.)
10.11.1 Company Overview
10.11.2 Product /Services Offering
10.11.3 Financial Overview
10.11.4 Key Developments
10.11.5 Strategy
10.11.6 SWOT Analysis
10.12 REV LNG LLC (U.S.)
10.12.1 Company Overview
10.12.2 Product /Services Offering
10.12.3 Financial Overview
10.12.4 Key Developments
10.12.5 Strategy
10.12.6 SWOT Analysis
11 Conclusion
12 Appendix
List of Tables
Table 1 Global Virtual Pipelines Market: By Region, 2018-2023
Table 2 North America Virtual Pipelines Market: By Country, 2018-2023
Table 3 Europe Virtual Pipelines Market: By Country, 2018-2023
Table 4 Asia Pacific Virtual Pipelines Market: By Country, 2018-2023
Table 5 RoW Virtual Pipelines Market: By Country, 2018-2023
Table 6 Global Virtual Pipelines Market by FUEL TYPE Market: By Regions, 2018-2023
Table 7 North America Virtual Pipelines Market by FUEL TYPE: By Country, 2018-2023
Table 8 Europe Virtual Pipelines Market by FUEL TYPE: By Country, 2018-2023
Table 9 Asia Pacific Virtual Pipelines Market by FUEL TYPE: By Country, 2018-2023
Table 10 RoW Virtual Pipelines Market by FUEL TYPE: By Country, 2018-2023
Table 11 Global Virtual Pipelines Market, by Mode of Transport, By Regions, 2018-2023
Table 12 North America Virtual Pipelines Market, by Mode of Transport, By Country, 2018-2023
Table 13 Europe Virtual Pipelines Market, by Mode of Transport, By Country, 2018-2023
Table 14 Asia Pacific Virtual Pipelines Market, by Mode of Transport, By Country, 2018-2023
Table 15 RoW Virtual Pipelines Market, by Mode of Transport, By Country, 2018-2023
Table 16 Global Virtual Pipelines Market, by End-use , By Regions, 2018-2023
Table 17 North America Virtual Pipelines Market, by End-use , By Country, 2018-2023
Table 18 Europe Virtual Pipelines Market, by End-use , By Country, 2018-2023
Table 19 Asia Pacific Virtual Pipelines Market, by End-use , By Country, 2018-2023
Table 20 RoW Virtual Pipelines Market, by End-use , By Country, 2018-2023
Table 21 Global Virtual Pipelines Market: By Region, 2018-2023
Table 22 Global Virtual Pipelines Market: By Region, 2018-2023
Table 23 Global Virtual Pipelines Market: By Region, 2018-2023
Table 24 North America Virtual Pipelines Market, By Country
Table 25 North America Virtual Pipelines Market, by FUEL TYPE
Table 26 North America Virtual Pipelines Market, By Mode of Transport
Table 27 North America Virtual Pipelines Market, By End-use
Table 28 Europe: Virtual Pipelines Market, By Country
Table 29 Europe: Virtual Pipelines Market, by FUEL TYPE
Table 30 Europe: Virtual Pipelines Market, By Mode of Transport
Table 31 Europe: Virtual Pipelines Market, By End-use
Table 32 Europe: Virtual Pipelines Market, By End-use
Table 33 Asia Pacific: Virtual Pipelines Market, By Country
Table 34 Asia Pacific: Virtual Pipelines Market, by FUEL TYPE
Table 35 Asia Pacific: Virtual Pipelines Market, By Mode of Transport
Table 36 Asia Pacific: Virtual Pipelines Market, By End-use
Table 37 RoW: Virtual Pipelines Market, By Region
Table 38 RoW Virtual Pipelines Market, by FUEL TYPE
Table 39 RoW Virtual Pipelines Market, By Mode of Transport
Table 40 RoW Virtual Pipelines Market, By End-use
List of Figures
FIGURE 1 RESEARCH PROCESS OF MRFR
FIGURE 2 TOP DOWN & BOTTOM UP APPROACH
FIGURE 3 MARKET DYNAMICS
FIGURE 4 IMPACT ANALYSIS: MARKET DRIVERS
FIGURE 5 IMPACT ANALYSIS: MARKET RESTRAINTS
FIGURE 6 PORTER’S FIVE FORCES ANALYSIS
FIGURE 7 VALUE CHAIN ANALYSIS
FIGURE 8 GLOBAL VIRTUAL PIPELINES MARKET SHARE, BY END-USE, 2016 (%)
FIGURE 9 GLOBAL VIRTUAL PIPELINES MARKET, BY END-USE, 2015-2023 (USD MILLION)
FIGURE 10 GLOBAL VIRTUAL PIPELINES MARKET SHARE, BY MODE OF TRANSPORT, 2016 (%)
FIGURE 11 GLOBAL VIRTUAL PIPELINES MARKET, BY MODE OF TRANSPORT, 2015-2023 (USD MILLION)
FIGURE 12 GLOBAL VIRTUAL PIPELINES MARKET SHARE (%), BY REGION, 2016
FIGURE 13 GLOBAL VIRTUAL PIPELINES MARKET, BY REGION, 2015-2023 (USD MILLION)
FIGURE 14 NORTH AMERICA VIRTUAL PIPELINES MARKET SHARE (%), 2016
FIGURE 15 NORTH AMERICA VIRTUAL PIPELINES MARKET BY COUNTRY, 2015-2023 (USD MILLION)
FIGURE 16 EUROPE VIRTUAL PIPELINES MARKET SHARE (%), 2016
FIGURE 17 EUROPE VIRTUAL PIPELINES MARKET BY COUNTRY, 2015-2023 (USD MILLION)
FIGURE 18 ASIA PACIFIC VIRTUAL PIPELINES MARKET SHARE (%), 2016
FIGURE 19 ASIA PACIFIC VIRTUAL PIPELINES MARKET BY COUNTRY, 2015-2023 (USD MILLION)
FIGURE 20 REST OF THE WORLD VIRTUAL PIPELINES MARKET SHARE (%), 2016
FIGURE 21 REST OF THE WORLD VIRTUAL PIPELINES MARKET BY COUNTRY, 2015-2023 (USD MILLION)