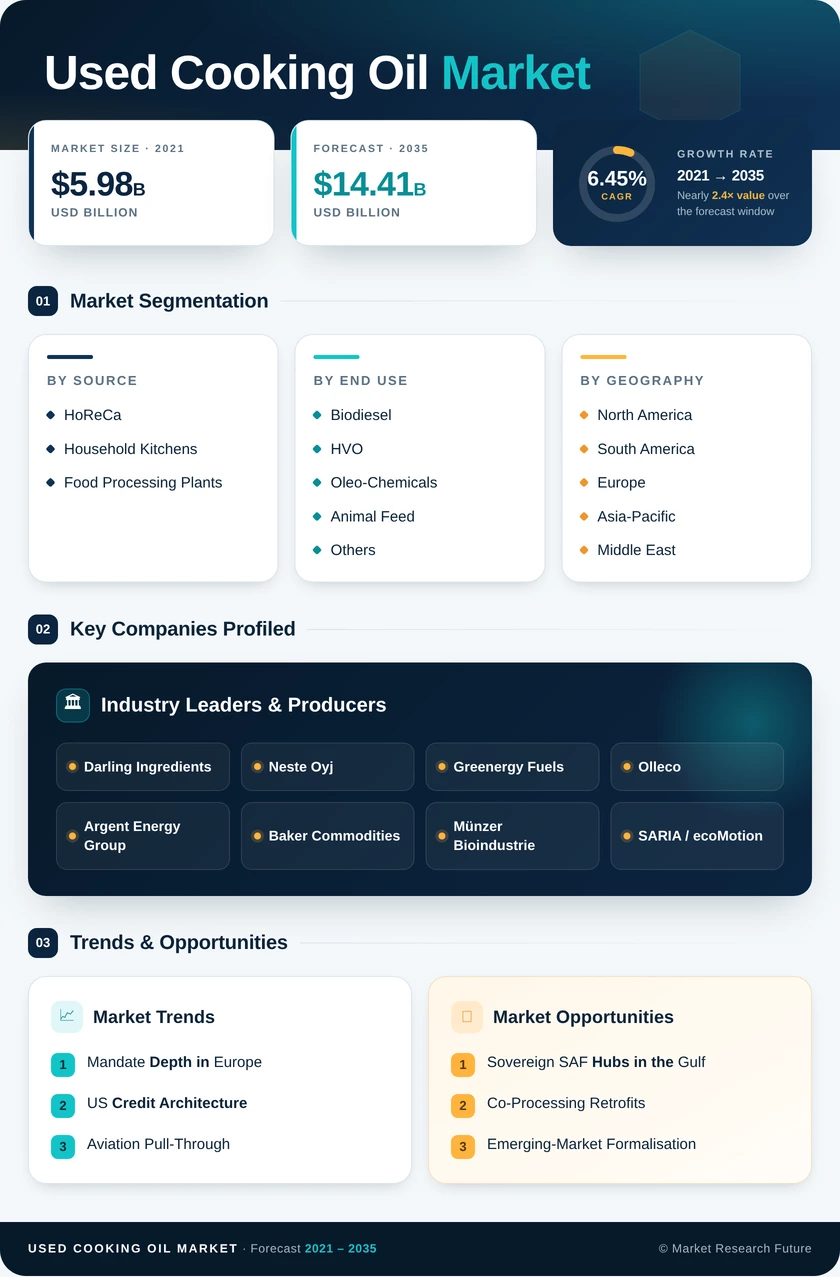
Used Cooking Oil Market (2026 - 2035)

ID: MRFR/FnB/3099-CR 200 Pages Snehal Singh Last Updated: September 15, 2026
Used Cooking Oil (UCO) Market Size, Share, Industry Trend & Analysis Research Report By Source (HoReCa, Household Kitchens, Food Processing Plants), By End Use (Biodiesel and HVO, Oleo-Chemicals, Animal Feed, Others), By Geography (North America, South America, Europe, Asia-Pacific, Middle East and Africa) - Forecast to 2035
Used Cooking Oil Market
Market Size
Forecast Period2026-2035
CAGR (2026-2035)6.45%
2025 Market SizeUSD 7.71 Billion
2035 Market SizeUSD 14.41 Billion
Key Players
Darling Ingredients
Neste Oyj
Greenergy Fuels
Olleco
Argent Energy Group
Baker Commodities
Opportunities
  • Sovereign SAF Hubs in the Gulf
  • Co-Processing Retrofits
  • Emerging-Market Formalisation
  1. 1 Market Summary |
    1. 1.1 Study Assumptions & Market Definition |
    2. 1.2 Scope of the Study |
    3. 1.3 Research Methodology
  2. 2 Key Report Takeaways |
    1. 2.1 By Source |
    2. 2.2 By End Use |
    3. 2.3 By Geography
  3. 3 Market Size & Forecast (2021–2035) |
    1. 3.1 Historical Market Size (2021–2025) |
    2. 3.2 Current & Forecast Market Size (2026–2035) |
    3. 3.3 Year-over-Year Growth Analysis
  4. 4 Driver Impact Analysis |
    1. 4.1 Mandate Depth in Europe |
    2. 4.2 US Credit Architecture |
    3. 4.3 Aviation Pull-Through |
    4. 4.4 Foodservice Density in Asia
  5. 5 Restraints Impact Analysis |
    1. 5.1 The Traceability Problem |
    2. 5.2 Household Channel Economics
  6. 6 Opportunities |
    1. 6.1 Sovereign SAF Hubs in the Gulf |
    2. 6.2 Co-Processing Retrofits |
    3. 6.3 Emerging-Market Formalisation |
    4. 6.4 Data Monetisation and Yield Analytics |
    5. 6.5 Oleo-Chemical Premiumisation
  7. 7 Regional Market Share & Country-Level Analysis |
    1. 7.1 North America | |
      1. 7.1.1 US | |
      2. 7.1.2 Canada | |
      3. 7.1.3 Mexico |
    2. 7.2 Europe | |
      1. 7.2.1 Germany | |
      2. 7.2.2 UK | |
      3. 7.2.3 France | |
      4. 7.2.4 Italy | |
      5. 7.2.5 Spain | |
      6. 7.2.6 Nordic Countries | |
      7. 7.2.7 Russia | |
      8. 7.2.8 Rest of Europe |
    3. 7.3 Asia-Pacific | |
      1. 7.3.1 China | |
      2. 7.3.2 India | |
      3. 7.3.3 Japan | |
      4. 7.3.4 South Korea | |
      5. 7.3.5 ASEAN | |
      6. 7.3.6 Rest of Asia-Pacific |
    4. 7.4 South America | |
      1. 7.4.1 Brazil | |
      2. 7.4.2 Argentina | |
      3. 7.4.3 Rest of South America |
    5. 7.5 Middle East & Africa | |
      1. 7.5.1 Saudi Arabia | |
      2. 7.5.2 UAE | |
      3. 7.5.3 South Africa | |
      4. 7.5.4 Egypt | |
      5. 7.5.5 Rest of MEA
  8. 8 Future Outlook (2026–2035) |
    1. 8.1 Autonomous Collection Networks |
    2. 8.2 Refinery Asset Reallocation |
    3. 8.3 Carbon Intensity as Currency |
    4. 8.4 Verification Infrastructure Consolidation
  9. 9 Market Segmentation Analysis |
    1. 9.1 By Source | |
      1. 9.1.1 HoReCa | |
      2. 9.1.2 Household Kitchens | |
      3. 9.1.3 Food Processing Plants |
    2. 9.2 By End Use | |
      1. 9.2.1 Biodiesel and HVO | |
      2. 9.2.2 Oleo-Chemicals | |
      3. 9.2.3 Animal Feed | |
      4. 9.2.4 Others
  10. 10 Competitive Landscape |
    1. 10.1 Market Concentration Analysis (2026) |
    2. 10.2 Competitive Benchmarking Matrix |
    3. 10.3 Company Profiles
  11. 11 Recent News & Developments
  12. 12 Report Scope & Methodology
  13. 13 Detailed Sources & Citations
  14. 14 Frequently Asked Questions
  15. 15 LIST OF TABLES |
  16. TABLE 1 Global Used Cooking Oil Market Size & Forecast, by Revenue (USD Billion), 2021–2035 |
  17. TABLE 2 Global Used Cooking Oil Market – Year-over-Year Growth Analysis, 2021–2035 |
  18. TABLE 3 Driver Impact Analysis – Used Cooking Oil Market, 2026–2035 |
  19. TABLE 4 Restraint Impact Analysis – Used Cooking Oil Market, 2026–2035 |
  20. TABLE 5 Global Used Cooking Oil Market Size, by Region, 2021–2035 (USD Billion) |
  21. TABLE 6 North America Used Cooking Oil Market Size, by Country, 2021–2035 (USD Billion) |
  22. TABLE 7 Europe Used Cooking Oil Market Size, by Country, 2021–2035 (USD Billion) |
  23. TABLE 8 Asia-Pacific Used Cooking Oil Market Size, by Country, 2021–2035 (USD Billion) |
  24. TABLE 9 South America Used Cooking Oil Market Size, by Country, 2021–2035 (USD Billion) |
  25. TABLE 10 Middle East & Africa Used Cooking Oil Market Size, by Country, 2021–2035 (USD Billion) |
  26. TABLE 11 Global Used Cooking Oil Market Size, by Source, 2021–2035 (USD Billion) |
  27. TABLE 12 Global Used Cooking Oil Market Size, by End Use, 2021–2035 (USD Billion) |
  28. TABLE 13 North America Used Cooking Oil Market Size, by Source, 2021–2035 (USD Billion) |
  29. TABLE 14 North America Used Cooking Oil Market Size, by End Use, 2021–2035 (USD Billion) |
  30. TABLE 15 Europe Used Cooking Oil Market Size, by Source, 2021–2035 (USD Billion) |
  31. TABLE 16 Europe Used Cooking Oil Market Size, by End Use, 2021–2035 (USD Billion) |
  32. TABLE 17 Asia-Pacific Used Cooking Oil Market Size, by Source, 2021–2035 (USD Billion) |
  33. TABLE 18 Asia-Pacific Used Cooking Oil Market Size, by End Use, 2021–2035 (USD Billion) |
  34. TABLE 19 South America Used Cooking Oil Market Size, by Source, 2021–2035 (USD Billion) |
  35. TABLE 20 South America Used Cooking Oil Market Size, by End Use, 2021–2035 (USD Billion) |
  36. TABLE 21 Middle East & Africa Used Cooking Oil Market Size, by Source, 2021–2035 (USD Billion) |
  37. TABLE 22 Middle East & Africa Used Cooking Oil Market Size, by End Use, 2021–2035 (USD Billion) |
  38. TABLE 23 Competitive Benchmarking Matrix – Used Cooking Oil Market, 2026 |
  39. TABLE 24 Company Profiles – Key Players, Used Cooking Oil Market |
  40. TABLE 25 Recent Developments & Strategic Announcements, 2023–2025 |
  41. TABLE 26 Report Scope & Methodology Summary |
  42. TABLE 27 Detailed Sources & Citations Index
  43. 16 LIST OF FIGURES |
  44. FIGURE 1 Used Cooking Oil Market Dynamics – Drivers, Restraints & Opportunities |
  45. FIGURE 2 Industry Value Chain Analysis – Collection to End Use |
  46. FIGURE 3 Porter's Five Forces Analysis – Used Cooking Oil Market |
  47. FIGURE 4 Global Market Size Trend & Forecast, 2021–2035 (USD Billion) |
  48. FIGURE 5 Year-over-Year Growth Rate Trend, 2022–2035 (%) |
  49. FIGURE 6 Market Share by Source, 2025 vs 2035 (%) |
  50. FIGURE 7 Market Share by End Use, 2025 vs 2035 (%) |
  51. FIGURE 8 Regional Revenue Share Distribution, 2025 (%) |
  52. FIGURE 9 Regional CAGR Comparison, 2026–2035 (%) |
  53. FIGURE 10 Europe Country-Level Share Breakdown, 2025 (%) |
  54. FIGURE 11 Asia-Pacific Country-Level Share Breakdown, 2025 (%) |
  55. FIGURE 12 Competitive Landscape – Estimated Revenue Share Ranges, 2026 |
  56. FIGURE 13 Vertical Integration Map – Collectors to Biorefiners |
  57. FIGURE 14 Carbon Intensity Pricing Sensitivity, 2026–2035

Segmentation Quick Reference

DimensionSub-SegmentsDominant SegmentFastest Growing Segment
By SourceHoReCa; Household Kitchens; Food Processing PlantsHoReCaHousehold Kitchens
By End UseBiodiesel and HVO; Oleo-Chemicals; Animal Feed; OthersBiodiesel and HVOBiodiesel and HVO
By GeographyNorth America; South America; Europe; Asia-Pacific; Middle East and AfricaEuropeAsia-Pacific


Market Segmentation Overview

By Source

Sub-SegmentKey Trend
HoReCaMulti-year fixed-margin contracts replacing spot pickups as processors secure guaranteed volume
Household KitchensMunicipal drop-off networks and deposit-style incentives lifting recovery rates from a low base
Food Processing PlantsDirect-to-biorefinery supply agreements bypassing traditional aggregators


Source mix is stable in share terms but shifting in contract structure. Commercial kitchens will remain the volume anchor through 2035, while household recovery grows fastest from a small base wherever municipalities fund infrastructure. Industrial generators enjoy the strongest bargaining position because their material needs the least pre-treatment.

By End Use

Sub-SegmentKey Trend
Biodiesel and HVOMandate-driven demand with aviation fuel emerging as the highest-value outlet
Oleo-ChemicalsBio-content disclosure rules pulling waste-derived fatty acids into surfactants and lubricants
Animal FeedRegionally constrained by feed-ban regulation; growth limited to permissive jurisdictions
OthersNiche industrial applications including specialty lubricants and candle manufacturing


Fuel applications will keep absorbing roughly two-thirds of global volume, and the internal split between road diesel and aviation is where the real contest lies. Oleo-chemical buyers pay more per tonne but qualify suppliers slowly, so the segment expands steadily rather than sharply. Feed use stays flat in Europe and grows modestly in permissive Asian and South American markets.




Download PDF ×

We do not share your information with anyone. However, we may send you emails based on your report interest from time to time. You may contact us at any time to opt-out.